Weather and Climate Extremes 30 (2020) 100287
Available online 29 October 2020
2212-0947/© 2020 The Authors. Published by Elsevier B.V. This is an open access article under the CC BY-NC-ND license (http://creativecommons.org/licenses/by-nc-nd/4.0/).
Which heatwave measure has higher predictive power to prevent health
risks related to heat: EHF or GATO IV? – Evidence from modelling Lisbon
mortality data from 1980 to 2016
Liliane Morais
a,1, Ant´onio Lopes
b,2, Paulo Nogueira
a,c,* aInstitute of Environmental Health (ISAMB), Faculty of Medicine, University of Lisbon, Lisbon, Portugal bInstitute of Geography and Spatial Planning (IGOT), University of Lisbon, Lisbon, Portugal cNational School of Public Health (CISP), New University of Lisbon, Lisbon, PortugalA R T I C L E I N F O Keywords: GATO IV EHF Public health Heatwaves Heat health Surveillance system A B S T R A C T
To prevent the risk associated with heat-related health, several countries and institutions have built heat-health warning systems (HHWS). An HHWS is designed to alert the general public and decision-makers about the danger of high temperature by triggering a series of actions that avoid adverse health outcomes. The comparison of the various HHWS is complicated because there is no universal quantitative definition to predict and define a heatwave. The slightest variability at the threshold of definition the heatwave can trigger considerable differ-ences in the action plan, health service demand and the time the population at risk must prepare. The choice of the index influences the number of days of heatwaves and its characteristics, such as severity. Estimating the risk of mortality associated with heatwave is variable according to the indexes, and the selection of the threshold is essential to prevent the burdens of heat on public health. The aim is the comparison between two metrics to know, which has higher predictive power to prevent health risks related to heat. On the one hand, a new way of defining heatwaves that have generated high consensus worldwide - the Excess Heat Factor (EHF); on the other hand, the Generalized Accumulated Thermal Overload (GATO IV) – an opportunity to improve the existing Lisbon heatwaves surveillance system. Daily mortalities and air temperatures from 1980 to 2016 in Lisbon with both indexes are modelled using Generalized Linear Models, with the calculation of the predictive power of the models using ROC curves for two levels of mortality severity. It is concluded that for total mortality, both indexes were statistically significant. Though, for daily mortality in individuals with 65 years or older with all diseases of the circulatory and respiratory system, when considering both indexes together, GATO IV was the only index significantly predicting the impact of heatwaves on mortality. GATO IV metric seems to have the best statistical properties. Nevertheless, EHF also stands out as a good indicator to predict heat-related mortality in Lisbon.
1. Introduction
Numerous authors have analyzed a wide range of potentially harmful impacts of climate change (IPCC 2007; Forzieri et al. 2017; Costello et al. 2009). Besides that, several international strategies have been devel-oped, such as the United Nations Sustainable Development Goals, the Paris Agreement or the Intergovernmental Panel on Climate Change (IPCC). This last one produced a special report about the impacts of
global warming of 1.5 ◦C above pre-industrial levels, intensify efforts to
demonstrate the effects of climate change, exposing the vulnerability (spaces and people) and the need for adaptation measures by policy-makers (EEA, 2018; WHO 2018; WHO 2019; IPCC 2018; UN 2015).
Moreover, epidemiological studies about heatwaves in many parts of the world has already concluded that: i) they would be more frequent, earlier and more intense; ii) one of the most vulnerable groups are the elderly (≥65 years) - ageing disrupts the body’s physiological ability to * Corresponding author. Laborat´orio de Biomatem´atica, Instituto de Medicina Preventiva e Saúde pública, Faculdade de Medicina da Universidade de Lisboa, Av. Prof. Egas Moniz, 1649-028, Lisboa, Portugal.
E-mail addresses: [email protected] (L. Morais), [email protected] (A. Lopes), [email protected], paulo.nogueira@edu. ulisboa.pt (P. Nogueira).
1 Instituto de Saúde Ambiental da Faculdade de Medicina da Universidade de Lisboa, Av. Prof. Egas Moniz, 1649-028, Lisbon, Portugal 2 Instituto de Geografia e Ordenamento do Territ´orio da Universidade de Lisboa, R. Branca Edm´ee Marques, 1600-276, Lisboa, Portugal
Contents lists available at ScienceDirect
Weather and Climate Extremes
journal homepage: http://www.elsevier.com/locate/wacehttps://doi.org/10.1016/j.wace.2020.100287
regulate its temperature (thermoregulation) - and those with chronic diseases, mainly the cardiovascular and respiratory disorders, and especially the combination of these two conditions; iii) urban population and urban infrastructures are even more vulnerable due to the urban heat island (UHI) - the temperature is higher in urban areas than in surrounding areas as a result of man’s intervention - which exacerbates the effects of heatwaves; iv) they are associated with increased morbidity and mortality, the latter being the health outcome most commonly used to assess the consequences of heat; v) these are events that represent a burden on public health and with significant economic costs (Heo et al. 2019; Campbell et al. 2018; WHO 2017; EEA 2017; Filho et al. 2017; Huang et al. 2011; Kouis et al. 2018; Li and Bou-Zeid 2013; Meehl and Tebaldi, 2004; WHO 2018; Watts et al. 2018; WMO & WHO 2015).
Many of these conclusions are validated over time with effects already observed. For example, heatwaves were considered the dead-liest extreme weather event between 1991 and 2015 in Europe, espe-cially in southern and western Europe, causing tens of thousands of premature deaths. The 2003 heatwave, alone, registered 70,000 excess deaths in Europe, in late July and the first weeks of August (Robine et al., 2008). However, from the time series perspective, the interpretation of this singular heatwave can be dominated even by a single extreme event from June to September 2003 in southern and western Europe (EEA, 2017). Heatwaves have become more frequent, as well as tropical nights (>20 ◦C), and there are several record high temperatures. The number of
hot days (>35 ◦C) has also increased, with particularly strongest trends
in the Iberian Peninsula and southern France. There is high confidence that heatwaves have become more severe in southern Europe and the Mediterranean (WHO 2018; EEA 2017; EEA 2018; Kendrovski et al. 2017).
This matter is of the highest importance because of the expected projected future, increasing impacts on human health, foreseen by several authors. The IPCC (2018) special report indicates that "Any in-crease in global warming is projected to affect human health, with pri-marily negative consequences (high confidence)". It is also estimated that at 1.5 ◦C, the risks will be lower than 2 ◦C for heat-related morbidity
and mortality (very high confidence). Europe will be a particularly sensitive area to temperature rise, whose warming will be higher than the global average increase expected. Without measures of adaptation and physiological acclimatization, heat-related mortality in Europe, especially in southern Europe, would increase between 60,000 and 165, 000 deaths per year in the 2080s, compared to the current baseline (EEA, 2017). If no new measures are taken, the economic burden of heatwaves in the European Union is expected to be € 150 billion by 2050 (EEA, 2015). The countries of the Mediterranean will be the most affected by heat, is considered a "hotspot of climate change impacts" (EEA, 2017) and the Iberian Peninsula (IP) will be warmer at the end of the XXI century, with more and longer heatwaves (Pereira et al., 2017). For the Mediterranean region and the IP, it is projected that the regu-larity of heatwave days increases from an average of two days per summer for the period 1961-1990 to about 13 days for 2021-2050 and 40 days for 2071-2100 (Fischer and Sch¨ar, 2010). A study by Dessai (2003) in Lisbon, estimated that annual heat-related mortality would increase from 5.4 to 6.0 (per 100,000) in 1980–1998 to 5.8–15.1 by 2020s and to 7.3–35.6 in the 2050s. There is no doubt that heatwaves are a serious public health issue associated with a high economic cost.
To prevent the risk associated with heat-related health, several countries and institutions had built a heat-health warning system (HHWS), which before the unprecedented heatwave of 2003 few countries in Europe had (Lowe et al. 2011). An HHWS is designed to alert the general public and decision-makers about the danger of high temperature by triggering a series of actions that avoid adverse health outcomes. The basis of an HHWS is the choice of the heatwave metric, prediction of heatwaves, monitoring the occurrence of diseases and alert to competent institutes. A heatwave warning is issued to the public when the temperature exceeds the selected threshold for several consecutive
days, and the excess deaths are predicted (Heo and Bell 2018; WMO & WHO 2015; Heo et al. 2019).
However, the comparison of the various HHWS is complicated because there is no universal quantitative definition to predict and define a heatwave. Depending on the country, political systems, avail-able resources, demographic factors and health status there are numerous metrics, e.g. threshold temperature or a biometeorological index, that estimate the heat-related health outcomes (Fischer and Sch¨ar, 2010; Lowe, Ebi and Forsberg, 2011; Zhang et al., 2014; WMO, 2015; Barcena-Martin, Molina and Ruiz-Sinoga, 2018; Fenner et al., 2019). So, the crux of the matter is that most HHWS have more than one level of warning and the slightest variability at the threshold of defini-tion the heatwave can trigger considerable differences in the acdefini-tion plan, health service demand during the defined period and the time the population at risk has to prepare (WMO & WHO 2015; Lowe et al. 2011; Scalley et al. 2015). Some researchers have shown that the choice of the index for the heatwave definition in HHWS influences the number of days of heatwaves and the characteristics of the heatwave, such as severity. In this way, estimating the risk of mortality associated with the heatwave is variable according to the indexes (Heo et al. 2019; Heo and Bell 2018). That is why the use of the appropriate heatwave definition is so critical.
Notwithstanding the above, Nairn and Fawcett (2015) have built up a metric on the definition of the heatwave and its severity for the Australian Bureau of Meteorology’s National Heatwave Service that has met with a lot of consensuses, namely from WHO (WMO, 2015). The methodology used is from the Excess Heat Factor (EHF), based on three-day-averaged daily mean temperature (DMT), includes the accli-matization phenomenon, the ability of local communities to adapt to their climate and captures the intensity of the heatwave as it applies to health outcomes. By its characteristics, the EHF metric is increasingly used with potential for international applicability, i.e. allows the ho-mogenization of the description of the intensity of the heatwave and thus the comparison in any geographical location of events of heatwaves and their impacts (Campbell et al. 2018; Loridan et al. 2016; Nairn et al. 2018; Nairn and Fawcett 2015; Scalley et al. 2015). With strong encouragement in the use of this method in health services and as trigger for heatwave plans, the national meteorological agencies in Australia, the UK and United States have already put in operation or are under analysis, on the use the Excess Heat Factor (Nairn et al. 2018; Scalley et al. 2015).
Similarly, Nogueira et al. (1999) proposed a metric called the Accumulated Thermal Overload (ATO) to model heat-waves impacts in Lisbon, operationalized through the ICARUS′ Index, which was the
construct for establishing the Portuguese Heat Health Warning System (HHWS) in 1999 – the ´ICARO Surveillance System – the first in Europe and the only one fully operational in 2003, during the European Heat Wave. This monitoring system of heatwaves with potential impacts on population’s morbidity and mortality is triggered annually between May and September and predicts, three days in advance, the possibility of heat occurring with enough intensity to influence mortality. This system is based on the relation between heat and mortality adjusted with data from the Lisbon district daily mortality to the heat waves of June 1981 (excess of 1900 deaths) and July 1991 (excess of 1000 deaths). In summer 2003 (1953 death after adjusting for populations age) the alert was triggered on three occasions, which corresponded to the heat waves from 18-20 June, 29 July to 13 August and 11 to 14 September, proving the reliability of the selected threshold (Garcia et al., 1999; Direcç˜ao Geral Saúde, 2003; Paix˜ao and Nogueira, 2003; Calado et al., 2004). The occurrence of 2003’s remarkable heatwave presented the opportunity for updating the existing model introducing the Generalized Accumu-lated Thermal Overload (GATO) based on several dynamic thresholds through the summer. Four distinct reference temperature’s thresholds were essayed, GATO IV, (a dynamic threshold that follows the upward phase of the summer temperatures until reaching its maximum level at the end of August remaining until then constant until the end of the
summer) (Nogueira and Paix˜ao, 2008; Nogueira, 2011) emerged as the optimal threshold for the ICARUS′models. The GATO IV has a construct
of the population’s adaptation to heat, similarly to EHF.
It is in this context and with absolute awareness that the selection of the threshold for the heatwave setting is essential to prevent current and future burdens of heat impacts on public health that, one of aim of this work is a comparison between two metrics, the EHF and Generalized Accumulated Thermal Overload with threshold IV (GATO IV).
So, keeping in mind that an HHWS can always be improved, the EHF metric is an opportunity to assess whether GATO IV remains the best index to protect the public health of the Portuguese or whether changes should be made. In this paper, we aim to determine which heatwave measure has higher predictive power to prevent health risks related to heat. Lisbon municipality, an urban environment with dense population, is considered. Daily mortalities and air temperatures from 1980 to 2016, along with both excess heat indexes: EHF and GATO IV are modelled using Poisson Regression and Negative Binomial Regression (General-ized Linear Models); with the calculation of the predictive power of the models using ROC curves for two levels of mortality severity.
2. Methods
2.1. Data and sources
This work considered daily mortality and daily temperatures data from the municipality of Lisbon from 1980 to 2016. Mortality data were obtained from the Portuguese Statistical Office (Statistics Portugal) mortality databases, and the data of Lisbon air temperatures were ob-tained from the NOAA’s National Climatic Data Center site (NCDC, 2018). Considered mortality data consisted in the daily number of Lis-bon Municipality residents’ deaths either total mortality (all ages and all causes); and subdivided by age group (individuals aged 65 years old or more) and specific causes of death (diseases of the circulatory system (ICD - Cap. IX-I00 to I99) and respiratory system (ICD - Cap. X-J00 to J99), based on the International Classification of Diseases (ICD) 10th revision.
2.2. Statistical analysis
Extended summer (May to September) daily mortality data series, from 1980 to 2016, was modelled using Poisson Regression and Nega-tive Binomial Regression (Generalized Linear Models using log() as link function as error distributions Poisson and Negative Binomial, respec-tively), where functions of: the excess heat indices - Excess Heat Factor (EHF), Generalized Accumulated Thermal Overload with dynamic threshold IV (GATO IV), and indicator variables of the year (to model eventual changes in the yearly mean mortality) were used as indepen-dent variables. Namely, these models can be written in mean terms as.
Poisson Model
Loge(NDeaths) =β0+B ⋅ Year + β1⋅ GATOIV + β2EHF
Loge(NDeaths) =β0+B ⋅ Year + β1⋅GATOIV
Loge(NDeaths) =β0+B ⋅ Year + β2⋅EHF
Negative Binomial model
Loge(NDeaths) =β0+B ⋅ Year + β1⋅ GATOIV + β2⋅ EHF + u
Loge(NDeaths) =β0+B ⋅ Year + β1⋅ GATOIV + u
Loge(NDeaths) =β0+B ⋅ Year + β2⋅ EHF + u
In these models, NDeaths designates the number of daily observed
deaths; β1 is the regression coefficient representing the effect of change
of a 1 unit in GATO IV index; β2 is the regression coefficient representing
the effect of change of a 1 unit in the EHF index; IRR is calculated as Exp
(βi) in the respective i-th index representing a relative increase in the
number of daily deaths per 1 unit increase in the index; B is a vector of
βj,j = 1980, ⋯, 2016 for each year; and Year is a categorical variable
with the years from 1980 to 2016 (which can be referred as a matrix with an indicator variable for each year); β0 and u represent estimated
constants in the model; u is specifically included in the NB model to account for extra variance.
These models forecast/predict the mean expected number of deaths per day during the extended summer period. Generically, using the more complex model expression, the mean expected number of deaths per day is given by,
̂
NDeaths=E(NDeaths) =exp
{ ̂
β0+ ̂B⋅Year + ̂β1⋅GATOIV + ̂β2⋅EHF + ̂u
}
A significance level of 5% was considered for all statistical analyses.
2.3. Construction of variables
The EHF, whose detailed methodology can be consulted in Byard et al. 2013 and Nairn and Fawcett 2015, consists of the product of two excess heat indexes (EHIs): the significance index (EHIsig), as measure of
heatwave intensity; and the acclimatization index (EHIaccl), considering
short-term acclimatization to ambient temperature in recent past. These indexes were calculated as follows:
EHIsig =(Ti +Ti+1 +Ti+2)/3 – T95 and EHIaccl =(Ti +Ti+1 +Ti+2)/3 – (Ti–1 +
… +Ti–30)/30 Where: Ti indicates daily mean temperature on day i, T95 represents the 95th percentile of daily mean temperature and the units of both indexes are ◦C. So, EHI
sig is a three-day-averaged of daily mean
tem-perature (starting on day i) against the 95th percentile of daily mean temperature, and EHIaccl is an anomaly of three-day of daily mean
temperature regarding the prior 30 days.
The daily EHF is defined as a product of these two indexes: EHF = max(0, EHIsig) × max(1, EHIaccl)
The units of EHF are ◦C2. Zero EHF values represent days without
heat. Heatwaves are related to high positive values of EHF.
This means that positive EHF value triggers potential heatwave ef-fects warnings.
The GATO index results from the evolution of an index, the accu-mulated thermal overcharge (ATO) and a series of tests performed with multiple dynamic thresholds, whose threshold that best fits the Portu-guese population is threshold IV. See the methodology details in Nogueira and Paix˜ao 2008 and Nogueira 2011. The GATO index is expressed as follows:
GATOt (τ) = GHLent (τ) × Exct(τ)
where GHLent(τ) = ⎧ ⎨ ⎩ DHLent− 1(τ) +1 if maxt≥τ
DHLent− 1(τ) − 1 if maxt<τ∧DHLent− 1(τ) >0
0 if maxt<τ∧DHLent− 1(τ) =0
is a weighting of the very close occurrence of several days where the maximum air temperature is above τ until day t.
The Exct(τ) is the excess of the maximum temperature above Exct(τ)
in day t.
Exct(τ) =
{
maxt− τ if maxt>τ
0 if maxt≤τ
Here τ corresponds to a generic Threshold (either fixed or Dynamic). We consider here threshold IV, varying accordingly to the superior weekly limits of the maximum air temperatures distribution starting in τ =29 ◦C in May, until week 22 – end of May/beginning of June. Is
=35 ◦C until the end of September. It is adjusting summer’s air
tem-peratures evolution with added short-term adaptation (Nogueira, 2011; Nogueira, Paix˜ao and Morais, 2013).
τIV=
{
29 + (t − 22) if week22 ≤ t < week28
35 if t ≥ week 28
The basis of the variable GHLent (τ) is to allow the effect of the occurrence of several days of high temperatures (above the threshold τ) to remain latent for some time. So, if another peak of heat occurs very close, the effect of the previous peak can still be included in the pre-diction model. Thus, if in the middle a remarkable heatwave occurs one or two days with the temperature below its threshold, the modelling process does not make a reset, it only does a "cooling", reducing the latent load of exposure to excess heat.
The rational of the threshold IV (τIV), is the gradual adaptation to increasing temperatures that generally occur over the weeks and that after the adaptation to temperatures up to the 35 ◦C threshold there is no
strong reason this adaptation to decrease as rapidly as the highest observed temperature decreases at the end of summer.
A heat warning is triggered when the GATO IV value is positive.
2.4. Reliability of the models
To analyze the reliability of the models, i.e. the capability of the models to correctly forecast days with the highest mortality, we used the ROC curve. This graphic technique, based on the observed distributions of mortality from May to September, uses basic concepts of epidemi-ology such as sensitivity (true-positive rate) and specificity (true-nega-tive rate) that are the most commonly used measures of detection accuracy. Besides, allow the assessment of the best performance among different models (Joy, Penhoet and Petitti, 2005). Based on the observed distributions of mortality from May to September, these concepts are defined as (Nogueira and Paix˜ao, 2008):
Sensitivity – the proportion of days where a high number of deaths
was forecasted by the model, among the days where effectively a high number of deaths was observed.
Specificity – the proportion of days where a non-high number of
deaths was forecasted by the model, among the days where effectively a high number of deaths did not occur.
The ROC curve represents sensitivity and specificity for all possible values for the cut-off point, being a procedure that combines features capable of adapting to the complexity of the heatwaves. In addition, the area under the ROC curve (AUC) is an objective measure of the perfor-mance of the model. The AUC comprises values from 0 to 1, where a value of 0 indicates a forecasting capacity of the model perfectly inac-curate and a value of 1 reflects a forecasting capacity of the model perfectly accurate. In terms of interpretation, an AUC = 0.5 suggests that the model has no discrimination (i.e., the capability of the models to correctly forecast days with and without the highest mortality, the curve will fall on the diagonal, 45-degree line); values of AUC from 0.7 to 0.8
indicate the underlying model has an acceptable discriminatory capac-ity; values of AUC from 0.8 to 0.9 indicate excellent discriminatory ca-pacity and values of AUC equal or superior 0.9 indicate outstanding discriminatory capacity. In general, the model with the higher AUC may be considered better (Hosmer and Lemeshow, 2000).
For each considered mortality (total mortality and mortality by Circulatory or Respiratory systems diseases in individuals aged 65 years old or more (deaths ≥ 65 + CRD)) two different limits were considered defining effective observed days with excess mortality. These limits were estimated as Tukey limits for moderate and severe outliers [limit 1 = Q3 + 1.5⋅(Q3 − Q1) and limit 2 = Q3 + 3⋅(Q3 − Q1)] – thus indicating days with excess mortality [ ̂NDeaths>limit 1] and days
with very high mortality [ ̂NDeaths>limit 2].
Thus, we evaluated the predictive power of these two mortality sets in a series of years (for 37 years, 1980 to 2016) with two levels of mortality severity. The aim was to compare models’ AUC.
3. Results
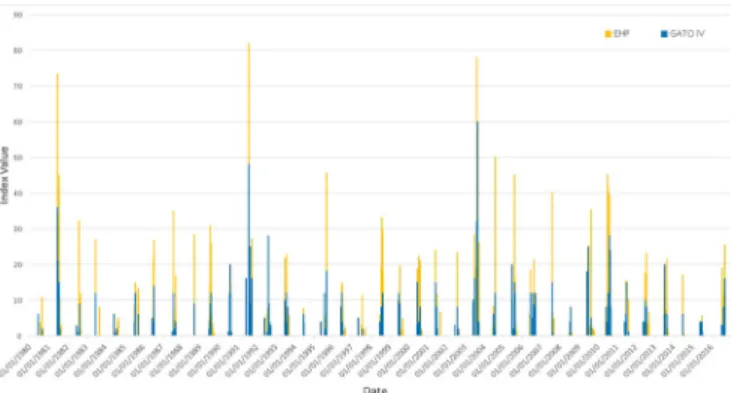
3.1. GATO IV and EHF in Lisbon (from 2001 to 2016)
Fig. 1 shows the value of the two indexes from 2001 to 2016, in Lisbon, and Table 1 the number of days when indexes were positive, also in Lisbon, from 1980 to 2019. We can see some differences in both indices. While EHF has mostly a higher index value and has in every decade a greater number of days with a positive sign, the GATO IV is much more conservative.
2.2 Mortality in Lisbon’s municipality, maximum temperature and heat-related indexes: GATO IV and EHF (from May to September be-tween 1980 and 2016).
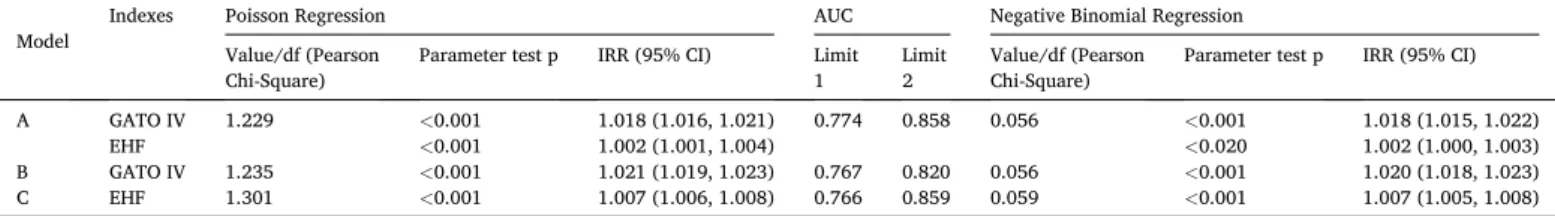
Fig. 2 shows daily observed deaths for total mortality (all ages, all causes), maximum temperature and each of the indexes. The EHF index seems to overestimate some days as having an excess of deaths, not being able to verify if they are phenomena effectively associated with the heat. In any case, this does not imply that these excesses of mortality
Fig. 1. Daily value of two indexes, GATO IV and EHF, Lisbon, 2001 to 2016.
Table 1
Number of days, per decade, with a positive index of GATO IV and EHF, Lisbon, 1980 to 2019. * Data from 2010 to 2016; ** Estimate for 2010 to 2019.
Decade GATO IV EHF
1980 59 106
1990 107 160
2000 105 181
2010 * 59 88
2010 ** 84 126
Fig. 2. Observed daily deaths (Lisbon residents’ total mortality), daily
maximum air temperature in Lisbon and the daily values of two indexes, GATO IV and EHF from May to September, of 1980–2016.
are not being identified by the index, although they do not reflect them rigorously in its dimension. Overall, graphically, both indexes are difficult to compare because they have different magnitudes.
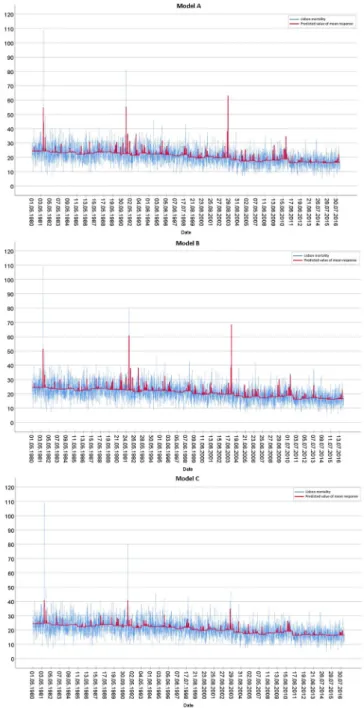
From Fig. 3, we analyze the circulatory and respiratory deaths in the elderly living in Lisbon (deaths in individuals aged 65 years old or more coded as circulatory or respiratory systems’ diseases). Like the analysis made for total mortality, we also register for this set of the population that the EHF index overestimates some excess of deaths and the GATO IV is more conservative, but always able to detect the peaks of mortality.
3.2. Modelling Lisbon’s municipality daily mortality (from May to September between 1980 and 2016)
3.2.1. Model for total mortality (all ages, all causes)
A Poisson regression was performed to model the extended summer (May to September) daily mortality in Lisbon municipality using GATO IV and EHF indexes as independent variables.
Table 2, below, shows model parameter estimates and goodness-of- fit measures for models using GATO IV and EHF simultaneously (Model A), using GATO IV only (Model B), using EHF only (Model C) all adjusted for year mean level of mortality.
In column 3 is presented the goodness-of-fit measure the over-dispersion statistic "Value/df" based on "Pearson Chi-Square" statistic where the ideal theoretical value should be 1 (equidispersion). We observe value slightly higher than 1 for the three essayed models. This means that there is slight overdispersion in these models, but these are
acceptable values to keep the equidispersion assumption. Over-dispersion is slightly higher in Model C (1.301).
Table 2 also shows that parameters associated with both indexes are statistically significant in the three models. In model A, GATO IV index estimated Incidence Rate Ratio3 (IRR) ("Exp(B)") is higher than for EHF. For GATO IV, the number impacts on mortality were 1.018 (95% CI: 1.016–1.021) per unit of the index, with p < 0.001 (p = 1,75*10−61). For
EHF index, we obtained an IRR = 1.002 (95% CI: 1.001–1.004) with p < 0.001 (p = 0,000149).
This same pattern is repeated when the variables are modelled separately. Both indexes maintain statistical significance and the IRR estimates increase. In model B, which considers GATO IV index has IRR =1,021 (95% CI: 1.019–1.023), i.e. for each unit increase of GATO IV there is a 2.1% increase in the expected number of deaths (associated with heat). We cannot say that because GATO IV has a higher IRR is better than EHF. The magnitudes of each index are different, but we note these differences.
Negative binomial regression was performed to avoid any potential errors in the previous analysis due to slight overdispersion. The most
significant difference is in model A, where the EHF regression parameter loses most of its significance. Individually, both GATO IV and EHF in-dexes are statically significant.
Fig. 4 presents an overview of Lisbon residents’ mortality with model adjustment in the 37 years of data. Models A and B show a higher adherence to the significant heatwaves of 1981, 1991 and 2003 excess mortality. Also, worth noting it that models seem to adjust to many other heat waves and heat periods with remarkable lower magnitudes. Model C seems to have lower adherence to the known higher excess mortality peaks associated with heat occurrence fit of the model, however, as shown in Table 2, it also pinpoints the days with excess mortality, although failing to capture respective magnitudes.
An overall analysis of the predictive accuracy of each model, Fig. 5, shows very good values of both sensitivity and specificity to identify days with excess mortality and very high mortality, particularly this last one. The ROC curves of the three models and at both limits reveal that they are significantly different from a random classification (AUC = 0.50). At limit 2, Table 2 shows that the area under the ROC curve (AUC) is high, manifesting that the models predict the majority observed days with very high mortality. The three models have AUC values between 0.8 and 0.9, classifying them as having excellent discriminatory capac-ity. The model with the lowest AUC was model B, with 0.82, but the others had 0.85, not showing any discrepancy.
Differences in predictive performance between models for days with excess mortality (limit 1) are also minimal. The data in Table 2 show that the model with the highest AUC was model A with 0.77 and the other Fig. 3. Observed daily deaths coded as diseases of the circulatory and
respi-ratory systems in Lisbon resident’s aged ≥ 65 years, daily maximum air tem-perature in Lisbon and the daily values of two indexes, GATO IV and EHF from May to September, of 1980–2016.
Table 2
Parameter estimates of Poisson Regression and Negative Binomial Regression modelling total Lisbon resident’s daily mortality, from May and September 1980–2016 and models’ goodness-of-fit. Model A – uses two indexes GATO IV and EHF; Model B – considers GATO IV index only and model C – considers Index EHF only. Note: All models are adjusted for the year using an ordinal variable. AUC – Area under the ROC curve, assess the models’ predictive ability in the 37-year period, considering two thresholds: limit 1 - days of excess mortality (threshold ≥ 30.5) and limit 2- days of very high mortality (threshold ≥ 41).
Model Indexes Poisson Regression Value/df (Pearson AUC Negative Binomial Regression
Chi-Square) Parameter test p IRR (95% CI) Limit 1 Limit 2 Value/df (Pearson Chi-Square) Parameter test p IRR (95% CI) A GATO IV EHF 1.229 <<0.001 0.001 1.018 (1.016, 1.021) 1.002 (1.001, 1.004) 0.774 0.858 0.056 <<0.001 0.020 1.018 (1.015, 1.022) 1.002 (1.000, 1.003) B GATO IV 1.235 <0.001 1.021 (1.019, 1.023) 0.767 0.820 0.056 <0.001 1.020 (1.018, 1.023) C EHF 1.301 <0.001 1.007 (1.006, 1.008) 0.766 0.859 0.059 <0.001 1.007 (1.005, 1.008)
3 IRR - incidence rate ratio is the ratio of two incidence rates. It is the
parameter obtained from poisson or negative binomial regression. In terms of interpretation it is somewhat like the Odds Ratio (OR) that is obtained when using logistic regression.
two models had 0.76. The three models are considered as having an acceptable discriminatory capacity to identify days with excess mortality.
We conclude that the ROC curves are essentially the same in the three models and the two limits. There are no major discrepancies.
3.2.2. Model for circulatory and respiratory deaths in the elderly living in Lisbon(deaths in individuals aged 65 years old or more coded as
circulatory or respiratory systems’ diseases)
Specific mortality modelling using Poisson regression shows similar results either in parameter estimates and in goodness-of-fit. There is an overall high goodness-of-fit, similar to what was observed for total mortality. Models fit with a little overdispersion but lower in this set of mortality than for total mortality. The value in the "Value/df" based on "Pearson Chi-Square" show that models A and B seem more adequately adjusted by the Poisson Model. The model C, including only the variable
EHF, continues to show the most considerable overdispersion value (1.272).
Table 3 shows that for model A, only GATO IV index is statistically significant with a p < 0.001.
Performed separately, models B and C, show that both GATO IV and EHF indexes are statically significant. Incidence Rate Ratio estimate for GATO IV (1.026 with 95% CI, 1.023 to 1.029) is higher than for EHF (1.008 with 95% CI, 1.006 to 1.009) because in average when positive, GATO IV index is less than half of EHF - this is visible in Fig. 3. It is noteworthy that all models have a very similar capacity of predicting days with excess mortality. Model B seems to be better because it seems to predict days with very high mortality and has lower overdispersion. All these facts are supported by negative binomial regression. In model A, GATO IV is again the only index statistically significant with p
<0.001. Alone, both indexes are statically significant.
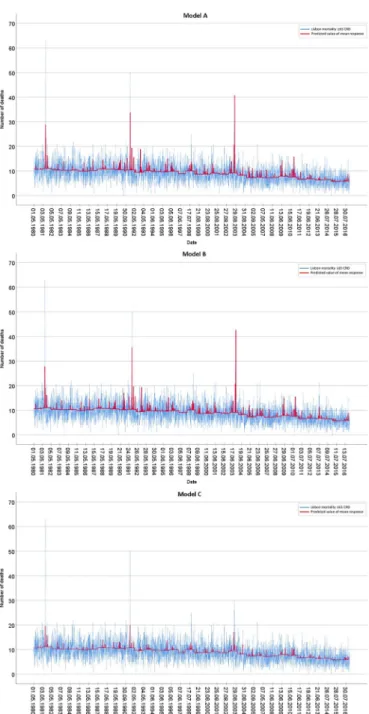
Fig. 6 shows models (A, B and C) fits. In general, for this population and specific mortalities, models predict the highest peaks of mortality. Models A and B seem better at estimating significant excess mortality magnitude impacts (the three remarkable heat waves of 1981, 1991 and 2003).
The estimated predictive values for this population, older and with circulatory and respiratory system pathologies, are slightly lower than those observed for total mortality, for days with excess mortality (limit 1). In the three models, Table 3 and Fig. 7, the AUC values are the same, 0.74 and for total mortality were 0.76 and 0.77 (Table 2).
However, for days with very high mortality (limit 2), it is noteworthy that for this specific population, the model’s performance has AUC values above 0.90, which classifies them as having outstanding discriminatory capacity for identifying these extreme events. These values are higher than the ones observed for total mortality (0.82 and 0.85). So, the models can foresee days with a high number of deaths when they actually occurred, with almost perfect accuracy – though these are quite rare days. The best model was B including GATO IV index only with an AUC value of 0.953.
The ROC curves are not very different from each other. In terms of selection, there is an almost equal performance decision.
4. Discussion
Our study provides vital insight into specific contributions for modelling the impacts of heatwaves on mortality by comparing two metrics: GATO IV and EHF. We intend to help decision-makers regarding the use of these indexes and update heatwave definition as also improving its HHWS, identifying more accurately heatwave periods and best protect the citizens from health risks, in this case, heat-related mortality.
From the results from 1980 to 2016 in Lisbon municipality, it seems that for the two sets of mortality in the study, total mortality and deaths ≥65 + CRD, GATO IV has slight better statistical properties accurately predict mortality associated with heatwaves. As a matter of fact, for the total mortality set, in model A, the two variables were statistically sig-nificant. This same difference was also recorded when the model was run with each variable separately, leading to distinguish the GATO IV index, maybe due to the different overdispersion in the models. The validity of the models showed very good values of sensitivity and specificity, in specific for days with very high mortality, whose AUC is above 0.80 in the three models. In other words, at this level of mortality, we have more than 80% certainty that one day is, or not, a day with substantial excess mortality associated with heat. These are excellent reliability values.
For the second set of mortality, deaths ≥ 65 + CRD, we can be a little more assertive in saying that GATO IV is better than the EHF. In model A (GATO and EHF), the only statistically significant variable was GATO IV. Even after performing a Poisson GLM without the influence of the EHF index, the values were very similar, even slightly higher for the expo-nential value, which confirms the predictive capacity of GATO IV. The Fig. 4. Observed and models expected Lisbon residents’ daily total mortality,
from May to September 1980 to 2016. Model A (indexes GATO IV and EHF); Model B (GATO IV index) and Model C (EHF index).
values of the model’s reliability are still higher than the previous set of mortality, revealing a predictive performance close to the ideal (value 1), especially for the level of days with very high mortality, which AUC is 0.953 in the best model B (with only the GATO IV index).
From these facts, three main issues deserve to be discussed: i) Predictive capacity is higher for the older population with all diseases of
the circulatory and respiratory system; that is, the model is better detecting a day with excess mortality in this population. Why?
The results are not particularly discrepant between the two sets of mortality, but for the older population with all diseases of the circula-tory and respiracircula-tory system, the model presents better results. These facts support the choice made a priori, to separately analyze this pop-ulation and is following the presented literature that highlights the heatwaves and their ratio of excess mortality in this particular population.
Therefore, it was expected since mortality in the elderly and with circulatory and respiratory disorders is a very substantial part of all mortality. The model detects a different vulnerability for this Fig. 5. Roc curves performed to assess the model’s predictive ability for total mortality over the 37-year period (1980–2016) in Lisbon. On the left side, limit 1,
considered the days with excess mortality (threshold ≥ 30.5) and on the right side, limit 2, considered days with very high mortality (threshold ≥ 41); Model A (indexes GATO IV and EHF); Model B (GATO IV index) and Model C (EHF index).
population, which will be in greater danger from the occurrence of heat. Due to the age and clinical condition, the adaptation of these citizens to the heat should be a priority by local decision-makers. ii) Undoubtedly, the two indexes are very worthy. However, why does GATO
IV perform better than EHF? What are the real differences between these two indexes, whose rationale is the same: the progressive adaptation of the population to high temperature? Moreover, why does the EHF index seem to overestimate the impacts of heatwaves compared to GATO IV?
The previously explained methodology makes it clear that they are two very different indexes. Although the EHF seems more complex and complete, both consider the phenomenon of gradual adaptation to heat. Our interpretation is that the true differential is in the construction of the dynamic thresholds that precisely fit the notion of population adaptation to the gradual evolution of heat. This adaptation is weekly in the GATO IV index and monthly in the EHF index. Also, note that the variables used are equally different: in GATO IV is used the maximum air temperature (the excess of the maximum air temperature is above τ until day t – see the methods component) and in the EHF is used the mean temperature (calculated as the average of the maximum and minimum temperature for a given day) and consists of two indices (one which is the difference between the 3-day mean and the other the mean of the prior 30 days - see methods). This difference of variables will also have its influence, but the capacity and frequency of measuring the phe-nomenon of adaptation will be, in our opinion, the basis of the differ-ences evidenced.
The question to be addressed is the short-term variation in the mortality, i.e. whether day-to-day changes in mortality are better related to weekly temperature level as a phenomenon of adaptation. The results show that yes since the adaptation to heat is more realistic and truthfully captures the dimension of a gradual adaptation. Note the methodolog-ical differences, in GATO IV the adaptive component is calculated by multiplying two elements, the number of consecutive days above a threshold temperature and daily temperature above that threshold, while the adaptive component for EHF is the difference between the three-day mean and the mean of the 30 days earlier. The weekly factor can thus differentiate the monthly variability, that is, one month may have one week with truly atypical temperatures but with the remaining three weeks of not so relevant temperatures. The construction of GATO IV achieves these differences that have repercussions on the impact of mortality. Brief, although the two indexes have dynamic thresholds, whose definition of heatwave depends on the time period in which we are, and the temperature level, the acuity of this principle is higher at a weekly level than monthly.
Another interesting dimension in GATO IV is the notion of gradual "cooling" rather than abrupt cooling, reducing the latent load of heat excess exposition. Thus, it potentially contributes to a better fit of the data because it also captures the concept of gradual recovery from thermal stress. In this way, it can be said that the GATO IV has the short-term adaptation to the evolution of the higher temperatures as well as its inverse.
Table 3
Parameter estimates from Poisson and Negative Binomial Regression modelling of mortality in individuals with 65 years or older and with all diseases of the circulatory and respiratory system in Lisbon, from 1980 to 2016 between May and September, with the indexes GATO IV and EHF (model A), and each index separately (model B with GATO IV and model C with EHF). Note: All models are adjusted for the year as an ordinal variable. AUC - Area under the ROC curve, assess the models’ predictive ability in the 37-year period, considering two thresholds: limit 1 - days with excess mortality (threshold ≥ 16.5) and limit 2- days with very high mortality (threshold ≥ 24).
Model ≥65 + CRD
Indexes Poisson Regression AUC Negative Binomial Regression
Value/df (Pearson
Chi-Square) Parameter test p IRR (95% CI) Limit 1 Limit 2 Value/df (Pearson Chi-Square) Parameter test p IRR (95% CI)
A GATO IV
EHF 1.203 <0.153 0.001 1.025 (1.022, 1.028) 1.001 (0.999, 1.003) 0.748 0.948 0.120 <0.823 0.001 1.025 (1.020, 1.030) 1.000 (0.998, 1.003) B GATO IV 1.200 <0.001 1.026 (1.023, 1.029) 0.743 0.953 0.120 <0.001 1.025 (1.021, 1.030)
C EHF 1.272 <0.001 1.008 (1.006, 1.009) 0.743 0.920 0.126 <0.001 1.007 (1.005, 1.009)
Fig. 6. Observed and models expected Lisbon residents’ daily mean deaths
coded as diseases of the circulatory and respiratory systems in individuals aged 65 years or older, from May and September 1980 to 2016. Model A (indexes GATO IV and EHF); Model B (GATO IV index) and Model C (EHF index).
Both older and more recent scientific literature seem to support many of these signals and thus better fit in GATO IV index. Something already described with some regularity, namely by WHO, is the rela-tionship between temperature and mortality that is often non-linear (V- shaped, U-shaped or J-shaped) (WHO, 2004; Breitner et al., 2014). The two indices, having dynamic thresholds, also define a non-linear form of the relationship between temperature and mortality, but GATO IV has the advantage of making this measurement on a shorter time scale.
The same WHO report highlights that populations have a rapid adaptation to short-term (week-to-week) temperature evolution and that it would be essential to remove the seasonal component of the data series so that only short-term associations (day-to-day) remain to be modelled (WHO, 2004). The report is not completely clear if it is desired to eliminate the seasonality of mortality or temperature data. In this
article, the two components were considered. The modelling of May to October data was made to maintain the homogeneity of mortality data, and dynamic temperature thresholds were tested with the two indexes, which compensate the seasonality in the daily temperatures. This approach was better modelled with the GATO IV index, possibly by the arguments already presented. In the same sequence, it is even mentioned that "the rate of temperature change can be included in the definition of a heatwave to be able to incorporate the concept of short-term accli-matization over the summer" (WHO, 2004).
Other scientists support this short-term adaptation to sustained temperature rise, sometimes making the distinction between the impact on the mortality of heat waves (and its lag effect) and cold waves. The first has a more immediate effect (over a few days), and the latter persist over a more extended time period (several days up to weeks) (Lowe, Ebi Fig. 7. Roc curves performed to assess the
model’s predictive ability for mortality due to diseases of the circulatory and respiratory systems in Lisbon residents aged 65 years or more, from May to September, over the 37- years (1980–2016) in Lisbon. On the left side, limit 1, considered the days with excess mortality (threshold ≥ 16.5) and on the right side, limit 2, considered days with very high mortality (threshold ≥ 24). Model A (indexes GATO IV and EHF); Model B (GATO IV index) and Model C (EHF index).
and Forsberg, 2011; Burkart et al., 2013; Breitner et al., 2014; WMO, 2015; EEA, 2018). The point now is to define short-term. An article dating from 2015, that is specific about adaptations and mechanisms of human heat acclimation, takes as an example the applications for competitive athletes and sports, mentions that the heat acclimation is a process that begins on the first day of exposure, being that 75–80% of these adaptations occur in the first 4–7 days. The authors suggest a timetable for this adaptation, categorizing in short-term acclimation (<7 days), medium-term acclimation (8-14 days), and long-term acclimation (>15 days) (P´eriard, Racinais and Sawka, 2015). Public Health England corroborates this study when it states that in England in 2006 were estimated "75 extra deaths per week for each degree of increase in temperature" (Creagh et al., 2018). All these approaches are closer to the construction of the index GATO IV, especially the latter that makes clear the weekly adaptation of the population to heat. This argument may also explain, in part, some overestimation observed in the results obtained for the EHF index.
iii) Would the inclusion of EHF and GATO IV lags change our results?
And the confounders, like humidity, pollutants, or day of the week?
The main objective of this work focus was on the direct capacity of EHF and GATO IV indexes to predict heat-related mortality. Further work on how to include the lagged indexes versions must be done. This implies using models that consider auto-correlation among these vari-ables. Our preliminary work, without such dependency structures, including lag 0, lag 1, lag 2 for both indexes point out to similar results, i. e. GATO IV seemingly responding more directly than EHF. However, complex models and more work must be performed.
Concerning the confounders, we thought it would be interesting to establish a "direct" comparison between the two-heatwave related metrics. From our experience, no particular evidence was ever pro-duced, in Portugal, relating heatwaves with impact on mortality with humidity or pollutants. Besides that, for the use of pollution, the respective long data series needed does not exist. Also, from our knowledge, the impact of heatwaves in Portugal was never shown to be Day of the Week (DOW) dependent. As far as we understand it, such relation seems to emerge when the impact of the heatwave is modelled using Gasparini model (Gasparrini, Armstrong and Kenward, 2010) to adjust the heat impact on mortality and its lags. We believe that the DOW signal is related to the lag structure not with the direct impact. In fact, we are looking at the capability of the two indexes to correct pinpoint the direct heatwave occurrence – this needs further work to be confirmed or infirmed.
By design, the two used indexes take into consideration the within months temperatures evolution. We believe that it will be an added value if the indexes can predict heatwaves with impact on mortality throughout the summer without any further information.
Some limitations of the study must be recognized. The relationship between heat and mortality is complex, multidimensional and dynamic, with several factors involved.
Model A has some limitations. It is assumed that the two indexes are independent when they have some correlation in the considered time frame (R = 0,467). Both indexes were calculated from the same un-derlying temperature data, which may contribute to some of the corre-lation. By not involving another data source, we believe that the two indexes have the same information. It was essential for us to eliminate any differences in the data that could favour one index over another. In model A, we found it interesting to place the two indexes in “competi-tion” (measuring the strength of each one, together) and to analyze whether the two (or none) would stand out or just one of them. How-ever, its results can be compared or disregarded, considering individu-alised models B (including only GATO IV index) and C (including only EHF index).
Not including the minimum temperature can also be a limitation. For the Portuguese reality, there is quite limited evidence that minimum
temperature is of added importance to predict heatwaves. Minimum and maximum temperatures in Lisbon are highly correlated. GATO IV only considers a usual summer threshold for maximum temperatures. While this seems to be well adapted to the registered heatwaves in Lisbon, and apparently also with what is observed in the EHF for Lisbon, it is not guaranteed that it will replicate identically elsewhere.
Future studies should focus on the ability to generalize the results presented here with the variable GATO IV for other locations and pop-ulations to confirm the results obtained and check whether the results have the same acuity level in other locations. Another issue to be investigated is to assess whether the overdispersion in model C may be due to the EHF time smoothing. It is an interesting perspective that needs further study.
5. Conclusion
This work had as key motivation the comparison, in an urban area, between two metrics - EHF and GATO IV - to know which has higher predictive power to prevent health risks related to heat: on the one hand, a new way of defining heatwaves that have generated high consensus worldwide; on the other hand, the opportunity to improve, if necessary, the existing Lisbon heatwaves surveillance system and contribute to increased knowledge about heatwaves and their mortality associated.
In terms of the model for heatwaves occurrence forecasting, it is intended that the respective impacts are detected. Our analysis showed that during a period of almost 40 years (1980–2016), the daily data series for total mortality did not show substantial differences between indexes. Both were individually statistically significant, although the EHF index presented a lower predictive capacity.
However, for daily mortality in individuals with 65 years or older and with all diseases of the circulatory and respiratory system, in model A, GATO IV was the only statistically significant index capable of pre-dicting the impact of heatwaves on mortality. Thus, the GATO IV metric seems to have the best statistical properties, thus, better able to correctly forecast heatwaves with impacts on mortality. Nevertheless, despite the design differences, EHF also stands out as a good indicator to predict heat-related mortality in Lisbon.
Funding
This work was supported by the Fundaç˜ao para a Ciˆencia e Tecno-logia (FCT), Portugal; and Qart - Soluç˜oes de Monitorizaç˜ao e Mapea-mento Urbano Ambiental, Lda. [PhD research grant number PDE/BDE/ 120452/2016].
Author declaration
Liliane Morais: worked on all parts of the article, from the concep-tualization of the article to the methodology to be implemented, vali-dation, analysis, and writing. Paulo Nogueira: worked on all parts of the article, from the conceptualization of the article to the methodology to be implemented, validation, analysis, and writing. Ant´onio Lopes: participated in the supervision of the article
Declaration of competing interest
The authors declare that they have no known competing financial interests or personal relationships that could have appeared to influence the work reported in this paper.
Appendix A. Supplementary data
Supplementary data to this article can be found online at https://doi. org/10.1016/j.wace.2020.100287.
References
Barcena-Martin, E., Molina, J., Ruiz-Sinoga, J., 2018. Issues and challenges in defining a heat wave: a Mediterranean case study. Int. J. Climatol. 39 (1), 331–342. https:// doi.org/10.1002/joc.5809.
Breitner, S., et al., 2014. ‘Short-term Effects of Air Temperature on Cause-specific Cardiovascular Mortality in Bavaria , Germany’, Cardiac Risk Factors and Prevention, pp. 1272–1280. https://doi.org/10.1136/heartjnl-2014-305578.
Burkart, K., et al., 2013. Interactive Short-Term Effects of Equivalent Temperature and Air Pollution on Human Mortality in Berlin and Lisbon. Environmental Pollution. Elsevier Ltd. https://doi.org/10.1016/j.envpol.2013.06.002.
Byard, R.W., et al., 2013. Using the Excess Heat Factor (EHF) to predict the risk of heat related deaths. Journal of Forensic and Legal Medicine. Elsevier Ltd 20 (5), 408–411.
https://doi.org/10.1016/j.jflm.2012.12.005.
Calado, R., et al., 2004. A onda de calor de Agosto de 2003 e os seus efeitos sobre a mortalidade da populaç˜ao portuguesa. Revista Portuguesa de Saúde Pública, pp. 7–20.
Campbell, S., et al., 2018. ‘Heatwave and health impact research: a global review’. Health
and Place. Elsevier Ltd 53 (September), 210–218. https://doi.org/10.1016/j. healthplace.2018.08.017.
Costello, A., et al., 2009. Managing the health effects of climate change. Lancet and university college london institute for global health commission’. Lancet 373 (9676), 1693–1733. https://doi.org/10.1016/S0140-6736(09)60935-1.
Creagh, M., et al., 2018. ‘Heatwaves: Adapting to Climate Change - Ninth Report of Session 2017–19’. House of Commons Environmental Audit Committee (July). Dessai, S., 2003. Heat stress and mortality in Lisbon Part II. An assessment of the
potential impacts of climate change. Int. J. Biometeorol. 48 (1), 37–44. https://doi. org/10.1007/s00484-003-0180-4.
Direcç˜ao Geral Saúde, 2003. ‘Mortalidade em Portugal no Ver˜ao de 2003: influˆencia das ondas de calor’. In: Paper Presented at Meetings of the World Health Organization in Madrid (16-17 December 2003) and Bratislava (09-10 February 2004) Directorate- General for Health.
EEA, 2015. Viver Num Clima Em Mudança. European Environment Agency. https://doi. org/10.2800/070538.
EEA, 2017. Climate Change, Impacts and Vulnerability in Europe 2016: an Indicator- Based Report. European Environment Agency. https://doi.org/10.2800/534806. EEA, 2018. Unequal Exposure and Unequal Impacts: Social Vulnerability to Air Pollution,
Noise and Extreme Temperatures in Europe. European Environment Agency. https:// doi.org/10.2800/324183.
Fenner, D., et al., 2019. ‘Heat waves in Berlin and Potsdam, Germany – long-term trends and comparison of heat wave definitions from 1893 to 2017’. Int. J. Climatol. 39 (4), 2422–2437. https://doi.org/10.1002/joc.5962.
Filho, W.L., Icaza, L.E., Neht, Alice, Maris Klavins, E.A.M., 2017. Coping with the impacts of urban heat islands. A literature based study on understanding urban heat vulnerability and the need for resilience in cities in a global climate change context. Journal of Cleaner Production. Elsevier B.V 171, 1140–1149. https://doi.org/ 10.1016/j.jclepro.2017.10.086.
Fischer, E.M., Sch¨ar, C., 2010. ‘Consistent geographical patterns of changes in high- impact European heatwaves’, Nature Geoscience. Nature Publishing Group 3 (6), 398–403. https://doi.org/10.1038/ngeo866.
Garcia, A.C., Nogueira, P.J., Falcao, J.M., 1999. Onda de calor de Junho de 1981 em Portugal: efeitos na mortalidade. Revista Portuguesa de Saude Publica 1 (Volume Tem´atico), 67–77. RUN - RPSP - 1999 - vol tematico1a06 - p67-77.pdf, 1999. (Accessed 30 October 2020).
Gasparrini, A., Armstrong, B., Kenward, M.G., 2010. Distributed lag non-linear models. Stat. Med. 29 (21), 2224–2234. https://doi.org/10.1002/sim.3940.
Heo, S., Bell, M.L., 2018. Heat Waves in South Korea: Differences of Heat Wave Characteristics by Thermal Indices’, Journal of Exposure Science and Environmental Epidemiology. Springer US. https://doi.org/10.1038/s41370-018-0076-3. Heo, S., Bell, M.L., Lee, J.T., 2019. Comparison of health risks by heat wave definition:
applicability of wet-bulb globe temperature for heat wave criteria. Environmental Research. Elsevier Inc 168 (September 2018), 158–170. https://doi.org/10.1016/j. envres.2018.09.032.
Hosmer, D., Lemeshow, S., 2000. Chapter 5 - assessing the fit of the model. In: Applied Logistic Regression. John Wiley, New York, NY, pp. 160–164.
Huang, C., et al., 2011. ‘Review projecting future heat-related mortality under climate change scenarios’. Environ. Health Perspect. 119 (12), 1681–1690. https://doi.org/ 10.1289/ehp.1103456.
IPCC Intergovernmental Panel on Climate Change, 2007. In: Solomon, S., et al. (Eds.), Climate Change 2007: the Physical Science Basis: Summary for Policymakers and Technical Summary and Frequently Asked Questions; Part of the Working Group I Contribution to the Fourth Assessment Report of the Intergovernmental Panel on Climate Change, 8. Cambridge University Press, 2007, p. 142.
IPCC Intergovernmental Panel on Climate Change, 2018. Summary for policymakers. In: Global Warming of 1.5◦C. An IPCC Special Report on the Impacts of Global Warming
of 1.5◦C above Pre-industrial Levels and Related Global Greenhouse Gas Emission
Pathways, in the Context of Strengthening the Global Response to’, p. 32.
Joy, J.E., Penhoet, E.E., Petitti, D.B., 2005. Saving women’s lives - strategies for improving breast cancer detection and disgnosis, economic policy. Available at. http:
//www.ncbi.nlm.nih.gov/books/NBK22315/pdf/TOC.pdf.
Kendrovski, V., et al., 2017. Quantifying projected heat mortality impacts under 21st- Centurywarming conditions for selected European countries. Int. J. Environ. Res. Publ. Health 14 (7). https://doi.org/10.3390/ijerph14070729.
Kouis, P., et al., 2018. The effect of ambient air temperature on cardiovascular and respiratory mortality in Thessaloniki, Greece. Science of The Total Environment. Elsevier B.V. 647, 1351–1358. https://doi.org/10.1016/j.scitotenv.2018.08.106. Li, D., Bou-Zeid, E., 2013. Synergistic interactions between urban heat islands and heat
waves: the impact in cities is larger than the sum of its parts. Journal of Applied Meteorology and Climatology 52 (9), 2051–2064. https://doi.org/10.1175/JAMC- D-13-02.1.
Loridan, T., et al., 2016. The excess heat factor as a metric for heat-related fatalities: defining heatwave risk categories. Aust. J. Emerg. Manag. 31 (4), 31–37. Lowe, D., Ebi, K.L., Forsberg, B., 2011. Heatwave early warning systems and adaptation
advice to reduce human health consequences of heatwaves. Int. J. Environ. Res. Publ. Health 8 (12), 4623–4648. https://doi.org/10.3390/ijerph8124623. Meehl, G.A., Tebaldi, C., 2004. More intense, more frequent, and longer lasting heat
waves in the 21st century. Science 305 (5686), 994–997. https://doi.org/10.1126/ science.1098704.
Nairn, J., Ostendorf, B., Bi, P., 2018. Performance of excess heat factor severity as a global heatwave health impact index. Int. J. Environ. Res. Publ. Health 15 (11), 2494. https://doi.org/10.3390/ijerph15112494.
Nairn, J.R., Fawcett, R.J.B., 2015. The excess heat factor: a metric for heatwave intensity and its use in classifying heatwave severity. Int. J. Environ. Res. Publ. Health 12 (1), 227–253. https://doi.org/10.3390/ijerph120100227.
NCDC, 2018. NOAA’s national climatic data center. Available at. https://www.ncdc. noaa.gov/. Accessed: 12 December 2018.
Nogueira, P., 2011. Ondas de calor: modelos de mediç˜ao, previs˜ao e monitorizaç˜ao dos impactos na Saúde. Universidade Nova de Lisboa, Instituto de Higiene e Medicina Tropical. Available at. https://run.unl.pt/handle/10362/64936.
Nogueira, P., Paix˜ao, E., 2008. Models for mortality associated with heatwaves: update of the Portuguese heat health warning system. Int. J. Climatol. 28, 545–562. https:// doi.org/10.1002/joc.1546.
Nogueira, P., Paix˜ao, E., Morais, L., 2013. Distributions of air temperatures in Lisbon and Portugal (by districts): models for time and space to predict and monitoring heatwaves impacts on human mortality. Health by Numbers 1, 69–79. Available at.
https://www.dgs.pt/documentos-e-publicacoes/portugal-health-by-numbers-n -1-jpg.aspx.
Paix˜ao, E.D.J., Nogueira, P.J., 2003. Efeitos de uma onda de calor na mortalidade*, 21. Revista Portuguesa de Saúde Pública - Vigilˆancia epidemiol´ogica, pp. 41–54. Pereira, S.C., et al., 2017. Heat wave and cold spell changes in Iberia for a future climate
scenario. Int. J. Climatol. 37 (15), 5192–5205. https://doi.org/10.1002/joc.5158. P´eriard, J.D., Racinais, S., Sawka, M.N., 2015. Adaptations and mechanisms of human heat acclimation: applications for competitive athletes and sports. Scand. J. Med. Sci. Sports 25, 20–38. https://doi.org/10.1111/sms.12408.
Robine, J.M., et al., 2008. Death toll exceeded 70,000 in Europe during the summer of 2003. Comptes Rendus Biol. 331 (2), 171–178. https://doi.org/10.1016/j. crvi.2007.12.001.
Scalley, B.D., et al., 2015. Responding to heatwave intensity: excess Heat Factor is a superior predictor of health service utilisation and a trigger for heatwave plans. Aust. N. Z. J. Publ. Health 39 (6), 582–587. https://doi.org/10.1111/1753-6405.12421. UN, 2015. Transforming Our World: the 2030 Agenda for Sustainable Development.
United Nations Department of Economic and Social Affairs. https://doi.org/
10.1080/02513625.2015.1038080.
Watts, N., et al., 2018. The 2018 report of the Lancet Countdown on health and climate change: shaping the health of nations for centuries to come. Lancet 392 (10163), 2479–2514. https://doi.org/10.1016/S0140-6736(18)32594-7.
WHO, 2004. ‘Heat waves: risk and responses’, world health organization. Regional Office for Europe, p. 124, 2.
WHO, 2017. ‘Environment and health for European cities in the 21st century: making a difference’, WHO Regional Office for Europe. Available at. https://www.euro.who. int/en/health-topics/environment-and-health/urban-health/publications/2017/en vironment-and-health-for-european-cities-in-the-21st-century-making-a-difference- 2017, 89.
WHO, 2018. PUBLIC HEALTH AND CLIMATE CHANGE ADAPTATION POLICIES. THE EUROPEAN UNION - Final report’, p. 174.
WHO, 2019. Policy brief - health and climate action. https://doi.org/10.1007/0-387- 30749-4_83.
WMO, 2015. Heatwaves and Health: Guidance on Warning-System Development. WMO and WHO, 10.1109/ICEBE.2013.49 M4 - Citavi.
Zhang, K., et al., 2014. ‘What Weather Variables Are Important in Predicting Heat- Related Mortality? A New Application of Statistical Learning Methods’, 132. Environmental Research. Elsevier, pp. 350–359. https://doi.org/10.1016/j. envres.2014.04.004.