A Work Project presented as part of the requirements for the Award of a Master Degree in Management from the NOVA – School of Business and Economics.
HOW CAN HIGH-GROWTH BUSINESS OPPORTUNITIES FOR A
CUTTING-EDGE TECHNOLOGY BE DISCOVERED?
– Field Lab in Tech Entrepreneurship –
Eric Norbert Schiltz | 27421
A project carried out on the Master in Management Program under the supervision of: Professor Ilya Okhmatovskiy
Abstract
Discovering high-growth business opportunities for a cutting-edge technology is a complex process which requires well considered planning measures. Using a specific teaching methodology that integrates ‘technology push’ and ‘market pull’ commercial logics, the aim of the HiTech training Program is to achieve the latter with success. More precisely, its objective is to provide technology commercialization and entrepreneurship skills to participating teams. The following research reports and critically evaluates the logic and effectiveness of this Program together with its underlying algorithm, since I had the opportunity as a participant to directly collaborate as a member in one of the teams from March to July 2018.
Table of Contents
1. GENERAL OVERVIEW ... 1
1.1. INTRODUCTION ... 1
1.2. HITECH TRAINING PROGRAM ... 2
1.3. METHODOLOGY... 2
1.4. TEAM AND TECHNOLOGY ... 4
1.5. PROGRAM CONFIGURATION ... 6
2. LITERATURE REVIEW ... 7
3. DISCOVER STAGE ... 10
3.1. TECHNOLOGY CAPABILITIES ... 10
3.2. MARKET NEEDS ... 11
3.3. TECHNOLOGY-PRODUCT-MARKET AND VALUE PROPOSITION ... 12
3.4. PRODUCT STATEMENT AND COLD CALLING PREVIEW ... 14
3.5. PRELIMINARY MARKET ASSESSMENT ... 15
4. VALIDATE STAGE ... 16
4.1. IDEATION REVISION AND BUSINESS MODEL CANVAS - RIGHT SIDE ... 16
4.2. MARKET ASSESSMENT ... 18
4.3. FUNCTIONALS AND PRODUCT PRIORITIZATION ... 19
4.4. STRATEGIC ASSESSMENT... 20
5. CRITICAL EVALUATION ... 21
6. TURNING TECHNOLOGY INTO BUSINESS ... 25
7. REFERENCES ... 26
1. General Overview
1.1. Introduction
Technological discoveries through research are of fundamental importance for the economic growth of a country (Kirchberger & Pohl, 2016). However, to ensure that value is actually created, discoveries have to be transferred to the market with success (Adams, 1990). Consequently, new and emerging technologies need to be incorporated into products or services that sell. Creating financial value after bringing an idea to market may sound like a simple task, but successful commercialization is a time-consuming and complex procedure.
In fact, current literature on the topic identifies market- and funding-related issues as the major challenges of commercializing high technology, independently of the specific sector of activity (Al Natsheh, Gbadegeshin, Rimpiläinen, Imamovic-tokalic, & Zambrano, 2015). However, these challenges can be tackled through, inter alia, effective pre-planning activities and commercialization training of the team (Al Natsheh et al., 2015). This Work Project aims to explore the latter two measures in more detail by covering the following research question: How can high-growth business opportunities for a cutting-edge technology be discovered? In this Work Project an attempt was made to answer this important question by using a real project with a real technology as an example. More precisely, this Work Project will describe how a team, supported by HiTech, is taking its first steps on the technology transfer path. First, HiTech – a training Program that delivers entrepreneur and technology commercialization skills to participants – will be introduced. Then, the team together with its developed technology will be briefly presented. Third, an extensive literature review will be conducted to describe prior work on how to manage the front end of innovation. Next, the team’s effort to test the market relevance of its innovative ideas will be outlined. Finally, a
critical evaluation, making the connection between both literature and personal experiences, will be provided.
1.2. HiTech training Program
This Work Project is part of a Field Lab that is built around HiTech, a training Program that promotes the implementation of scientific discoveries and cutting-edge technology into strong growth business opportunities. Furthermore, HiTech allows multidisciplinary teams consisting of management students, researchers and business mentors to develop a well-founded business case after testing the market relevance of their ideas. The 2018 edition of HiTech in Lisbon includes six different teams, each assessing their own technology. This Work Project reports the experiences gathered by one of these teams.
The main objective of the HiTech Program is to provide a wide range of tools that help participating teams to develop a business case for a product or service concept that is based on the suggested technology, to either outperform competitors in that area, or to meet an unfulfilled need in the market. The main focus of the learning process lies on the work performed by the teams while developing their projects outside the formally structured in-class activities. As the projects are genuine, they are not only inherently complex, but also have an essential component of overall uncertainty. As a result, work generally lacks a clear structure and advancement is harder to evaluate than in more traditional educational environments.
1.3. Methodology
The underlying teaching methodology of the HiTech training Program is called Technology, Entrepreneurship, and Commercialization (TEC) Algorithm. Barr, Baker, Markham, and Kingon (2009) highlight that the algorithm is specifically designed to enclose sets of behaviour and skills that enable technology commercialization novices to perform as proficient entrepreneurs.
So far, TEC has been taught in different formats ranging from a series of nine brief modules to three full semesters (Barr et al., 2009). Initially developed in 1995 at a faculty of North Carolina State University (NCSU), the algorithm has been fine-tuned and adapted over time, through new experiences gained in classrooms around the world (Markham, Baumer, Aiman-Smith, Kingon, & Zapata, 2000). In this context, the HiTech team adjusted it to suit the particular environment in which the Program is applied. The description below refers to the methodology, aligned with the specific four-month format of the HiTech Program.
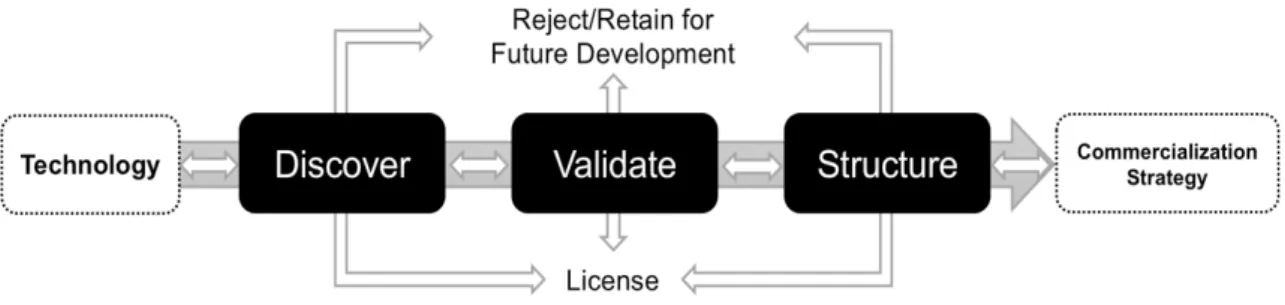
Figure 1 illustrates an overall summary of the different phases in the process. In the following sections each phase will be reviewed in more detail.
Figure 1. The TEC Algorithm, adjusted by HiTech. Source: Own analysis.
The process begins with the discover stage, which consists in creating multiple product concepts based on the proposed technology. In order to specify further product properties teams will have to find several market opportunities for each concept. This process is called Technology-Product-Market (T-P-M) linkages by the algorithm.
In the validate stage, teams will clarify, improve, and choose among the different product concepts. At an early stage of this phase, teams will try to identify ‘fatal flaws’ (market or technology) that will justify ‘discarding’ this (or these) T-P-M linkage(s). Throughout this
stage, participating teams will use various management tools (e.g. SWOT Analysis, and Industry Mapping) in order to better understand how the market works. These tools will allow themtofine-tunetheirproductconcepts,inordertochooseaproducttopassontothenext stage.
In the structure stage, teams will establish an extended version of previously prepared ‘value propositions’ for their product. In addition, the ultimate objective of this stage is to develop a business case, describing not only how the company will encompass the creation, delivery, and capture of value, but also including financial forecasts and strategic questions.
These three stages are followed by the development of a start-up/commercialization strategy (Barr et al., 2009). The latter, as well as the actual launch of the business, commonly take place after the end of the four-month training Program. However, some teams may decide not to continue with their projects.
The focus of this Work Project is on the first two stages, namely discover and validate. Hence, the objective is not to describe the development of a business case, but rather some of its preparatory work.
1.4. Team and Technology
For confidentiality reasons, neither the team nor their developed technology can be revealed in detail. What can be said is that the team consists of four scientists, namely three university teachers and a PhD student in Environment and Sustainability Studies. The latter four were either directly or indirectly involved in the development of the technology. My role as a management student is to support the team throughout the duration of the HiTech Program, by trying to bridge the cultural gap between science and business. Furthermore, the team is receiving the support of two mentors and several coordinators, all giving advice and feedback to the participants. When it comes to the technology, a brief description is given below:
Developed in the 1950s, electrodialysis can be defined as “a process that uses electrical current applied to permeable membranes to remove minerals from water” (Spellman, 2018). The scientific team I was allocated to reconstructed an electrodialytic reactor for aqueous environmental matrices1 treatment. This reconstruction avoids disadvantages of the classic
electrodialytic process and improves the quality of the final treated matrices. In other words, the reactor is capable of removing macro- and micro-elements from aqueous environmental matrices. The range of removable contaminants is wider than in a classical electrodialytic reactor. Thus, heavy metals, salts, pharmaceutical and personal care products can be removed to a large extent.
The energy consumption of the reactor measured in the laboratory seems to be promisingly low. In this context, it is important to mention that, the purer the water to be treated, the less time is needed to obtain the aimed result, and therefore the lower the costs. Thus, due to their comparatively lower levels of contaminants, wastewater treatment plant (WWTP) effluents (industrial or municipal) constitute good matrices to work with, compared to more polluted forms of wastewaters. Furthermore, WWTPs are largely available in many countries around the world.
The scientific team is participating in HiTech because it is concerned with several questions related to their proposed technology, such as: (i) does the discovery have market potential?; (ii) which market should be targeted?; (iii) what are the market needs?; (iv) how can management tools be used in a beneficial way?; or (v) what does a good commercialization strategy look like?
It can be inferred that the project is still at a very early stage of development. Thus, for instance, no decision has yet been taken whether to start up a new venture.
1 In chemistry, the term aqueous environmental matrices comprises drinking water, precipitation, groundwater, surface water, wastewater, leachates, as well as soil solutions and sediment pore water (Pawliszyn, 2002).
Furthermore, the current development of the team’s reactor can be categorised according to the “TRL 3: Technology validated in a laboratory environment” classification (see Appendix 1). The Technology Readiness Level (TRL) scale is commonly used to objectively evaluate the maturity level of a technology, beginning with a simple idea under development (TRL 0) and ending with a full commercial application (TRL 6). Finally, the technology is not yet protected by intellectual property rights. However, steps towards getting a patent have recently been initiated.
1.5. Program configuration
This year, the Program is organized into weekly sessions that take place from March 1 to July 3. Each session usually includes three consecutive parts. The first part is a training session in classic lecture format in which one of the HiTech coordinators explains a section of the TEC algorithm. The focus of these lectures lies on introducing deliverables, usually in the form of worksheets which the teams have to complete for the subsequent week. Next, usually two teams present the deliverables they prepared for the current session and receive a brief feedback from the HiTech coordinators. The second part is another lecture, often held by an invitee on his or her area of expertise, such as patents and landscape or legal and funding. Generally, these so-called seminars are not directly in line with the deliverables. Finally, the last hour of each session is reserved for the mentor meetings. Here, the team usually briefly discusses how to approach the upcoming worksheet(s) together with the mentors. Additionally, a larger focus of these meetings is put on general advice and feedback from the mentors.
When it came to the accomplishment of the deliverables, the team leader (PhD student) decided to complete the worksheets on her own first, before uploading them to a cloud storage service on the internet. The initial idea was that all the team members would give feedback to the ongoing deliverables by suggesting several modifications through the creation of virtual
notes inside the documents, once they were available online. Eventually, a final version would briefly be checked by the HiTech team. Unfortunately, the online feedback approach did not work out as planned, since most of the time the other three scientists were too busy with other works. As a result, I gave direct assistance and feedback to the team leader through Skype calls, starting from the fifth Program week. HiTech is designed to move the projects forward primarily through these deliverables. Consequently, the following sections of this Work Project will focus on the description of the completion of the latter, taking into account the particular circumstances in which this was organized by the team.
2. Literature Review
Technological innovation has long been considered a prerequisite for continuous economic growth, particularly for developed countries (Tahvanainen & Nikulainen, 2011). In this context, Texeira and Nogueira (2016) argue that being at the forefront of knowledge generation, researchers occupy a privileged position to discover new market opportunities with potential high economic return. However, technological expertise needs to be matched with skills to commercialize technology-based products and services. Hence, taking new ideas to market is most of the time not a seamless process (Markham, Ward, Aiman-Smith, & Kingon, 2010).
In an interesting set of arguments Pellikka, Kajanus, Heinonen and Eskelinen (2012) reason that the key difficulties of the high-technology commercialization process are related to the business environment, resources, marketing, as well as the planning and management side of the transfer process. However, these challenges can be overcome through quality pre-planning, efficient resources usage and commercialization training of the team (Al Natsheh et al., 2015).
In fact, many studies recognize the importance of effective pre-planning activities for the success of new product development (Evanschitzky, Eisend, Calantone, & Jiang, 2012). The front end of innovation (also known as “fuzzy front end”) refers to the very early stage of the new product development process that begins with a raw product idea or the discovery of an opportunity and ends once a decision is taken whether to go ahead with the project, so that a significant volume of resources can be made available to start the actual development (Eling & Herstatt, 2017).
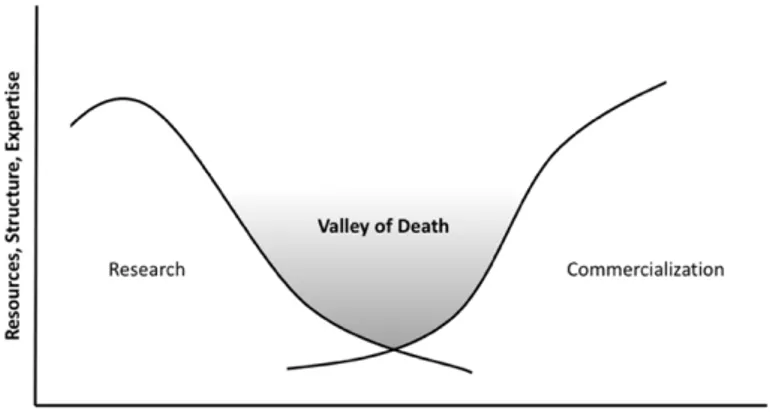
In their study, Markham et al. (2010) conceptualize the front end of innovation as the back end of basic technological research and hence define it as a “Valley of Death” (in terms of structure, resources and expertise availability) between basic technological research and the process of product development and commercialization (see Figure 2). Although this metaphor is commonly used for the new product development process of established companies, the fundamental idea remains the same for (future) entrepreneurs.
Figure 2. Valley of death. Source: Own analysis.
In another article Markham (2002) suggests that crossing the Valley of Death first requires discovering the commercial value of the research, then embodying the discovery into a product, and finally communicating its potential through a convincing business case. This three-step pattern follows the same logic as the previously described TEC algorithm. For
this reason, a brief description of each step is given below, serving as a theoretical base for the subsequent sections of this Work Project.
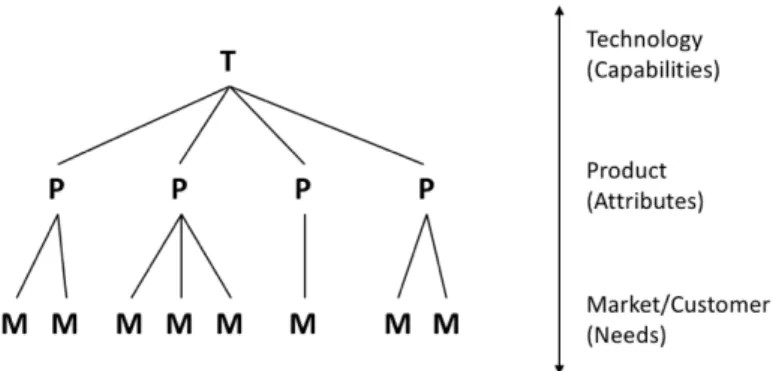
As a first measure to drive a project across the Valley of Death the article suggests identifying that a certain technology actually has potential commercial implications. Most technologies have multiple capabilities and, according to Markham, it is crucial to devise product ideas that use those capabilities in a sense that yields apparent product superiority. This would often entail to investigating various product and market combinations that use several technical capabilities, a combinatorial process visualized in Figure 3.
Figure 3. By defining clearly superior product attributes that match a lasting set of customer needs, technology is linked to market. Source: Own analysis.
The author stresses that each T-P-M linkage must be clearly articulated in an easily understandable way. Markham explains further that developing product concepts, underlying a specific technology, is only interesting when those products are linked to a large market need. For a given technology a few products as well as several market segments are usually identified, with each product concept representing a distinct value proposition for each segment.
As a next step, Markham suggests embodying the discovery into a product by expanding T-P-M connections. The scholar considers matching various product ideas with an applied process of market segmentation key for top level commercial application of the technical capabilities. More precisely, logical links between, on the one hand, technical capabilities and,
on the other hand, lasting customer needs should be established through product attributes, which combine technologies with markets.
As a third step, bridging the gap between the creation of technologies and their commercialization might be possible by communicating its potential through a convincing business case (Markham, 2002). Drawing up a business case forces the author to consider, among other things, company structure, legal and financial operations, marketing, and technology. The aim is to encourage others to see the value of the idea, in order to gain access to resources (e.g. investor funding), so that the actual project can begin.
3. Discover stage
As a reminder, the objective of the discover stage is to develop a variety of product concepts with stable Technology-Product-Market (T-P-M) linkages. This section provides an overview of the consecutive steps taken by the team to fulfil the latter, by means of the completion of weekly deliverables.
3.1. Technology capabilities
As explained in the literature review, the importance of the initial step of the algorithm lies in identifying all the capabilities of the technology. Accordingly, the very first deliverable of the Program consisted in identifying the latter.
In order to carry out this task, the team started to discuss the technology description. In doing so, several questions arose regarding possible applications of the technology as well as its advantages. Thinking about what the technology can enable a product to do proved to be easier than originally assumed. Thus, the team came up rather quickly with six capabilities (e.g. ‘flexibility on scaling’, and ‘no addition of reagents’) for their technology during the mentor meeting.
Describing the performance of competing technologies in order to support a comparison that will help to identify superior capabilities (i.e. where our technology has an advantage) was slightly more difficult. Working on electro-based technologies since the 1980s, the team was obviously aware of its potential direct competitors from a purely technical point of view. However, the identification of indirect competing technologies was very challenging, if not impossible at this juncture because solutions to market needs had not yet been addressed by the algorithm. Consequently, the identification of superior capabilities was based on a comparison with three competing technologies, all being at academic level. Each of the six above-mentioned capabilities was eventually assessed on their level of superiority and, if applicable, uniqueness. The level of uniqueness of the superior capabilities is related to how hard it is to replicate them. For instance, the ‘flexibility on scaling’ capability could not be identified as being superior because it was also applicable for all the other technologies. However, the ‘no addition of reagents’ capability turned out to be not only superior, but also the most unique one. Overall, three of the six capabilities were discovered as being superior.
3.2. Market needs
As a second step, the HiTech Program envisaged to focus on the customer side prior to addressing the product issue. This is because the TEC algorithm follows a market-oriented approach. In this sense, the team had to identify several applications by describing the overall problem situation that its concept intends to address. Already before the start of HiTech, the team had given long consideration to determine various problems that its technology is aiming to solve. As a result, the identification of these problems has been a straightforward task, briefly summarized in Table 1 and described in more detail in Appendix 2.
After this exercise, the task was to recognize market needs, which required decomposition of the overall problem into its multiple facets. In this respect, taking the third
application as an example, both farms and communities need treatment technologies that are able to disinfect and remove microorganisms, salts and micro-pollutants from their wastewaters, promoting safer reuse practices.
Table 1
General Problem Description
Application 1: Over the last decade, new classes of contaminants are being reported worldwide in water, soil
and biota. Similarly, the latter have been widely detected in municipal WWTP effluents, due to their incomplete removal rates (Matamoros, Arias, Brix, & Bayona, 2009). These facts demand new, efficient technologies for treatments in WWTPs, in particular in the so-called tertiary treatment stage.
Application 2: Most industrial plants have on-site facilities to treat the wastewater they produce as an
undesirable by-product, so that the pollutant concentrations comply with national regulations concerning disposal of the latter (Li, 2009). However, in this costly and complex process, many on-site wastewater treatment plants reach their limitsinremovingthecontaminantstoanadequateextentwithexisting technology.
Application 3: As a measure to cope with water scarcity, the reuse of treated wastewater is increasingly put
into practice worldwide. In particular for agricultural irrigation, it is encouraged by governments such as Namibia or Cape Town (Becerra-Castro et al., 2015). However, treated urban wastewater still contains low amounts of pollutants. Thus, this can have serious implications such as, for instance, the promotion of biological and chemical contaminants in the soil, entailing potential risks to the environmental and human health (Becerra-Castro et al., 2015).
Application 4: A significant amount of valuable fresh water is used for non-drinking purposes. For instance,
more than 800 billion litters of tap water are consumed in the production of concrete per year (Kanitha, Ramya, Revathi, & Bhuvanya, 2014). As treated wastewater effluents still contain low amounts of pollutants, they cannot be used in a concrete mix today, due to quality reasons. In the context of water scarcity, particularly dry regions need innovative technologies that enable safe reuse of wastewaters in this industry.
Source: Team own analysis.
In conclusion, it can be said that even though the team did not gain significant new insights during this exercise, it was still perceived as being beneficial, particularly for future use. In other words, by having the different applications concisely written down on paper, this deliverable enabled the team to have a clear overview of the market needs that its technology will be able to potentially meet.
3.3. Technology-Product-Market and value proposition
The deliverable of this session was designed to come up with Technology-Product-Market linkages, as explained in the literature review. Converting unique technical capabilities into product properties that meet customer needs presented quite a challenge for the team. This
was particularly the case for the Technology-Product linkage. The problem here was that the line between ‘technology’ and ‘product’ was very thin in our case. More precisely, the electrodialytic reactor that was constructed by the team in the lab, was already inherently a product concept in a certain way. This made the task of converting technical capabilities into product features very arduous. For instance,‘flexibilityonscaling’wasrecognized as being both a capability and a feature. Eventually, a customizable electrodialytic reactor appeared to be the best product idea. The Product-Market linkage on the other hand was much easier to establish. In other words, the question how the product’s features address customer problems/needs could in each case be answered by stating that the reactor is able to remove contaminants from wastewater to a sufficient extent. The final four T-P-M linkages are illustrated in Appendix 3.
From the latter, the team chose the linkage it estimated as the strongest to develop a first draft version of its value proposition. At this juncture, it believed that the construction material industry (e.g. concrete production) would present the most promising sector for its reactor. This choice was made based on a customer benefits assessment, in which the team evaluated, on a scale of 1 to 5, not only the strength, but also the confidence of each customer benefit, identified in the respective linkage.
When it came to the development of the value proposition using a standard HiTech format, two major challenges were faced, namely the intelligible pronunciation of both the customer need and the competing technologies. In a concrete mix, construction companies use water primarily from two sources, either clear groundwater extracted from boreholes, or more often normal tap water. For this reason, the main competitor of our technology was identified as being municipal water in this segment. As a result, a quantified statement of the customer problem was difficult to formulate for the value proposition. More precisely, in industrial practice water is often seen as a cheap and omnipresent consumable, rather than a scarce and
valuable resource. The team attached importance to keeping these issues in mind to refine its value proposition at a later stage in the Program.
3.4. Product statement and cold calling preview
The objective of this session’s deliverable was to come up with a product brochure by first describing both product features (i.e. solutions for problems) and product benefits (i.e. advantages through the customers’ eyes). Due to the good preparatory work done in the previous HiTech sessions, this task was completed without any significant problems. Much more interesting was the development of the product brochure itself. By gathering ideas from similar product brochures, the team ensured that all important and relevant information was included in the informative paper. The brochure design was made with an easy-to-use online tool in which the team could choose from pre-built templates. The final document (see Appendix 4) advertised a customizable design e-reactor, including several useful information, such as a mission and value statement, the presentation of the team and a contact number. A bit harder, but not impossible, was to formulate the different market applications in a concise and understandable way, given the limited space available.
In addition, this session introduced the importance of cold calling for primary information gathering. Besides providing guidelines, HiTech also offered a sheet on which the teams could take notes regarding the contact persons and the newly acquired knowledge from the conversations. As this kind of information gathering requires a considerable amount of time (i.e. some people are extremely difficult to reach), no substantial progress was achieved at that time. However, the team has planned to make further efforts in the course of the subsequent weeks. For instance, the contact sheet list included an important person of the Portuguese concrete association, as well as an engineer of a leading pharmaceutical contract development and manufacturing organisation.
3.5. Preliminary market assessment
The fifth week initiated the market research topic from a TEC perspective. This task is of great importance because investors only commit capital to new ventures they consider as credible. HiTech demanded participants to use a ‘top-down’ approach to identify both the respective market value and growth rate for one or more T-P-M linkage(s).
This task was fairly challenging for a variety of reasons. First of all, it was not easy to find useful numbers and rates to build a reasonable market model. Reports containing such crucial information usually cost several thousand euros. In this context, an extremely valuable tool was the Eurostat (i.e. statistical office of the European Union) website, which provides a high-quality statistical information service free of charge. However, this data was limited to the European Union and/or the euro area. In order to calculate the market value, the preliminary market assessment worksheet expected participants to multiply the number of sales with the product price. Unfortunately, at this point in time, the team could not come up with a final product price yet. This was, inter alia, due to the missing scale-up cost calculations of the laboratory reactor.
For instance, when it came to the application in which our technology could potentially replace the inefficient tertiary treatment stage in a municipal WWTP Eurostat provided data of WWTPs by treatment level for a total of 28 European countries in 2012. As a result, the team identified 15.360 municipal WWTPs which include a tertiary treatment stage, out of a total of 25.259 plants for these countries. However, as already mentioned, the final product price was still missing. For this reason, the team estimated the market value using a different approach. While collecting additional secondary information sources, the team came across useful data. According to one source, the global wastewater treatment services market will be worth about 79 billion euros by 2022. Furthermore, Statista, a market research company, stated that 31 per
cent of the global treatment plants are located in Europe. Out of the latter, only around 61 per cent involve a tertiary treatment stage. Finally, the team assumed from an only partially available market research bar chart that the tertiary treatment represents approximately 40 per cent of the overall treatment costs. Eventually, the total market for 28 European countries was estimated at almost six billion euros for the year 2022. In addition, another source provided the data for the compound annual growth rate of this industry. Finally, a similar approach was used for the estimation of the other T-P-M linkages.
To sum up, this difficult, but extremely important task was not yet considered as completed from one week to the next. On the contrary, the model together with its underlying numbers and rates would still be subject to further revision.
4. Validate stage
As a recall, the objective of the validate stage is to start with the emphasis on selection through two major measures, namely information and assumptions verification, as well as product ideas elimination based on fatal flaws. As in section 3 above, the following description will report the weekly steps taken by the team to make its project advance during this phase.
4.1. Ideation revision and business model canvas - right side
In addition to presenting a brief summary of the teams’ past achievements and future efforts, this first session of the validate stage introduced two deliverables, namely a product statement validation worksheet (i.e. an updated version of the value proposition), and the development of the right side of the business model canvas.
The aforementioned worksheet required teams to consider the matters of the customer and its problem, product features and benefits, as well as competing solutions once more. This time, the focus was on verifying each statement with not only secondary, but also primary
sources. In this regard, it was once again particularly challenging to have access to primary information. For example, the team contacted several national and international associations and companies by email, but never received an answer. Aware of the importance of cold calling, the team committed itself to be persistent in leaving its members’ comfort zone by increasing their efforts concerning this subject. Furthermore, some team members visited a pharmaceutical contract development and manufacturing organisation, in which one of the mentors has a leading position. The latter produces large amounts of wastewater as an undesirable by-product and is interested in sustainable solutions to substitute its current wastewater treatment process. In this context, useful primary information could be gathered. Moreover, the team arranged an appointment in a Portuguese municipal WWTP with the expectation of gaining further knowledge about the tertiary treatment stage inefficiency and the necessity to introduce new technologies.
When it comes to the right side of the business model canvas (i.e. front office), which includes all the external parts of a company, the completion was relatively simple. The topics of both customer segments and value proposition had previously been addressed. Here, the team had to formulate the existing information in a brief and concise manner. Regarding the channels, direct sales and face-to-face meetings were preferred because the future company would be business-to-business oriented, with large clients acquiring a well-engineered product. In this context, the team identified several customer relationships measures. For instance, as the current idea was to sell personalized reactors, its customer tailored design would represent a first one. Similarly, the sophisticated nature of the product would permit the team to offer consulting, training and troubleshooting services as an additional interaction with their customers. Finally, identifying all the latter points allowed the team to come up with the revenue streams quite easily, namely reactors sales as well as service and maintenance fees. Appendix 5 illustrates the final five business model building blocks.
4.2. Market assessment
The seventh session addressed the market assessment topic again. The idea was to segment the market further using a ‘bottom-up’ method on this occasion in order to come up with a so-called ‘served market’ section. The segmentation base (demographic, geographic, etc.) was supposed to be determined through information gathered from conversations with contacts. However, the completed worksheet dealing with this issue did not have the desired outcome for two main reasons.
The first issue was related to time and other organisational constraints. With the intention of gaining new information from the market, the team scheduled two meetings with industry experts. Busy with the latter, less time was available for the completion of the worksheet, which was eventually done in a rush.
As some of the figures were unclear to the HiTech coordinators, our team was chosen to present its final market assessment worksheet in the following week. It turned out, that the confusion was primarily related to the fact that the team indicated a single product (i.e. the above-mentioned customizable reactor) for all the different market needs in its T-P-M framework, on which the market model was built on. For this reason the team decided, together with the mentors, to change the technology-product linkage by introducing three different reactors as product concepts. The fundamental difference of the latter was defined by the size, and hence the volume (i.e. litres of wastewater), that each reactor could treat per day. During these discussions a new customer segment was furthermore identified. One mentor suggested that, in the context of eco-friendly home building, the installation of a small format of the reactor could treat some of the domestic wastewater for internal reuse purposes, such as, for instance, garden irrigation. Finally, after making a number of small changes, the computed market values made sense after all according to the mentors.
4.3. Functionals and Product prioritization
By this stage TEC had introduced two different assessment tools, with the aim of helping participants to advance their project.
In this context, the first deliverable required the team to make use of a five-level evaluation scale in order to give the answer to a number of analytical questions, classified into various functional categories (e.g. legal, marketing, operations). Giving a detailed description of this rather complex worksheet would go far beyond the objective of this Work Project. As a result, the description below refers to the strategy used and the complications faced by the team.
In order to ensure that the attributed rates in each question would make sense, the team leader and I decided to first individually fill in the worksheet before comparing the two versions with each other. Most of the times our results were the same or deviated only by one single scale point. If this was not the case, we tried to find a solution by discussing the logic behind our reasoning. However, some of the questions were perceived as either unclear or difficult to assess by both of us. In addition, we had the impression that this worksheet might be more useful for existing companies rather than for solely a team trying to test the market relevance of an early-stage technology. The main objective was to help the team to assess their current knowledge status. The results of the attributed numbers suggested that the team should collect more primary data in order to increase their level of confidence in several categories.
The objective of the second so-called product prioritization worksheet was to help the team to make an educated guess when choosing among its products and hence markets. The completion of this deliverable was only possible because the team decided to split its single product concept into three during the previous mentor session. Here evaluation scales were used again, but this time with the aim to measure the opportunity level of a variety of decision criteria
established by the team. The most important of these criteria included treatment performance, legislation, geography, and barriers to entry.
In order to come up with the respective rating numbers, the team continued to follow the same strategy as applied for the first deliverable described above. Once completed, the worksheet automatically computed a total score for each product concept, with the ultimate goal to select the most promising one. In our case, the final numbers for both the WWTP and the construction material segments derogated only marginally. Appendix 6 includes the final deliverable for a better understanding.
In order to make a choice, the team decided to gather more primary information. For this reason, I did several cold calls and it turned out that the WWTP segment was less attractive after all. One German technician told me, for instance, that their tertiary treatment stage already works efficiently. Hence, the team decided to move on with the product concept that is linked with the concrete production segment in dry regions such as the Middle East and Africa.
4.4. Strategic assessment
Before ending the validate stage with a mid-term presentation, HiTech introduced a strategic assessment worksheet, which included three different management tools, namely SWOT analysis, Industry Mapping and Porter’s Five Forces. As the team lately selected the product concept that is linked with the materials manufacturing industry (e.g. concrete production) to move onto the structure phase, the completion of this week’s deliverable only considered the latter segment relevant.
The usage of the above-mentioned management tools helped the team to give a clear structure to a complex reality. However, the fact that these tools are generally more suitable for established companies, seeking to remain competitive in a continuously evolving market, was a major challenge. In other words, the manner in which the tools are designed, made it more
difficult to enter information of merely a Technology Readiness Level 3 product concept. Nevertheless, the strategy used by the team to complete the worksheet was to put focus on not only the current, but also the future potential of both the team and the technology. In the SWOT analysis, for instance, the patentability of the technology was identified as a strength, whereas the market knowledge of the team was categorised as a weakness. When it came to the Industry Mapping tool, the team had to come up with a ‘market map’ that did not yet exist under the outlined form. The current idea was to increase the concrete quality in dry regions by mixing cement with WWTP effluents that would have previously been treated by the electrodialytic reactor. Since the supply chain included a number of suppliers, each had to be individually listed. A detailed description of the final exercise is comprised in Appendix 7.
To sum up, despite the challenges faced during this exercise, the strategic assessment worksheet helped to make the participants more aware of technology- and market-specific important findings. For instance, the team members were more conscious about their future potential position in the market supply chain after performing the Industry Mapping exercise.
5. Critical evaluation
The review of relevant literature on the TEC educational process, as well as the analysis of the personal experiences gained in the first ten weeks during one of its formats (i.e. the four-month module HiTech), allow me to make an assessment of the success of the algorithm in meeting its goals by means of a critical evaluation.
In this respect, a number of conclusions can be drawn, starting with the discover stage. First of all, as the TEC algorithm is following a market-oriented process, the deliverables consistently took into consideration how the developed technology could potentially address current market needs. This approach allowed the team members to change their perspective by
looking at the technology from the customer side, rather than solely from a scientific point of view. The very first deliverable of the Program constitutes a good example for this. In the context of analysing their technology, the scientists of the team tended to focus solely on measurable performance parameters (e.g. product specifications). Technological capabilities, on the other hand, are what such specifications enable a product to do. By forcing participants to identify capabilities, the algorithm helped them to recognize that customers primarily care about these capabilities. To sum up, such tasks successfully promoted team members to bridge the gap between science and business.
These deliverables gradually shifted the participants to the main objective of the discover stage: the development of a variety of product concepts with stable T-P-M linkages. Here, the team had considerable difficulties to ‘adjust’ its technology in order to match the standard format provided by the Program. As already pointed out in section 3.3, this was particularly true for the T-P linkage, since in our case there was no significant difference between, on the one hand, ‘technology’ and, on the other hand, ‘product’. This supports the idea that such a division makes more sense for technologies that are inherently easier to be implemented to multiple concepts. For instance, infrared sensor technology can be applied in various products, such as security systems, remote controls, mobile phones, and many others. The team’s electrodialytic reactor, however, only allows adaption in terms of wastewater treatment volume as well as contaminant removal type and efficiency. As these factors strongly depend on the specific customer needs, the team came up with the idea to define a single product concept, namely a customizable electrodialytic reactor, rather than many different reactors, which would take into consideration the various possible combinations of the latter adaptions. As a result, one can conclude that the specific frame of the algorithm does not completely suit every technology. Particularly the technology-product linkage seems to fit certain technological discoveries better than others.
Once established, most of the subsequent deliverables were built upon this important T-P-M framework. For this reason it could be argued that the algorithm should be more flexible, by taking into consideration that certain technologies already constitute a product concept by nature. In this respect, I would suggest that TEC should provide an alternative solution to teams facing such a situation. Merging the first two elements of the framework together could be a possible way of addressing the issue. In this logic, the validate phase would expand on linkages between, on the one hand, a single technological product and, on the other hand, several market needs, as opposed to the T-P-M. Since this was not the case, the team had to reconsider the definition of its previously determined product concept by splitting it into three, by the middle of the validate phase. This tedious measure was necessary, because some of the worksheets in this second phase were designed to evaluate the latter in order to direct the team throughout the so-called product concept selection process.
Alongside the above-mentioned issue, another major challenge was related to time constraints and the intensity of some deliverables. Each week, the Program introduced at least one new worksheet to complete, which, after being filled in, was often times left behind. As all of the steps taken by the team had to be precisely recorded in writing, less time was available to make more findings. For example, although cold calls were crucial in the validate phase, the team was sometimes too busy with reporting its findings. According to the principle that less is sometimes more, I would suggest that the Program should reduce or even do away with a few deliverables. In this context, it is very important to note that time pressure arose many times due to team-internal matters. The other team members left the majority of the work associated with the completion of the deliverables to the PhD student and me. As a result, we lacked their expertise and assistance, which would have been important for the quality of some findings. It should be noted, that these complications are not directly related to the algorithm per se.
Despite such complications, the completion of most of the tasks in the validate stage were perceived as useful by the team. Here, the fact that the Program consistently forced participants to directly contact decision makers, industry experts, or even potential customers and users, helped the team to gain a better understanding of the way the market works. One of the findings was, for instance, that most of the pharmaceutical companies are seeking for more efficient and sustainable solutions for the treatment of the wastewater they produce as a by-product. Part of the reason for this is related to the fact that government policies and regulations dealing with this subject might become stricter in the near future. Another important insight was, for example, that construction companies in Angola are facing serious problems with their water supply. For several reasons (e.g. drought) the quality of the latter is never guaranteed and, therefore, logically, neither is the condition of the final concrete mix.
Moreover, the usage of a set of management tools helped the team members to not only increase their market knowledge, but also to identify strengths and weaknesses of their technology. Logically, some tools were easier to use and more suitable to our team’s needs than others. In particular, the Industry Mapping was rather complicated to come up with when it came to the construction material sector’s water supply.
Another important insight was the realization of the team, after a long period of hesitation, that the initially prioritized market would indeed be the most suitable one for their technology. More precisely, the team members found supporting evidence, in line with the advancement of the process, that their reactor would best fit with the construction material sector because the market need is highest here.
To sum up, it can be said that the overall impression gained during the first ten weeks of the Program was positive. Both the discover and validate phase delivered what they had promised. More specifically, the TEC algorithm provided a possible way to discover
high-growth business opportunities for a cutting-edge technology for future potential exploit. Several of the aforementioned difficulties faced by the team support the idea that the process could still be subject to improvement. As the fundamental learning mode is ‘learning-by-doing’, progression depends strongly on the input and motivation of the respective teams and their members. Furthermore, the upcoming structure phase includes a variety of exercises, gradually shifting participants to the development of a business case.
6. Turning Technology into business
As already implied in the previous section, entrepreneurship support programs (e.g. business incubators), which aim to accelerate the creation and development of start-up companies, constitute only one of several options available for the transfer of technology.
First of all, the most obvious alternative to HiTech would have been to perform the entrepreneurial learning-by-doing exercise without any external assistance. On the one hand, this would mean that important benefits such as mentoring or network expansion, would no longer exist. On the other hand, working with a third party requires a considerable amount of time that could be spent directly on the project. Furthermore, another alternative constitutes co-working spaces, which offer more flexibility and freedom than conventional business incubators or similar training programs. Finally, the creation and capture of value can also be achieved by means of a partnership (e.g. joint-venture) with an established company. In this context, the literature on open innovation describes that companies should explore ways and ideas to gain additional market share not only within their own boundaries, but also in their surrounding environment (Sikora, Niemiec, Szeląg-Sikora, & Gródek-Szostak, 2017).
In order to answer the research question, it can be said that there are multiple possibilitiestodiscoverbusinessopportunitiesforatechnology.Asthereisnoultimate solution, teams should carefully weigh the advantages and disadvantages of all the available options.
7. References
Adams, J. D. (1990). Fundamental Stocks of Knowledge and Productivity Growth. American Journal Sociology, 96(2), 265–299.
Al Natsheh, A., Gbadegeshin, S. A., Rimpiläinen, A., Imamovic-tokalic, I., & Zambrano, A. (2015). Identifying the Challenges in Commercializing High Technology: A Case Study of Quantum Key Distribution Technology. Technology Innovation Management Review, 5(1), 26–36.
Barr, S., Baker, T., Markham, S., & Kingon, A. (2009). Bridging the valley of death: Lessons learned from 14 years of commercialization of technology education. Academy of Management Learning and Education, 8(3), 370–388.
https://doi.org/10.5465/AMLE.2009.44287937
Becerra-Castro, C., Lopes, A. R., Vaz-Moreira, I., Silva, E. F., Manaia, C. M., & Nunes, O. C. (2015). Wastewater reuse in irrigation: A microbiological perspective on implications in soil fertility and human and environmental health. Environment International.
https://doi.org/10.1016/j.envint.2014.11.001
Eling, K., & Herstatt, C. (2017). Managing the Front End of Innovation—Less Fuzzy, Yet Still Not Fully Understood. Journal of Product Innovation Management, 34(6), 864– 874. https://doi.org/10.1111/jpim.12415
Evanschitzky, H., Eisend, M., Calantone, R. J., & Jiang, Y. (2012). Success factors of product innovation: An updated meta-analysis. Journal of Product Innovation Management, 29, 21–37. https://doi.org/10.1111/j.1540-5885.2012.00964.x
Kanitha, M., Ramya, P., Revathi, V., & Bhuvanya, S. (2014). Potential utilisation of
untreated/treated textile effluent in concrete. IJRET: International Journal of Research in Engineering and Technology, 3(7), 5.
Kirchberger, M. A., & Pohl, L. (2016). Technology commercialization: a literature review of success factors and antecedents across different contexts. Journal of Technology
Transfer, 41(5), 1077–1112. https://doi.org/10.1007/s10961-016-9486-3
Li, K. (2009). Proceedings of the 2009 International Conference on Chemical, Biological and Environmental Engineering. World Scientific Publishing Co. Pte. Ltd.
Markham, S. K. (2002). Moving technologies from lab to market. Research-Technology Management, 45(6), 31–42. https://doi.org/10.1080/08956308.2002.11671531
Markham, S. K., Ward, S. J., Aiman-Smith, L., & Kingon, A. I. (2010). The valley of death as context for role theory in product innovation. Journal of Product Innovation
Markham, Baumer, Aiman-Smith, Kingon, & Zapata. (2000). An algorithm for high
technology engineering and management education. Journal of Engineering Education, 89(2), 209–218+247+251+254. Retrieved from
https://www.scopus.com/inward/record.uri?eid=2-s2.0-19544374283&partnerID=40&md5=2783de3d3d7cfce1af39981ede8b192f
Matamoros, V., Arias, C., Brix, H., & Bayona, J. M. (2009). Preliminary screening of small-scale domestic wastewater treatment systems for removal of pharmaceutical and personal care products. Water Research, 43(1), 55–62.
https://doi.org/10.1016/j.watres.2008.10.005
Pawliszyn, J. (2002). Sampling and Sample Preparation in Field and Laboratory (1 edition). Wilson & Wilson’s Comprehensiv.
Pellikka, J., Kajanus, M., Heinonen, M., & Eskelinen, T. (2012). Overcoming challenges in commercialization process of the product innovation. Proceedings of ISPIM
Conferences, (23), 1. Retrieved from
http://search.ebscohost.com/login.aspx?direct=true&db=edb&AN=78562732&site=eds-live
Sikora, J., Niemiec, M., Szeląg-Sikora, A., & Gródek-Szostak, Z. (2017). CONCEPTS OF INNOVATION IN TECHNOLOGY TRANSFER ON THE EXAMPLE OF SELECTED COUNTRIES. KONCEPCJE INNOWACJI W ZAKRESIE TRANSFERU TECHNOLOGII NA PRZYKŁADZIE WYBRANYCH KRAJÓW., 16(1), 83–92. Retrieved from
http://10.0.88.102/ASPE.2017.16.1.09
Spellman, F. (2018). Environmental Engineering Dictionary (Fifth Edit). Rowman & Littlefield.
Tahvanainen, A.-J., & Nikulainen, T. (2011). Commercialization at Finnish Universities - Researchers’ Perspectives on the Motives and Challenges of Turning Science into Business. Science. Retrieved from http://ideas.repec.org/p/rif/dpaper/1234.html
Texeira, A., & Nogueira, J. (2016). Academic entrepreneurship in life sciences: the case of a moderate innovator country. Journal of Developmental Entrepreneurship, 21(1), 21. https://doi.org/10.1142/S1084946716500047
8. Appendices
Table of Contents
APPENDIX 1: TECHNOLOGY READINESS LEVEL METHODOLOGY ... 30
APPENDIX 2: GENERAL PROBLEM DESCRIPTION ... 31
APPENDIX 3: TECHNOLOGY-PRODUCT-MARKET LINKAGES ... 33
APPENDIX 4: PRODUCT BROCHURE ... 34
APPENDIX 5: BUSINESS MODEL CANVAS - RIGHT SIDE ... 36
APPENDIX 6: PRODUCT PRIORITIZATION WORKSHEET ... 37
APPENDIX 7: STRATEGIC ASSESSMENT ... 38
Appendix 1: Technology Readiness Level Methodology
Stan Sadin developed the Technology Readiness Level (TRL) methodology at NASA Headquarters in 1974. The main objective of employing TRL is to support management regarding the technology development in decision making. It is one of a number of tools that helps to manage the advancement of research and development activities within an entity. U.S. Government, ESA, NASA, and other institutions used it for their proposed technological development programs’ technology readiness assessment.
TRLs work as a scale with multiple levels that increase with the degree of technological development. The aim is to choose the TRL level, that indicates the most advanced stage of development the technology has at the moment of assessment. HiTech has developed its own version of this methodological scale, which is presented below.
Classification Description
TRL 0 Just an idea under development
TRL 1 An idea supported by minimal scientific development
TRL 2 An idea supported on well developed science
TRL 3 Technology validated in a laboratory environment
TRL 4 Technology validated with field tests
TRL 5 Technology with a complete proof-of-concept (e.g., prototype or in-vivo testing)
TRL 6 Technology scaled-up to semi-industrial production
Appendix 2: General Problem Description
Describe the overall problem situation that your concept intends to address
A ppl ic at ion 1: W W T P te rt ia ry tr ea tm
ent Wastewater treatment plants (WWTPs) generally involve tree stages of treatment called primary, secondary and tertiary treatment. In simple terms, primary treatment implicates
sedimentation of solid forms of waste within the wastewater, while secondary treatment involves removal of suspended and dissolved biological matter (Halageri, 2012). In addition, tertiary treatment is sometimes defined as “anything more than primary and secondary treatment” (Halageri, 2012).
Over the last decade, beyond the legacy contaminants (e.g. "priority" pollutants and industrial intermediates that display persistence in the environment), new classes of environmental emerging organic contaminants (EOCs) are being detected and reported worldwide in water, soil and biota (Arpin-Pont, Martínez-Bueno, Gomez, & Fenet, 2016). Among them are Pharmaceuticals and Personal Care Products (PPCPs), a group that includes numerous chemical classes. Consequently PPCPs have been widely detected in WWTP effluents, due to their incomplete removal rates (Matamoros, Arias, Brix, & Bayona, 2009).
These facts demand new, efficient technologies for treatments in WWTPs. Our electrodialytic technology has the capability to “sterilize” the wastewater (electric current), electrodegrade micro-pollutants and, remove organic matter, salts and heavy metals, hence being a possible alternative to the tertiary treatment (nowadays mostly involving chloride or UV light) in a WWTP. A ppl ic at ion 2: I ndus tr ia l w as te w at
er The majority of industries produce some wastewater as an undesirable by-product. Most industrial plants have on-site facilities to treat these wastewaters, so that the pollutant concentrations comply with national and/or local regulations concerning disposal of wastewaters into rivers, lakes, oceans, or the community treatment plants (Li, 2009). The different contamination types of industrial wastewater require a range of strategies to remove the pollution. However, these processes are generally complex and consequently associated with high costs. In addition, many on-site wastewater treatment plants reach their limits in removing the contaminants to an adequate extent with existing technology (WEDECO, 2009).
Our electrodialytic technology has the capability to “sterilize” wastewater (electric current), electrodegrade micro-pollutants and, remove organic matter, salts and heavy metals, hence being either a possible alternative or complement to existing solutions.
Appendix 2: General Problem Description (continued)
Describe the overall problem situation that your concept intends to address
A pp li ca ti on 3: A gr ic ul tur al ir ri ga
tion As a measure to tackle part of the water scarcity problem, treated wastewater reuse, particularly for agricultural irrigation, is increasingly put into practice, encouraged by governments such as Namibia or Cape Town (Becerra-Castro et al., 2015). However, this can have serious implications such as, for instance, the promotion of biological and chemical contaminants in the soil, entailing potential risks to the environmental and human health (Becerra-Castro et al., 2015).
In fact, treated urban wastewater still contains low amounts of pollutants, such as microorganisms or toxic chemicals (e.g., trace metals), as well as inorganic substances such as, inter alia, chlorine, sodium, boron, or potassium (Becerra-Castro et al., 2015).
In this context, particular attention was paid to the capability of alternative wastewater treatment technologies to address the arising challenges, such as the sustainable reuse of wastewater for irrigation or the removal of persistent contaminants (Rizzo et al., 2013). In particular disinfectants and pesticides, as well as pharmaceutical products are anticipatory in the majority of the debates on wastewater quality (Rizzo et al., 2013).
Our technology can remove these compounds, promoting safer treated wastewater reuse practices. More precisely, it has the capability to “sterilize” the wastewater (electric current),electrodegrademicro-pollutants,andremoveorganicmatter,saltsandheavy metals.
A ppl ic at ion 4: C on st ruc ti on indus tr
y Water scarcity is the shortage of fresh water resources to encounter demand. Every continent is affected and it was classified by the World Economic Forum (2015) as the highest global risk regarding potential effects for the next ten years. Both the European Economic Area (2002) and the United Nations Environment Programme (2012) call for action to increase water-use efficiency in all sectors. In this context, it is important to mention that in Europe, on average, 40% of total water withdrawal is used for energy production and industry (European Environment Agency, 2007). Thus, a significant amount of valuable fresh water is used for non-drinking purposes.
One of the main water consuming industries is construction (Kanitha, Ramya, Revathi, & Bhuvanya, 2014). The two most consumed materials in the world are concrete, after water (World Business Council for Sustainable Development, 2012). In a concrete mix, the water-cement ratio is around 0,45 to 0,60 (Somayaji, 2000). In other words, more than 800 billion litres of fresh water are used in the production of concrete per year (Kanitha et al., 2014). Today, fresh water is the only type of water that fulfils the industry standard (BS EN 1008:2002). In fact, if wastewater was used, the quality of the concrete would be lower. Our electrodialytic technology reduces contaminants from wastewater treatment effluent (or similar aqueous matrices) to a level reaching final characteristics similar to tap water. Although not drinkable, the latter meets the above-mentioned industry standard. In fact, the quality of the concrete is similar, or even better comparing with the reference material (as the final resource is a product with less salt contents than tap water).
Thus, the technology would contribute to wastewater reuse in the concrete production industry, leading this sector to a circular economy, while tackling part of the water scarcity problem.
Source: HiTech Program 2018; Team own analysis.
Appendix 3: Technology-Product-Market linkages
The team linked their technology with a single product concept, a customizable electrodialytic reactor, which is able to potentially meet four different market needs. In the validate phase, the four linkages will be first assessed and then prioritized, with the ultimate goal to choose the most promising one from a business point of view.
Appendix 4: Product brochure
Appendix 5: Business model canvas - right side
The above figure illustrates the right side of the business model canvas (i.e. front office), including the external five building blocks of the future company. In the structure phase, teams will have to make use of it once again, completing the missing 4 elements (i.e. back office).
Appendix 6: Product prioritization worksheet
In the decision matrix of the product prioritization worksheet, the columns include the three different product concepts. With a treatment volume of 400-600m3 per day, the first
reactor represents the largest one. It would be used for the WWTP (municipal and industrial) customer segment. The second product concept is of medium-size (60-400 m3 per day), and its
possible purpose is to treat wastewater treatment effluent, enabling its reuse for the construction of concrete. The last concept would be the one that could potentially be installed in eco-friendly homes. The rows of the document, on the other hand, include all the assessment criteria identified by the team. The rating scale includes numbers from 1 to 10, with the higher number representing the greater opportunity. Note, that the total of the first two product concepts only deviate by 0.2 (difference between 5.6 and 5.4) assessment points, or more precisely by around 3 per cent.
Appendix 7: Strategic assessment SWOT Analysis
Industry Mapping
Most of the identified companies are operating in dry regions such as parts of Africa and Asia. Ready-mix concrete production companies supply construction material companies with concrete. The idea is that WWTPs would supply these companies with their effluent by means of trucks. Such trucks already exist today in these regions to supply both households and companies with water. The idea is to sell the reactor to the ready-mix concrete production companies.
Source: HiTech Program 2018; Team own analysis.
Appendix 7: Strategic assessment (continued) Porter’s Five Forces
References
Arpin-Pont, L., Martínez-Bueno, M. J., Gomez, E., & Fenet, H. (2016). Occurrence of PPCPs in the marine environment: a review. Environmental Science and Pollution Research, 23(6), 4978–4991. https://doi.org/10.1007/s11356-014-3617-x
Becerra-Castro, C., Lopes, A. R., Vaz-Moreira, I., Silva, E. F., Manaia, C. M., & Nunes, O. C. (2015). Wastewater reuse in irrigation: A microbiological perspective on implications in soil fertility and human and environmental health. Environment International.
https://doi.org/10.1016/j.envint.2014.11.001
European Environment Agency. (2007). Water use by sectors. Retrieved from https://www.eea.europa.eu/themes/water/water-resources/water-use-by-sectors
Halageri, N. (2012). Odor Monitoring at Wastewater Treatment Plants. University of New Orleans.
Kanitha, M., Ramya, P., Revathi, V., & Bhuvanya, S. (2014). Potential utilisation of
untreated/treated textile effluent in concrete. IJRET: International Journal of Research in Engineering and Technology, 3(7), 5.
Li, K. (2009). Proceedings of the 2009 International Conference on Chemical, Biological and Environmental Engineering. World Scientific Publishing Co. Pte. Ltd.
Matamoros, V., Arias, C., Brix, H., & Bayona, J. M. (2009). Preliminary screening of small-scale domestic wastewater treatment systems for removal of pharmaceutical and personal care products. Water Research, 43(1), 55–62.
https://doi.org/10.1016/j.watres.2008.10.005
Rizzo, L., Manaia, C., Merlin, C., Schwartz, T., Dagot, C., Ploy, M. C., … Fatta-Kassinos, D. (2013). Urban wastewater treatment plants as hotspots for antibiotic resistant bacteria and genes spread into the environment: A review. Science of the Total Environment. https://doi.org/10.1016/j.scitotenv.2013.01.032
Somayaji, S. (2000). Civil Engineering Materials (2 edition). Pearson.
Unep. (2012). GEO5 Global Environment Outlook- Environment for the future we want. Population and Development Review, 24, 407. https://doi.org/10.2307/2807995 WEDECO. (2009). No Title. Retrieved from
https://www.environmental-expert.com/news/micro-pollutants-in-water-circulation-59703
WHO Regional Office for Europe. (2002). Water and health in Europe. A joint report from the European Environment Agency and the WHO Regional Office for Europe. WHO Regional Publications. European Series, 7(93), III–XXIII, 1-222. Retrieved from http://www.ncbi.nlm.nih.gov/pubmed/12353489
World Business Council for Sustainable Development. (2012). The Cement Sustainability Initiative. Agenda for Action, (June). https://doi.org/10.1680/ensu.2004.157.1.9 World Economic Forum. (2015). Global Risks 2015 - Reports - World Economic Forum.