University of Algarve
ANALYSIS OF THE TRANSCRIPTIONAL REGULATORY NETWORK
UNDERLYING HEART DEVELOPMENT
Rui Sotero Rodrigues Machado
Dissertation to obtain
Master Degree in Biomedical Sciences
Work performed under the supervision of: PhD Matthias E. Futschik
University of Algarve
ANALYSIS OF THE TRANSCRIPTIONAL REGULATORY NETWORK
UNDERLYING HEART DEVELOPMENT
Rui Sotero Rodrigues Machado
Dissertation to obtain
Master Degree in Biomedical Sciences
Work performed under the supervision of: PhD Matthias E. Futschik
Declaro ser o autor deste trabalho, que é original e inédito. Autores e trabalhos consultados estão devidamente citados
no texto e constam da listagem de referências incluída.
Copyright©.
A Universidade do Algarve tem o direito, perpétuo e sem limites geográficos, de arquivar e publicitar este trabalho através de exemplares impressos reproduzidos em papel ou de forma digital, ou por qualquer outro meio conhecido ou que venha a ser inventado, de o divulgar através de repositórios científicos e de admitir a sua cópia e distribuição com objetivos educacionais ou de investigação, não comerciais, desde que seja dado crédito ao
First of all, I want to acknowledge my supervisors, PhD Matthias E. Futschik and PhD José Bragança. Without them, taking this step to finish the Master’s degree, and specially finish a very complex theme for the master thesis as heart development, would not be possible. I appreciate all the support given regarding the review of the bioinformatic and molecular biology by PhD Matthias Futschik and the molecular biology and gene functionality insight by PhD José Bragança. Finally a special thanks to PhD Matthias Futschik for spending a great amount of time teaching me, from scratch, all the bioinformatic tools I used.
I also want to acknowledge the Sysbiolab team (greatest team ever), for all the help during the master thesis. Especially to Miguel for helping me with some things in R, heatmaps and clusters and to Ravi that was of great help with UniHI. I also want to thanks Dulce, a former member of Sysbiolab, for all the afternoons discussing the better way to analyse/interpret the obtained results.
Quero também agradecer à minha familia por todo o apoio, mas quero agradecer em especial aos meus pais por todo o apoio e incentivo para continuar a estudar e a trabalhar naquilo que gosto. Todo o seu carinho e sustento foi tremendo, pois neste momento de crise, apoiaram-me psicológica e monetariamente quando mais precisei para acabar mais uma etapa da minha vida! Fico, por isso, eternamente grato. Agradeço ainda ao puto, meu irmão, pelos momentos de relax durante esta fase atarefada da minha vida.
Por fim, mas não menos importante, quero agradecer à Patrícia que esteve sempre ao meu lado todos estes meses em que estive empenhado na tese, apoiando-me nos bons e maus momentos, altos e baixos que esta montanha-russa, chamada tese de mestrado, proporcionou.
Todas estas peças juntas formam o colossal puzzle que é a experiência de passar pelo mestrado e terminar a tese de mestrado. / All these pieces came together to create this colossal puzzle that is the experience of going through the master and the master’s thesis.
ABST RA CT
Analysis of the transcriptional regulatory network underlying heart development
Heart development is a highly complex process with a series of precisely spatially and temporally ordered events on molecular level. To understand how these events are controlled and coordinated, it is necessary to study the underlying gene expression and its regulation. While many studies have been carried out in the examination of single genes and their expression patterns, comprehensive analyses of genome-wide expression profiles associated with cardiomyogenesis (i.e. the differentiation of stem cells into cardiomyocytes) are still rare. In fact, no study exists to date which compares and consolidates the publicly available genome-wide measurement for cardiomyogenesis. Such endeavour however is important, as it is well known that individual microarray studies can be seriously compromised by artefacts. In contrast, the combination of various expression studies, which was performed in my study, can lead to more reliable results and help elucidate the different aspects of heart development and repair. Furthermore, a brief study was performed regarding the potential risk of originating cancer or teratomas from stem cell therapy. Finally, I carried out a network-based analysis, to identify regulatory actions between genes, based on published interaction data. This type of analysis can also help to identify novel genes with a role in heart development and provide new valuable targets to future experimental laboratorial analysis. The combination of the multiple dataset is thus an important approach to gain better insights of the different heart development processes as well as regenerative medicine applied to the heart.
Keywords: Cardiomyocytes, Gata4, heart development, induced cardiomyocytes, Meis1, microarray, networks, Smyd1
RESUMO
Análise da rede reguladora de transcrição subjacente ao desenvolvimento cardíaco
O desenvolvimento cardíaco é um processo extremamente complexo com uma série de eventos espácio-temporais precisos ao nível molecular. Para compreender como estes eventos são controlados e coordenados, é necessário estudar a expressão genética subjacente em diferentes organismos, estadios de desenvolvimento celular e a sua regulação. Enquanto que muitos dos estudos realizados foram executados para uma análise individual dos genes e seus padrões de expressão, uma análise compreensiva dos perfis de expressão do genoma associada à diferenciação das células estaminais em cardiomiócitos ainda não existe. No presente trabalho foi realizada uma meta-análise de resultados publicados em 4 trabalhos independentes prévios, num total de 25 microarrays, que definiram a expressão diferencial “pangenómica” durante a diferenciação de células estaminais embrionárias em cardiomiócitos ou durante a transdiferenciação de células somáticas em cardiomiócitos. Este tipo de análise é no entanto essencial, pois a utilização das expressões de um único microarray é pouco fiável, podendo este estar seriamente comprometido por artefactos de natureza humana ou das próprias condições experimentais. Foi realizado um breve estudo relativamente ao risco de ocorrer a formação de teratomas a partir da terapia com células estaminais, com o objectivo de verificar se os genes que são comuns ao cancro e às celulas estaminais são semelhantes aos genes responsáveis pela formação dos cardiomiócitos e/ou cardiomiócitos induzidos.
Este tipo de análise é bastante importante, porque não se baseia apenas nos valores de expressão dos genes das experiências, esta análise vai também procurar validar a expressão dos genes por estudos estatísticos, sendo apenas considerados os genes que têm valores p-value ajustados significativos (<0.1). Este tipo de tratamento dos microarrays torna possível que os dados obtidos sejam mais fiáveis, podendo considerar que os genes adquiridos na análise apresentam consistentemente o mesmo padrão de expressão nos vários estudos em processos similares, procurando assim incluir genes que ainda não tenham sido ligados ao desenvolvimento e regeneração cardíaca. O estudo dos genes importantes para o desenvolvimento cardíaco definiu certos factores de transcrição essenciais para o
o desenvolvimento de linhagens de células cardíacas que a expressão exógena destes factores em células somáticas com funções diferentes leva a uma modificação radical da função e das propriedades destas células, tornando-as em células semelhantes a cardiomiócitos. O mecanismo molecular deste processo chamado transdiferenciação ainda é pouco claro, mas é provavel que involva genes que também sejam importantes para o desenvolvimento cardíaco ou diferenciação.
Para elucidar os mecanismos regulatórios subjacentes, foi construída uma rede de interações (networks) dos vários genes obtidos, com base em dados publicados de outros artigos. Foram tidos em consideração os factores de transcrição mais relevantes (tais como o Hand2, Mef2c e Gata4) que têm a capacidade de controlar o destino das células cardíacas. A combinação dos dados de expressão e interacção providenciaram um panorama detalhado da dinâmica dos mecanismos de regulação. Foi possível verificar qual a expressão temporal dos genes obtidos através da sua correlação e que tipo de interacção proteína-proteína existia entre os diversos genes.
A meta-análise dos vários estudos de expressão de genoma utilizados neste trabalho, faz com que este trabalho seja único e original, pois tal tipo de análise nunca foi realizada no contexto de tentar encontrar “novos” genes que estejam ligados ao desenvolvimento cardíaco. Este trabalho permitiu elucidar os diferentes aspectos do desenvolvimento e recuperação cardíaca e que genes podem estar envolvidos nesse processo. Através deste trabalho também foi possivel identificar, com algum grau de confiança, alguns genes potencialmente importantes e que ainda não foram completamente associados ao desevolvimento cardíaco, tal com é o caso dos genes Meis1, Smyd1 ou Zfpm2 e providenciou muitos outros indicadores para possíveis futuras experiências laboratoriais.
A combinação dos diversos microarrays foi um passo importante para compreender melhor os diferentes aspectos que estão envolvidos intrinsecamente com o desenvolvimento cardíaco e a medicina regenerativa. A sua posterior combinação com as redes de interação entre os genes levou a uma melhor interpretação dos resultados, possibilitando a compreensão do funcionamento temporal e como interagem entre si.
INDEX
Figure Index ... i
Table Index ... vii
Abbreviations ... x
Introduction ... 1
1. Biological Background ... 4
1.1. Embryonic Stem Cells ... 4
1.2. iPSc ... 5
1.3. Transdifferentiation of Cardiac Fibroblasts ... 6
1.4. Cancer Cells ... 7
2. Methodology ... 9
2.1. Microarray Technologies & Data Sets ... 9
2.1.1. General Genetic Expression in Mouse Embryonic Stem Cells ... 11
2.1.2. Rosetta 1... 11
2.1.3. Rosetta2 ... 12
2.1.4. Stanford ... 12
2.1.5. Human Gene Atlas ... 12
2.1.6. Mouse Gene Atlas ... 12
2.1.7. Reprogramming Mouse Fibroblast into Functional Cardiomyocites by Defined Factors ... 13
2.1.8. Reprogramming Non-Myocytes with Cardiac Transcription Factors ... 14
2.1.9. hiPSc Differentiation Toward Cardiomyocytes ... 14
2.2. Gene Expression Analysis ... 16
2.2.1. Preprocessing of Microarray Data ... 16
2.2.2. Detection of Differential Expression ... 17
2.2.3. Clustering of Gene Expression Data ... 18
2.2.4. Functional Enrichment Analysis ... 18
2.3. Heart Expression ... 20
2.4. Network Analysis ... 21
2.5. Gene Comparative Analysis with Stem and Cancer Cells ... 22
2.5.1. Gene List for Cancer and Pluripotency ... 22
2.5.2. Assessing Significance of Common Genes ... 22
3.1. General Genetic Expression in Mouse Embryonic Stem Cells ... 24
3.2. Genetic Expression in Different Tissues ... 40
3.3. Genetic Expression Between Cardiac Fibroblast and Induced Cardiomyocytes and Differentiation into Cardiomyocytes ... 44
3.3.1. Reprogramming Mouse Fibroblast into Functional Cardiomyocites by Defined Factors ... 45
3.3.2. Reprogramming Non-Myocytes with Cardiac Transcription Factors ... 52
3.3.3. hiPSc Differentiation Toward Cardiomyocytes ... 58
3.4. Comparison of Biological Process, Molecular Functions and KEGG Pathways between Cardiac Data Sets and Mouse ESc ... 71
3.4.1. Biological Process ... 71
3.4.2. Molecular Functions ... 73
3.4.3. KEGG Pathways ... 74
3.5. Comparison of Individual Gene Profiles Between Cardiac Data Sets and Mouse ESc75 3.5.1. Positive Early Gene Expression ... 76
3.5.2. Positive Intermediate Gene Expression ... 79
3.5.3. Positive Late Gene Expression... 82
3.6. Network Strutural Analysis ... 87
3.6.1. Correlation Network ... 87
3.6.2. PPI Data Network ... 90
3.7. Gene Comparative Analysis with Stem Cells and Cancer Cells ... 92
3.8. “HeartEXpress” Interactive Platform ... 97
4. Conclusion ... 99 5. References ... 102 Annex ... 109 Annex I ... 110 Annex II ... 117 Annex III ... 118 Annex IV ... 119 Annex V ... 120
FIGURE INDEX
1. Biological Background 1.4. Cancer Cells
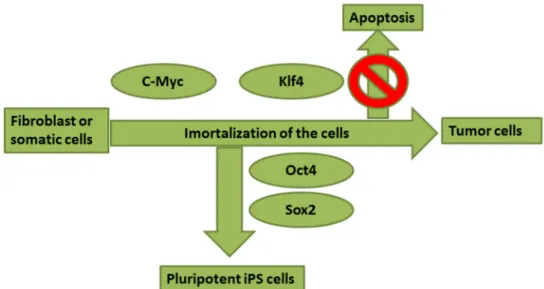
Figure 1.4.1. Possible roles for the four transcription factors in the generation of iPSc or tumor cells (adapted from Yamanaka, 2007). . . 8 2. Methodology
2.1. Microarray Technologies and Data Sets
Figure 2.1.1. One-colour channel microarray platform, Affymetrix GeneChip (on the left) and Illumina (on the right). . . 10 2.2. Gene Expression Analysis
2.2.1. Preprocessing of Microarray Data
Figure 2.2.1.1. Simple steps from CEL files to expression set. It starts with an affybatch file, it is submitted to a background correction, normalization, pm correction and summarization and finally is turned in to an expression set (adapted from Gautier et al., 2003). 17 2.4. Network Analysis
Figure 2.4.1. A simplified schematic overview of the Cytoscape functionality. (Schematic adapted from Shannon et al., 2012). . . 21 3. Results
3.1. General Genetic Expression in Mouse Embryonic Stem Cells
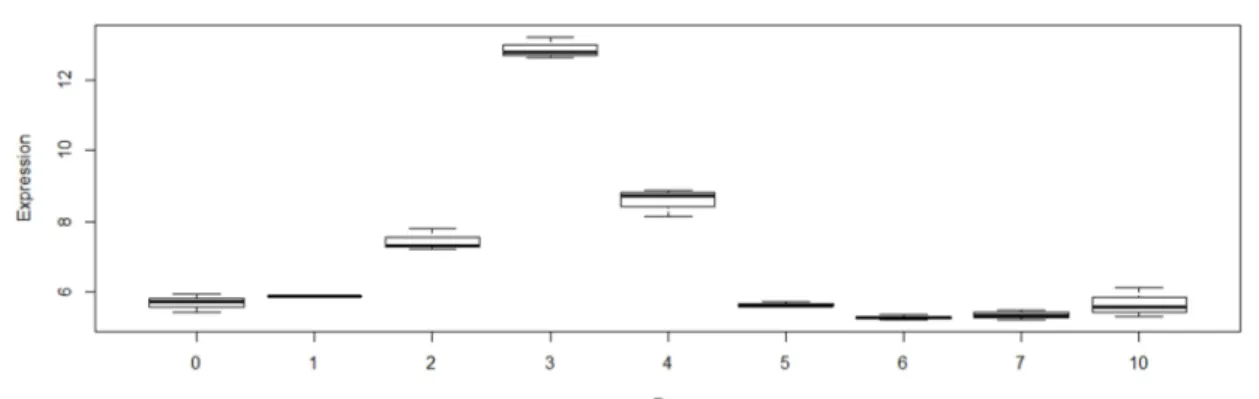
Figure 3.1.1. Cluster dendrogram for Gaspar et al. 2012 data set. . . 24 Figure 3.1.2. Expression of Nanog homeobox on Gaspar et al. 2012 data set. . . 26 Figure 3.1.3. Expression of SRY-box containing gene on Gaspar et al. 2012 data
set. . . 26 Figure 3.1.4. Expression of DNA (cytosine-5-)-methyltransferase 3-like on
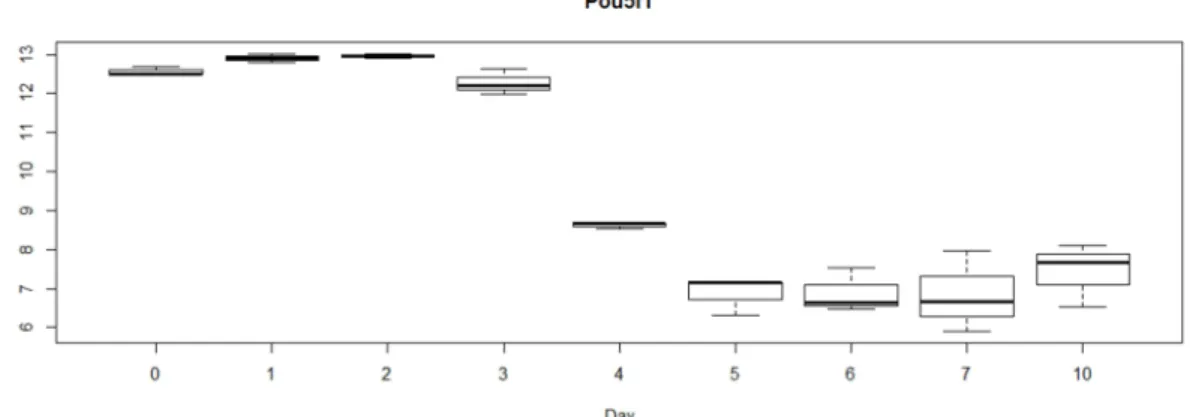
Gaspar et al. 2012 data set. . . 27 Figure 3.1.5. Expression of POU domain, class 5, transcription factor 1 on
Gaspar et al. 2012 data set. . . 28 Figure 3.1.6. Expression of developmental pluripotency associated 2 on Gaspar
Figure 3.1.7. Expression of neurofilament (light polypeptide) on Gaspar et al. 2012 data set. . . 30 Figure 3.1.8. Expression of T Brachyury on Gaspar et al. 2012 data set. . . 31 Figure 3.1.9. Expression of eomesodermin homolog on Gaspar et al. 2012 data
set. . . 32 Figure 3.1.10. Expression of heart and neural crest derivatives expressed
transcript on Gaspar et al. 2012 data set. . . 33 Figure 3.1.11 Expression heart and neural crest derivatives-expressed protein 2
on Gaspar et al. 2012 data set. . . 34 Figure 3.1.12. Expression of collagen and calcium binding EGF domains 1 on
Gaspar et al. 2012 data set. . . 35 Figure 3.1.13. Expression of Cbp/p300-interacting transactivator 2 on Gaspar et
al. 2012 data set. . . 36 Figure 3.1.14. Expression of troponin T type 2 (cardiac) on Gaspar et al. 2012
data set. . . 37 Figure 3.1.15. Expression of actin, alpha, cardiac muscle 1 on Gaspar et al. 2012
data set. . . 37 Figure 3.1.16. Expression of myosin, heavy chain 7, cardiac muscle, beta on
Gaspar et al. 2012 data set. . . 38 Figure 3.1.17. Expression of ankyrin repeat domain 2 (stretch responsive
muscle) on Gaspar et al. 2012 data set. . . 39 3.2. Genetic Expression in Different Tissues
Figure 3.2.1. Mean expression in density of transcription factor that are up regulated vs. down regulated Rosetta 1. . . 41 Figure 3.2.2. Mean expression in density of all genes that are up regulated vs.
down regulated Rosetta1. . . 41 Figure 3.2.3. Genes with the highest averaged expression in all tissue in
Rosetta 1 data set. . . 42 Figure 3.2.4. Genes with the highest averaged expression in all tissue in
Rosetta 1 data set. . . 42 Figure 3.2.5. Group of genes that are clustering together in Rosetta 1. . . 43
3.3. Genetic Expression Between Cardiac Fibroblast And Induced Cardiomyocytes and Differentiation into Cardiomyocytes
3.3.1. Reprogramming Mouse Fibroblast Into Functional Cardiomyocytes by Defined Factors
Figure 3.3.1.1. Cluster dendrogram for the Ieda et al. 2010 data set. . . 45 Figure 3.3.1.2. Expression of myocyte enhance factor 2C in several cells types on
Ieda et al., 2010 data set. . . 46 Figure 3.3.1.3. Expression of GATA binding protein 4 in several cells types on
Ieda et al., 2010 data set. . . 46 Figure 3.3.1.4. Expression of T-box 5 in several cells types on Ieda et al., 2010
data set. . . 47 Figure 3.3.1.5. Expression of myosin, heavy chain 7, cardiac muscle, beta in
several cells types on Ieda et al., 2010 data set. . . 48 Figure 3.3.1.6. Expression of Fibroblast growth factor 1 in several cells types on
Ieda et al., 2010 data set. . . 48 Figure 3.3.1.7. Expression of troponin T type 2 (cardiac) in several cells types on
Ieda et al., 2010 data set. . . 49 Figure 3.3.1.8. Expression of actin, alpha, cardiac muscle 1 in several cells types
on Ieda et al., 2010 data set. . . 49 Figure 3.3.1.9. Expression of fibroblast growth factor receptor 1 in several cells
types on Ieda et al., 2010 data set. . . 50 Figure 3.3.1.10. Expression of discoidin domain receptor tyrosine kinase 2 in
several cells types on Ieda et al, 2010. data set. . . 50 Figure 3.3.1.11. Expression of fibroblast growth factor 2 in several cells types on
Ieda et al., 2010 data set. . . 51 3.3.2. Reprogramming Non-Myocytes With Cardiac Transcription Factors
Figure 3.3.2.1. Cluster dendrogram for the Song et al., 2012 data set. . . 52 Figure 3.3.2.2. Expression of GATA binding protein 4 on Song et al., 2012 data
set. . . 53 Figure 3.3.2.3. Expression of heart and neural crest derivatives expressed
transcript 2 on Song et al., 2012 data set. . . 53 Figure 3.3.2.4. Expression of myocyte enhance factor 2C on Song et al., 2012
data set. . . 54 Figure 3.3.2.5. Expression of T-box 5 on Song et al., 2012 data set. . . 54
Figure 3.3.2.6. Expression of myosin heavy chain beta on Song et al., 2012 data set. . . 55 Figure 3.3.2.7. Expression of troponin T type 1 on Song et al., 2012 data set. . . 55 Figure 3.3.2.8. Expression of actin, alpha cardiac muscle 1 on Song et al., 2012
data set. . . 56 Figure 3.3.2.9. Expression of fibroblast growth factor receptor 1 on Song et al.,
2012 data set. . . 57 Figure 3.3.2.10. Expression of discoidin domain receptor family, member 1, on
Song et al., 2012 data set. . . 57 3.3.3. hiPSc Differentiation Toward Cardiomyocytes
Figure 3.3.3.1. Cluster dendrogram for the Uosaki et al., 2011 data set. . . 58 Figure 3.3.3.2. Expression of Nanog homeobox on Uosaki et al., 2011 data set. . .
. . . 60 Figure 3.3.3.3. Expression of Pou domain, class 5, transcription factor 1 on
Uosaki et al., 2011 data set. . . 60 Figure 3.3.3.4. Expression of SRY-box containing gene 2 on Uosaki et al., 2011
data set. . . 60 Figure 3.3.3.5. Expression of T Brachyury on Uosaki et al., 2011 data set. . . 62 Figure 3.3.3.6. Expression of eomesodermin homolog on Uosaki et al., 2011 data
set. . . 62 Figure 3.3.3.7. Expression of ISL LIM homeobox 1 on Uosaki et al., 2011 data set.
. . . 64 Figure 3.3.3.8. Expression of heart and neural crest derivatives expressed
transcript 1 on Uosaki et al., 2011 data set. . . 64 Figure 3.3.3.9. Expression of GATA binding protein 4 on Uosaki et al., 2011 data
set. . . 66 Figure 3.3.3.10. Expression of Nkx2 homeobox 5 on Uosaki et al., 2011 data set. . .
. . . 67 Figure 3.3.3.11. Expression of myocyte enhancer factor 2C on Uosaki et al., 2011
data set. . . 67 Figure 3.3.3.12. Expression of T-box 5 on Uosaki et al., 2011 data set. . . 68
Figure 3.3.3.14. Expression of actin, alpha, cardiac muscle 1 on Uosaki et al., 2011 data set. . . 69 Figure 3.3.3.15. Expression of troponin T type 2 (cardiac) on Uosaki et al., 2011
data set. . . 70 3.4. Comparison of Biological Process, Molecular Functions and KEGG Pathways between Cardiac Data Sets and Mouse ESC
3.4.1. Biological Process
Figure 3.4.1.1. Heat map for biological processes. . . 72 3.4.2. Molecular Functions
Figure 3.4.2.1. Heat map for molecular function. . . 73 3.4.3. KEGG Pathways
Figure 3.4.3.1. Heat map for KEGG pathways. . . 74 3.5. Comparison of Individual Gene Profiles Between Cardiac Data Sets and Mouse ESc 3.5.1. Positive Early Gene Expression
Figure 3.5.1.1. Venn diagram with number of shared genes for the comparative analysis for heart expression. . . 76 Figure 3.5.1.2. Biological function (on the right) and expression (on the left) for
some of the obtained genes in the overlap for positive early gene expression. . . 78 3.5.2. Positive Intermediate Gene Expression
Figure 3.5.2.1. Biological function (on the right) and expression (on the left) for the obtained genes in the overlap for positive intermediate gene expression. . . 79 Figure 3.5.2.2. Venn diagram with number of shared genes for the comparative
analysis for heart expression. . . 80 3.5.3. Positive Late Gene Expression
Figure 3.5.3.1. Venn diagram with number of shared genes for the comparative analysis for heart expression. . . 82 Figure 3.5.3.2. Biological function (on the right) and expression (on the left) for
the obtained genes in the overlap for positive late gene expression. . . 86
3.6. Network Structural Analysis 3.6.1. Correlation Network
Figure 3.6.1.1. Protein-Protein Interaction Network filtered from publically available interaction studies. . . 88 Figure 3.6.1.2. Gene expression network with correlation >0.75 in cytoscape for
Day 0 expression values in Gaspar (2012) data set. . . 89 3.6.2. PPI Data Network
Figure 3.6.2.1. Figure 3.7.2.1. Protein-Protein Interaction Network filtered from publically available interaction studies. . . 90 3.7. Gene Comparative Analysis With Stem Cells and Cancer Cells
Figure 3.7.1. Venn diagram with number of shared genes for the comparative analysis for genes down-regulated during ESc differentiation. . . 93 Figure 3.7.2. Venn diagram with number of shared genes for the comparative
analysis for genes up-regulated during ESc differentiation. . . 95 3.8. “HeartEXpress” Interactive Platform
Figure 3.8.1. HeartEXpress user interface. . . 97 Figure 3.8.2. A mouse click on the displayed expression of a gene will open
another page displaying all genes that are co-expressed with the chosen gene. . . 98
TABLE INDEX
2. Methodology 2.3. Heart Expression
Table 2.3.1. Heart expression analysis parameters. . . 20 3. Results
3.1. General Genetic Expression in Mouse Embryonic Stem Cells
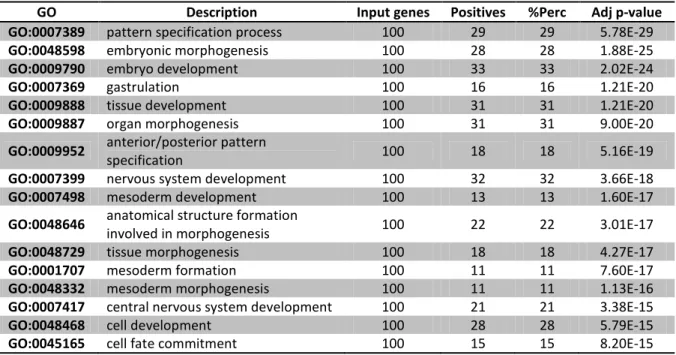
Table 3.1.1. Biological functional analysis in Day 0 on Gaspar et al. 2012 data set. . . 27 Table 3.1.2. Biological functional analysis in Day 1 on Gaspar et al. 2012 data
set. . . 29 Table 3.1.3. Biological functional analysis in Day 2 on Gaspar et al. 2012 data
set. . . 30 Table 3.1.4. Biological functional analysis in Day 3 on Gaspar et al. 2012 data
set. . . 32 Table 3.1.5. Biological functional analysis in Day 4 on Gaspar et al. 2012 data
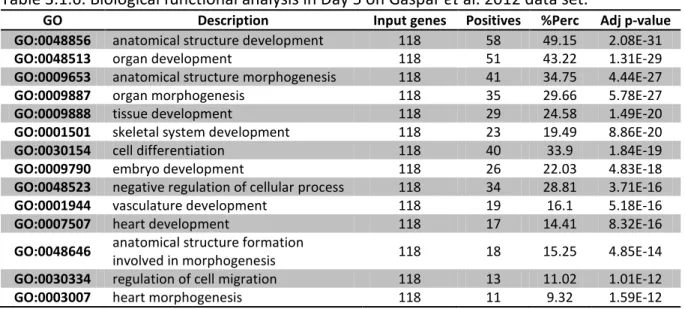
set. . . 33 Table 3.1.6. Biological functional analysis in Day 5 on Gaspar et al. 2012 data
set. . . 34 Table 3.1.7. Biological functional analysis in Day 6 on Gaspar et al. 2012 data
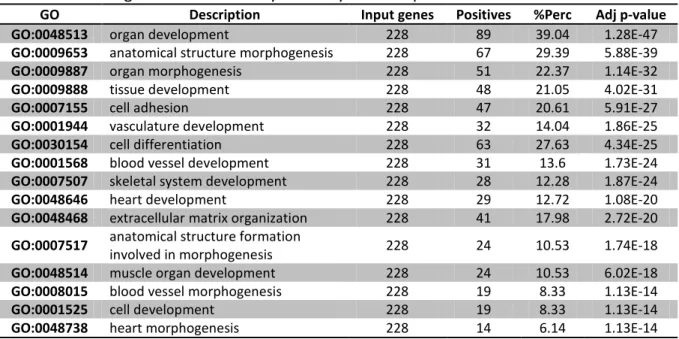
set. . . 36 Table 3.1.8. Biological functional analysis in Day 7 on Gaspar et al. 2012 data
set. . . 38 Table 3.1.9. Biological functional analysis in Day 10 on Gaspar et al. 2012 data
set. . . 39 3.3. Genetic Expression Between Cardiac Fibroblast And Induced Cardiomyocytes and Differentiation into Cardiomyocytes
3.3.3. hiPSc Differentiation Toward Cardiomyocytes
Table 3.3.3.1. Temporal alignment between some key marker genes present in Mouse and Human. (General Genetic Expression In Mouse Embryonic Stem Cells and hiPSc Differentiation Toward Cardiomyocytes) . . . 59
Table 3.3.3.2. Biological functional analysis in Day 0 on Uosaki et al., 2011 data set. . . 61 Table 3.3.3.3. Biological functional analysis in Day 2 on Uosaki et al., 2011 data
set. . . 63 Table 3.3.3.4. Biological functional analysis in Day 5 on Uosaki et al., 2011 data
set. . . 65 Table 3.3.3.5. Biological functional analysis in Day 7 on Uosaki et al., 2011 data
set. . . 66 Table 3.3.3.6. Biological functional analysis in Day 9 on Uosaki et al., 2011 data
set. . . 68 Table 3.3.3.7. Biological functional analysis in Day 11 on Uosaki et al., 2011 data
set. . . 70 3.4. Comparison of Biological Process, Molecular Functions and KEGG Pathways between Cardiac Data Sets and Mouse ESC
Table 3.4.1. Data sets used for the comparison of the multiple processes. . . 71 3.5. Comparison of Individual Gene Profiles Between Cardiac Data Sets and Mouse ESc Table 3.5.1. Gene lists used for comparative analysis regarding heart gene
expression in early, intermediate and late stage. . . 75 3.5.1. Positive Early Gene Expression
Table 3.5.1.1. Number of genes present in the overlap with determined biological functions in an early stage. . . 77 3.5.2. Positive Early Gene Expression
Table 3.5.2.1. Number of genes present in the overlap with determined biological functions in an intermediate stage. . . 80 3.5.1. Positive Early Gene Expression
Table 3.5.3.1. Number of genes present in the overlap with determined biological functions in a late stage. . . 83 3.7. Gene Comparative Analysis With Stem Cells and Cancer Cells
Table 3.7.1. Gene lists used for comparative analysis. . . 93 Table 3.7.2. Significance of common genes in different combinations of gene
Table 3.7.4. Significance of common genes in different combinations of gene lists. . . 95
ABBREVIATIONS
ACFGHMT – Adult Cardiac Fibroblast with Gata4, Hand2, Mef2c and Tbx5 CF – Cardiac Fibroblasts
c-Myc – v-myc myelocytomatosis viral oncogene homolog ESc – Embryonic Stem cells
eSet – Expression Set
Gata4 – Transcription factor, gata binding protein 4 GEO – Gene Expression Omnibus
GHMT – Gata4, Hand2, Mef2c and Tbx5 GMT – Gata4, Mef2c and Tbx5
GO – Gene Ontology
Hand2 – Transcription factor, heart and neural crest derivatives expressed transcript 2 hESc – human Embryonic Stem cells
(h)iPSc – (human) induced Pluripotent Stem cells iCM – induced Cardiomyocytes
iPSc – induced Pluripotent Stem cells Klf6 – Kruppel-like factor 6
Mef2c – Transcription factor, myocyte enhancer factor 2c mESc – mouse Embryonic Stem cells
mESCDiff – mouse Embryonic Stem Cell Differentiation MyoCD – Myocardin
Nanog – Nanog homeobox
Pou5f1 – Transcription factor also known as Oct4, POU class 5 homeobox 1 PPI – Protein-Protein Interaction
Tbx5 – Transcription factor T-box 5 TP53 – Tumor suppressor protein p53 WiCM – Week induced Cardiomyocytes
INTRODUCTION
The process of heart development is highly complex, involving a series of precisely spatially and temporally ordered events on molecular level. To better understand how these events are controlled and coordinated, it is necessary to study the gene expression and its regulation, ideally on a genome-wide level. Using microarray technology, several studies genome-wide expression profiles associated with heart development have been carried out. Although they have given comprehensive views of expression changes during cardiogenesis, they may have their pitfalls. It is well known that single microarray experiment might be seriously compromised by artefacts. Thus, it is important to compare and consolidate the genome-wide microarrays studies. However, to date no meta-analysis of microarray data for cardiogenesis have been attempted. Such lack of assessment can be considered as a serious obstacle on the way to understand how to improve our knowledge in cardiac regenerative medicine.
This thesis aims to provide such critical meta-analysis, which integrates publically available data sets for cardiogenesis to obtain a detailed and reliable comprehensive view of expression changes in cardiogenesis. Using the consolidated data, I elucidate the networks underlying heart development which are still only rudimentarily understood. Such endeavour will help to get a better view of this intrinsically complex process and give valuable cues for regenerative medicine applied to heart.
The thesis can be divided in three different parts: In the first part, I will describe the collection of publicly available data sets from various studies. These data sets comprise expression data for various types of cells, such as, embryonic stem cells, induced cardiomyocytes derived from cardiac fibroblast, cancer cells and several types of tissue samples. Such a broad basis can help to distinguish transcriptional patterns which are specific to heart development from more generic gene expression patterns.
The second part focuses on the analysis of those data sets and provides a comprehensive view of the dynamics of gene expression during cardiomyogenesis. The analyses included some standard pre-processing, background correction and summarization of expression values. I also applied clustering methods to identify potential co-regulated genes.
Subsequently, I have identified transient expression patterns through clustering methods and evaluated their functional relevance to obtain indications which processes are active during the different stages of differentiation. Besides stem cell differentiation, a focus of the thesis is set on the reprogramming of somatic cells into cardiomyocytes. Originally, it has been demonstrated in the landmark studies led by Shinya Yamanaka that fibroblasts can be turned into to so called “induced Pluripotent Stem cells” (iPSc) through expression of mere four transcription factors which have a critical role in Embryonic Stem cells (ESc) properties [1]. These iPSc appear to be indistinguishable from ESc in their morphology, proliferation and gene expression, but care might be needed, as iPSc have been linked to teratoma formation [1] and immune responses [2]. Notably, it is also possible to induce cardiomyocytes from iPSc efficiently [3]. Interestingly, the ectopic expression of pro-cardiogenic transcription factors in fibroblast will originate cells with properties similar to those of cardiomyocytes. For reprogramming fibroblasts into cardiomyocytes, a single master regulator has not been found for cardiac differentiation, but several core transcription factors are being extensively studied [4].
As last part of this work, a network analysis was carried out. Here, I constructed a molecular interactions networks to examine regulatory actions occur based on published interaction data.
Combining expression and interaction data, gives a detailed picture of the dynamic regulatory mechanisms underlying heart development. In the end, by putting all things together, I will seek to identify and characterize any additional key regulators, which will possibly provide some major candidates for a future experimental validation in cardiomyogenesis.
Reprogramming of cells toward cardiac fate
There are core set of transcription factors that are highly conserved through evolution, controlling cell fate, cardiac gene expression and heart development. Remarkably, it was reported a few years ago that the exogenous expression of Gata4, Mef2c and Tbx5 were capable of converting neonatal cardiac fibroblast into cardiomyocytes-like cells in vitro [4].
The cooperative interaction between these transcription factors is consistent with their ability to activate cardiac gene expression and activate each other’s expression in adult cardiac cells [5]. A subsequent study has indicated that the most effective combination of transcription factors for this process is Gata4, Hand2, Tbx5 and Mef2c. [5]. The efficiency of cellular reprogramming into induced cardiomyocytes by these 4 transcription factors is comparable to the reprogramming iPSc by pluripotency factors. Finding an ideal combination is not easy, as including additional factors might promote but might also hinder reprogramming. For instance, Song (2012) determined that Nkx2-5, a primary marker of cardiomyocytes, decreased the efficiency of the five transcription factors used in his experiment. Another gene that is important for cardiomyogenesis is Isl1 that is transiently expressed in early cardiac progenitor cells before further cardiac differentiation. However, it may not be activated during reprogramming, as Inagawa and colleagues [6] observed that fibroblast are converted directly into differentiated cardiomyocytes without passing through a progenitor cell state, showing that expression of Isl1 is not essential for creating iCMs. To confirm the correct transdifferentiation of cells into induced cardiomyocytes, the expression of standard cardiac markers necessary for cardiomyocyte functions, such as cardiac troponin T, also known as Tnnt2 and alpha-myosin heavy chain, also known as Myh7, in late cell differentiation or in differentiated cell stage [5] was analysed.
While the reprogramming event appears to be stable at the epigenetic level, the global gene expression of iCMs and neonatal cardiomyocytes are similar, but not identical. Despite remarkable progress, it still remains important to optimize the combination of transcription factors for reprogramming of cells such as fibroblasts into fully functional induced cardiomyocytes-like cells, as so far the efficiency of reprogramming is fairly limited. This achievement would be even greater if the cultured cells do not need to go through an induced pluripotent cell (iPSc) stage.
Moreover, it is important in this context, to carefully assess the similarity of gene expression patterns of induced pluripotent cells with cancer cells, because these can share some characteristic features such as the capacity of infinite division.
Finally, combination of various expression studies and the subsequent analysis of the interaction networks can help elucidate the different aspects of heart morphology, development and repair.
1.
BIOLOGICAL BACKGROUND
For a better understanding of the differentiation and/or transdifferentiation process of an ESc, iPSc and somatic cell towards a cardiac cell fate, I analysed several publically available microarrays data sets obtained from embryonic stem cells and induced pluripotent stem cells at various stages of differentiation, as well as transdifferentiation of cardiac fibroblasts into cardiomyocytes. I used this comparative analysis to distinguish commonly expressed genes from genes activated only under certain conditions that are relevant for cardiac differentiation. In the following, I will introduce and describe the main types of cells whose expression was analysed in my study.
1.1. EMBRYONIC STEM CELLS
ESc are derived from the inner cell mass of blastocyst embryos and they have a unique capacity to proliferate extensively while maintaining pluripotency [2].
ESc can be easily identified, isolated and maintained in a pluripotency state. Notably, it is possible to keep them in culture for long periods of time, serving as a back-up cells, ready to use [7]. As they are pluripotent, they can differentiate into germ cells or any derivative of the three primary embryonic germ layers: Endoderm (lungs); Mesoderm (muscle, blood, heart); Ectoderm (epidermal tissue and nervous system). They can also be genetically manipulated and numerous protocols have been established that allow the differentiation of embryo-derived stem cells into almost any type of cell [7]. For maintenance and regulation of pluripotency, specific transcription factors in ESc such as the Pou5f1, Sox2 and Nanog, play a very important role.
Oct4 expression is restricted to the blastomeres of the developing mouse embryo, in the inner cell mass of the blastocyst, epiblast and germ layers. It is also expressed in pluripotent stem cells, including embryonic stem cells, embryonic germ cells and embryonic carcinoma cells [2]. Oct4 plays an important role in the maintenance of pluripotency and promoting differentiation [2].
Sox2 also marks the pluripotent lineage of the early mouse embryo and, unlike Oct4, Sox2 is also expressed by multipotent cells of extra embryonic ectoderm [2]. Its expression is
Nanog is expressed in ESc and not expressed in differentiated cells, indicating that this gene expression is responsible for pluripotency cell maintenance [8]. Endogenous Nanog expression in parallel with Stat3 drives ESc self-renewal [8]. Nanog overexpression is enough for clonal expansion of ESc, maintaining Oct4 levels elevated. This shows that this transcription factor is essential for defining ESc identity [8]. Down regulation of Nanog cause ESc to lose pluripotency and to differentiate into extraembryonic endoderm lineage [9].
Nevertheless, there remain some challenges in determine optimal conditions to maintain cells pluripotent or promote their efficient and reliable differentiation using ESc: (i) Experimental conditions or small variations of culture techniques can lead to different outcomes; (ii) Onset and shutdown of important biological factors occur in a narrow time window, so we could fail to detect or interpret correctly important biological processes; (iii) comprehensive functional genomics technologies, stringent statistical criteria and bioinformatics analysis are necessary to get a deep view into the complex biological processes occurring at the different time points of the differentiation.
Despite these potential obstacles, ESc lines are considered as encouraging donor sources to repair or replace damaged tissue, reverse diseases and injuries and cell transplantation therapies for diseases such as diabetes, cardiovascular and blood diseases [2, 10]. For applications related to tissue regeneration (“regenerative medicine”), it will be crucial to understand in detail how stem cells organise in vivo the generation, maintenance and regeneration of tissue, while preventing or suppressing abnormal growth and avoiding depletion [7].
1.2. IPSC
It was showed that iPSc can be generated from adult human and mouse fibroblast and other somatic cells by ectopic expression of four transcription factors (Klf4, Sox2, c-Myc and Pou5f1 - also known by Oct4) [1, 2] that play important roles in the maintenance of pluripotency. Although, other combinations of factors have been shown to also achieve reprogramming of iPSc, the quartet of Oct4, Sox2, Klf4 and c-Myc (OSKM), referred commonly as Yamanka’s factors, are the most commonly used for reprogramming [1, 2, 11, 12]. The established human iPSc are similar to hESc in many aspects such as morphology, proliferation, gene expression and promoter activities, surface markers, in vitro
differentiation and teratomas formation [1]. Besides Oct4 and Sox2, two transcription factors are used:
c-Myc is an oncogene found in human cancers, involved in the transactivation of CBP and p300, which have histone acetylase activities, immortalizing, regulating the expression of non-coding RNAs and opening the chromatin of the cells [2].
Klf4 is a member of the family of Krüppel-like transcription factors and has an ambivalent role. It is highly expressed gene in differentiated post-mitotic epithelial cells of the skin and fibroblast. High levels of Klf4 RNA can be found in cells during growth arrest and it is almost undetectable in cells that are in exponential phase of proliferation, indicating to function as a tumor suppressor. Depending on the status of its target genes (especially of p21 and p53), it can also act as an oncogene promoting proliferation. This role is also supported by a high expression observed in some cancers as well as in mouse ESc [2].
During the reprogramming process, c-Myc promotes the immortalization and opens the chromatin, whereas Klf4 is essential to suppressed p53 (a tumor suppressor gene) and c-Myc-induced apoptosis [2, 13], so the balance of expression between the two factors might be critical for the reprogramming process from somatic cells/fibroblast into iPSc.
Forced expression of c-Myc and Klf4 alone would result in generation of tumor cells (figure 1.4.1), so it would be necessary to combine their induction with other factors, and here Oct4 plays an important role that prevents cells from turning into tumor cells. However, Oct4 alone is not sufficient to induce pluripotency, being Sox2 also required to active multiple target genes for generating iPSc [1, 2].
1.3. TRANSDIFFERENTIATION OF CARDIAC FIBROBLASTS
The heart is composed approximately by 30% of cardiomyocytes and 60-70% of cardiac fibroblast, being cardiac fibroblasts the prevailing cell type in the adult mammalian heart [4, 5]. The large population of cardiac fibroblast existing in the heart could be a potential source for induced cardiomyocytes for the purpose of regenerative medicine [4].
Indeed, cardiac fibroblast were already successfully reprogrammed into pluripotent cells and subsequently directly reprogrammed or transdifferentiated into induced
development, being capable of binding Mef2c and Tbx5 to their specific target sites, leading to complete activation of the cardiac programming process [5].
Recently, Gata4, Mef2c and Tbx5 (GMT), master regulators of cardiac development, were reported to be capable of converting neonatal fibroblast into cardiomyocytes in vitro when exogenously overexpressed during 2 weeks [4, 15]. In another study, these transcription factors in in combination with Hand2 (GHMT), another transcription factor involved in heart development, were used to convert cardiac fibroblasts into functional cardiomyocytes in vitro and directly in vivo in mouse infracted hearts [5].
The direct conversion of cardiac fibroblasts into cardiomyocytes constitutes an attractive paradigm. In this case, reprogramming into iPSc before cardiac differentiation is not necessary and this direct conversion would probably significantly lower the risk of originating teratomas or non-specific tissue. This approach is also attractive for future heart therapies, since a great amount of cardiac fibroblast can be cultivated from a simple cardiac biopsy, and performing an in vitro transduction with the defined factors to obtain a large amount of iCM is relatively easy, before their delivery into the damaged heart. More interestingly, is the potential delivery of cardiomyocytes reprogramming factors to convert in vivo cardiac fibroblasts of the scar tissue generated in infracted hearts into functional cardiomyocytes. Furthermore, it is proven that the expression of the core GHMT factors in mouse infracted hearts reduces fibrosis and improves cardiac function in vivo [5]. It is also possible that other mechanisms like enhancement survival of cardiomyocytes, differentiation of activated cardiac progenitors into cardiomyocytes, blockade of the activation of cardiac fibroblasts are affected in a positive way by this core transcription factors in the heart myocardial infarction [5].
1.4. CANCER CELLS
Cancer cells are cells that grow and divide at a high rate, without any regulation from the host organism. Many factors can play an important role in the development of cancer cells, such as genetics, age, environment, immune system. Due to these factors, cells can lose their ability to mark and destroy damaged cells and lead to cancer cells. One of the most studied processes of the apoptosis of damaged cells is the functionality of the tumor suppressor tp53[16], in which this gene loses the functionality and does not mark for
Stem cells and cancer cells share some characteristic features such as the capacity to infinite division and self-renewal [17, 18]. Thus, common processes and genes may be activated in both types of cells. Indeed, studies have showed that both stem and cancer cells can share a significant number of common activated genes, which points to the execution of a common molecular program in both types of cells[17].
For most cancers, the transforming genetic mutations are still not exactly known. Nevertheless, some types of cancers appear to arise from mutations that accumulate in stem cells [16, 17]. In general, there are many apparent connections between stem cells and cancer that are important to understand [17]. In particular, understanding the process for the control of self-renewal of normal stem cells could give new insights into the origins of cancer.
Figure 1.4.1. Possible roles for the four transcription factors in the generation of iPSc or tumor cells (adapted from Yamanaka, 2007).
2.
METHODOLOGY
This chapter details the microarrays chosen for the gene expression data sets analysis and the methods used to filter and treat all the data sets gathered along this study. It contains a brief description of the data sets, bioinformatic tools used in this study and the network analysis procedures. Finally, it describes methods used for the comparative gene analysis between stem cells and cancer cells.
2.1. MICROARRAY TECHNOLOGIES & DATA SETS
Although, the DNA content is the same in every cell of an organism, tissues show an amazing diversity of functions due to the tissue-specific gene expression. To understand better this diversity, genome-wide measurements of expression have been made in many types of tissues from various organisms. Nowadays, the study of expression of a remarkably large number of genes is routinely performed using the microarrays technology.
Microarrays have therefore become a great tool to perform genome-wide measurements, being a crucial tool to create a comprehensive gene expression atlas for different organisms, to facilitate rapid identification of new marker genes for improved diagnosis and target genes. This kind of atlas would increase general understanding in gene expression and give new information about functions of genes.
Generally, microarrays are based on the hybridization of labelled transcripts to a complementary nucleotide sequences attached to a solid surface. There are two types of microarrays, two-channel and one-channel microarray. The two-channel microarrays, in two samples are co-hybridized on the same array and the one-channel microarray, where only a single sample is hybridized on a microarray.
In this work the main types of microarrays are one-channel microarrays from the companies Affymetrix and Illumina. These microarrays platforms can be reliable due to their accuracy and precision.
Figure 2.1.1. One-colour channel microarray platform, Affymetrix GeneChip [19] (on the left) and Illumina [20] (on the right).
Affymetrix produces an oligonucleotide microarray (also called GeneChips) that are manufactured using photolithography [19]. Photolithography is a process of using light to control the manufacture of multiple layers of material. For GeneChip production, Affymetrix uses photolithography masks that contains tiny holes designed to let light through for the sequence that is receiving the next nucleotide[19]. The sequences that are protected from light will not receive another nucleotide to the DNA strand and the ones that are not protected from the light will receive a nucleotide to add in the growing DNA chain[19]. Each mask is designed to add new nucleotides in different sequences and this process is repeated over and over again with a new mask until the desired sequences are completed [19].
Illumina microarray or BeadArrays contain of oligonucleotides immobilized in beads that are held in microwells on the array substrate. It is highly reproducible since it was a high level of bead type redundancy (in average 30 beads per probe) [20]. These beads are randomly distributed across the array and the unique sequences present in each bead are used for identifying the location of each bead [20]. Each probe location and sequence combination on Illumina bead chip is carefully selected bioinformatically [20]. Hybridization of the whole-gene expression assay offers the highest capability for simultaneously profile more than 47000 transcripts. To identify the unique sequences on the beads, Illumina uses sequencing by synthesis technology, which consists in sequencing tens of millions of clusters on the array [20]. During each sequencing cycle, a nucleotide is added to the nucleic acid
nucleotide, the fluorescent dye is imaged to identify the base used. Inserted nucleotides are identified directly from signal intensity measurements during each cycle [20].
2.1.1. GENERAL GENETIC EXPRESSION IN MOUSE EMBRYONIC STEM CELLS
A dataset produced by Gaspar et al. 2012 [21], which profiled the RNA expression in the first 10 days of in vitro differentiation of mouse CGR8 ESc, was used in my study. CGR8 is a cell line that was established from the inner cell mass of a 3.5 day male pre-implantation embryo (Mus musculus, strain 129) [21]. These pluripotent cells retain their ability to participate in normal embryonic development. Supplementation of LIF (Leukaemia Inhibiting Factor) in the culture media allows culture of undifferentiated CGR8 ESc without the use of any feeder layers.
For this study, cRNA was prepared according to the standard Affymetrix protocol. From the 45,101 probe sets represented on the Mouse 430 version 2 array, expression data of 30,526 gene associated transcripts were analysed after eliminating transcripts without annotation and of unknown origin, as well as hypothetical transcripts or proteins. These expression measurements were performed in triplicates from biologic independent samples [21]. In total, the dataset comprises of 27 samples taken at different time points days of age (0, 1, 2, 3, 4, 5, 6, 7, 10 days).
The results of the microarray were deposited in the EBI ArrayExpress, data set E-TABM-672. The CEL files were downloaded from there and were submitted to background correction, normalization and summarization of gene expression (rma), through a package called limma implemented in programming language “R” (see below for a description of these methods).
2.1.2. ROSETTA 1
The data set Rosetta 1 was generated using Agilent spotted oligonucleotide microarrays and contains expression patterns for 10000 genes in 52 different types of tissue and cell lines [22].
For further analyses and to facilitate the comparison, the samples were assigned to 19 main tissue classes based on their physiology and histology [23]. The data was log transformed and subsequently normalized using the quantile normalization which is based
reference chip [23].This data set was retrieved from BMC Genomics Site in the additional files, additional file 1 (http://www.biomedcentral.com/1471-2164/11/305/additional) [23].
2.1.3. ROSETTA2
Data set Rosetta2 was generated using Agilent spotted oligonucleotide microarrays and contained expression patterns for 50000 genes in 54 different types of tissue [24]. As in the Rosetta 1 data set, the data used was merged into 19 main tissue to facilitate comparison [23]. This data set was retrieved from BMC Genomics Site in the additional files tab, additional file 2 (http://www.biomedcentral.com/1471-2164/11/305/additional) [23].
2.1.4. STANFORD
In this study, Shyamsundar and co-workers (2005) measured gene expression in 115 tissue samples on a dual channel cDNA microarray containing 39,711 human cDNA, representing 26,260 different genes [25]. Tables with the pre-processed expression values for the analysed data were taken from (http://www.biomedcentral.com/1471-2164/11/305/additional) [23].
2.1.5. HUMAN GENE ATLAS
Su (2004) created a genome-wide expression profile of 79 human tissues using Affymetrix HG-U133A and customized GNF1H comprising 42.865 probe sets and expression summaries were obtained using the Affymetrix Microarray Suite 5 (MAS5) [26].
That data processed by MAS5 was downloaded from the BioGPS website (http://biogps.org/downloads/), the annotations for the GNF1H were also taken from the same website. Annotations for the Affymetrix HG-U133A were obtained through R/Bioconductor package (hgu133a.db). Probes that could not be mapped were excluded from the analysis.
2.1.6. MOUSE GENE ATLAS
The used expression data set was downloaded from the BioGPS website (http://biogps.org/downloads/), the annotations for the GNF1M were also taken from the same website. Annotations for the Affymetrix GNF1M were obtain trough a package present in R, called org.Mm.eg.db (Genome wide annotation for Mouse), extracting from the package the annotation about gene id, symbol and description of the gene. Probes that could not be mapped were excluded from the analysis. These 61 physiologically normal tissues were obtained from adult (10-12 weeks) C57Bl/6 mice (4 male, 3 female) by dissection [26].
2.1.7. REPROGRAMMING MOUSE FIBROBLAST INTO FUNCTIONAL CARDIOMYOCITES BY DEFINED FACTORS
In a landmark study, Ieda and co-workers showed that it is possible to reprogram murine cardiac fibroblasts into cells with great similarities to cardiomyocytes [4].
In their study, they combined the exogenous expression of three fundamental heart development transcription factors (Gata4, Tbx5 and Mef2c) to transdifferentiate in vitro rapidly and efficiently post-natal cardiac fibroblast directly into differentiated cardiomyocytes-like cells. These so called iCM expressed cardiac-specific markers and have a global gene expression profile analogous to native cardiomyocytes. [4]. Notably, the authors also showed that the reprogramming occurs in a direct manner i.e. the fibroblasts are reprogrammed to iCMs without first becoming a stem or progenitor cells. Importantly, this induced transdifferentiation can also occur in vivo, as fibroblast cells showed that were transplanted into mouse hearts one day after transduction of the three factors and differentiated into iCMs [4].
These findings suggest that functional cardiomyocytes can be directly obtained from differentiated somatic cells by induction of defined factors [4]. Ieda and co-workers also performed genome wide expression analyses using Affymetrix Mouse Gene 1.0 ST Array. Besides profiling neo-natal murine cardiomyocytes and cardiac fibroblasts, the expression of successfully and non-successfully reprogrammed fibroblasts was measured. The success of reprogramming was measured using transgenic GFP under control of an aMHC promoter. GFP+ and GFP- were collect by fluorescent-activated cell sorting (FACS) after 2 and 4 weeks of culture [4]. Microarray analyses were performed in triplicate from independent biologic
The results of the microarray were deposited in GEO, with the accession number GSE22292. For my study, the CEL files were downloaded from there and were submitted to background correction, normalization and summarization of gene expression (rma), through a package present in “R” called affy.
2.1.8. REPROGRAMMING NON-MYOCYTES WITH CARDIAC TRANSCRIPTION FACTORS
Song (2012) demonstrated that the combination of GHMT (Gata4, Hand2, Mef2c, Tbx-5) factors could reprogram cardiac fibroblast into functional cardiomyocytes-like cells in vitro and in vivo. First they could demonstrate that the chosen combination of transcription factors correlated with their ability to convert fibroblasts into so called cardiac-like induced myocytes which express markers for cardiomyocytes. They showed that exogenous GHMT expression in non-cardiomyocyte in the infarcted heart reduces fibrosis and improves cardiac function in vivo [5].
Notably, it appears that the efficiency of transdifferentiation is greater in vivo than in vitro, indicating that the native environment of the heart is a more permissive environment than the plastic tissue culture dishes for functional reprogramming [5]. In this study, the obtained RNA was isolated from the uninfected cardiac fibroblasts as well as, cardiac fibroblasts transduced for 2 or 4 weeks with either an empty vector or a GHMT retrovirus and cardiomyocytes from adult mice. Microarray analysis was performed on the platform of Illumina Mouse-6 Beadchip and analysed using GeneSpring GX software (Agilent) [5].
Data from this study was deposited in GEO with the accession number GSE37057. The CEL files were downloaded from there and were submitted to background correction, normalization and summarization of gene expression (rma), through a package present in “R” called affy.
2.1.9. HIPSC DIFFERENTIATION TOWARD CARDIOMYOCYTES
Besides direct conversion from other types of differentiated cells, differentiation of hESc/iPSc could be a promising cell source of cardiomyocytes in cardiac regenerative medicine [3]. Uosaki and colleagues differentiated hiPSc towards cardiomyocytes applying
Data from this study was deposited in GEO with the accession number GSE28191. The CEL files were downloaded from there and were submitted to background correction, normalization and summarization of gene expression (rma), through a package present in “R” called affy. For my study, 33010 genes were included that were annotated.
2.2. GENE EXPRESSION ANALYSIS
In the next sub-chapters it will be addressed the main computational algorithms and approaches that I applied for the data analysis including, the comparison and clustering of temporal gene profiles. Most of the computational analysis was performed in R which is a programming environment with favourable numerical capability, flexible visualization and a wide range of statistical and mathematical algorithms. Notably, R is gaining a widespread usage within the computational biology and bioinformatics, and is the basis for the Bioconductor platforms which provides many add-on packages for microarray data analysis and toolset to work with [27].
Examples for the infrastructure concepts could be the ExprsSet class from the Biobase package. The fundamental object for gene expression analysis in R/Bioconductor is the ExprsSet, which is a data structure binding together array-based expression measurements with information about the samples [27]. Important Bioconductor package used for my work are Affy and Limma, which are outlined below [27].
2.2.1. PREPROCESSING OF MICROARRAY DATA
Before analysing expression changes of genes, the microarray data need to be pre-processed. This includes performing background correction, normalization, pm correction and summarization. Figure 2.2.1.1 presents an overview of these steps which were carried out using the Affy package in this study. For Affymetrix experiments, CEL files that contain probe intensities derived from the scan of the GeneChip. CEL data is a very simple structure, storing all probe intensities from the chip. Information about the probe identity, location of each probe and very limited sequence data is stored in the .cdf object generated by the program.
As there is always some amount of background noise in every scanned image, so this background correction function will check the distribution of probe intensities and this will be used to estimate overall background noise level and adjust it.
Figure 2.2.1.1. Simple steps from CEL files to expression set. It starts with an affybatch file, it is submitted to a background correction, normalization, pm correction and summarization and finally is turned in to an expression set (adapted from Gautier et al., 2003 [28]).
Normalization is required because no step in the hybridization process is perfectly controlled, so the quantity of RNA in a sample varies slightly from chip to chip. Normalization procedures attempt to detect and correct systematic differences between chips, so data from different chips can be directly compared [28].
Pm correction (perfect match correction) is for mismatch probes that exist in Affymetrix GeneChips to quantify non-specific and cross-hybridization. This mismatch probes are used to correct perfect match probes. As each transcript is targeted on the GeneChip by multiple probes, a final step is the summarization over different probes associated with a gene one or more probe sets.
2.2.2. DETECTION OF DIFFERENTIAL EXPRESSION
To detect differential expression, a linear model approach was applied using the Limma package. This method requires construction of two types of matrices: (i) the first one is the design matrix which associates the RNA samples with the array, and (ii) the contrast matrix that specifies which are the comparisons that the user would like to make between the RNA samples [29]. For statistical analysis and assessing differential expression, limma uses an empirical Bayes method to moderate the standard errors of the estimated fold changes [29].
2.2.3. CLUSTERING OF GENE EXPRESSION DATA
Cluster 3.0 is a program that provides a computational environment for analysing data from DNA microarray experiments and other genomic data sets. This program can only read tab-limited (.txt files) in a particular format. After data input, it is submitted to a set of filters that allows the treatment of the data, such as, removing all genes that have missing values in at least one condition of the experiment.
Posteriorly it was performed a hierarchical clustering, which organizes genes in a hierarchical structure based on their expression pattern. It was used Single Linkage Clustering, in which the distances between two items x and y is minimum of all pair wise distances between items contained in x and y. This kind of hierarchical clustering can be used to cluster large sets of gene expression [30].
Output files are opened with Java treeview, a program that can provide a graphical environment for analysing data from microarrays experiments and other types of data sets [31]. This program allows an interactive graphical analysis of the results from the Cluster 3.0, reading the output files.
2.2.4. FUNCTIONAL ENRICHMENT ANALYSIS
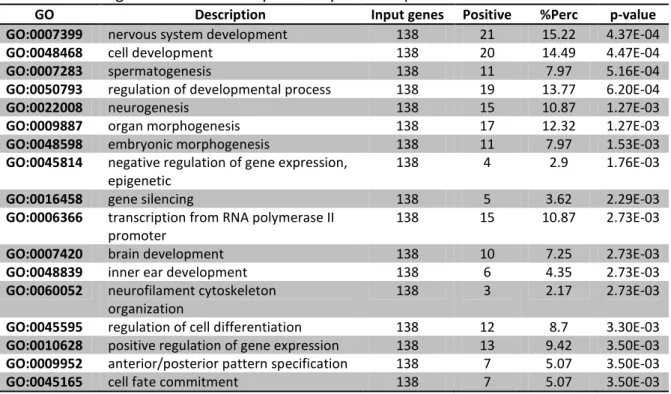
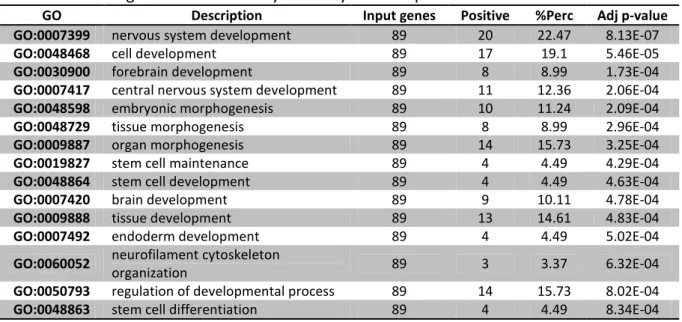
To detect whether differential genes tend to be associated with a particular processes, functional enrichment analysis was performed. Here, the statistical significance is calculated based on the observed number of genes associated with the same process among the total set of differentially expressed genes. Moreover, biological processes, molecular function and cellular components can be tested based on the annotation in Gene Ontology (GO), which organizes genes into categories for a number of different organisms [32]. The statistical evaluation was performed using R as well as using the FatiGo tool from the Babelomics (http://babelomics.bioinfo.cipf.es/) website [33].
FatiGO is a simple and powerful tool to extract relevant GO terms for a list of genes with respect to a set of genes of reference (usually the rest of the genome). This program uses the most widely accepted ontologies in GO, which organizes information for molecular function, biological processes and cellular components for a number of different organisms
biological functions; list of positive hits, which means the number of genes that participate in the biological functions; adjusted p-value, is ordered by increasing value, facilitating the selection of GO terms with the most significance for the experience [32].The FatiGO program present in Babelomics website was used for the studies presented in sub-chapters 3.1 and 3.3.3.For the comparison of biological processes, molecular functions and KEGG pathways between cardiac data sets and mESc (sub-chapter 3.4), all 3 gene ontology processes were analysed through R, which facilitates comparison and systematic inspection of the results.
2.3. HEART EXPRESSION
This study was made to understand which genes could be linked between the different data set analysed, so it was compared several genes associated to heart development and morphogenesis, after the choice of certain parameters for each stage of development (early, intermediate and late) present in table 2.3.1. It was not possible to choose from Song data set [5] and Ieda data set [4] the early and intermediate stage, since this two data sets do not have time course gene expression.
Table 2.3.1. Heart expression analysis parameters. (Description of parameters: Song et al., 2012 – ACFGHMT – Adult Cardiac Fibroblast transdifferentiated with transcription factors Gata4, Hand2, Mef2c and Tbx5; Ieda et al., 2010 – 2WiCM – 2Weeks induced Cardiomyocytes, 4WiCM – 4Weeks induced Cardiomyocytes.)
Authors Abbreviation Parameter Stage
Song et al.,2012 CF into iCM ACFGHMT Late
Ieda et al., 2010 Rep into iCM 2WiCM, 4WiCM Late
Hideki et al., 2011 iPSc into iCM
Day 0 Early
Day 2, Day5 Intermediate
Day 7, Day 9 Late
Gaspar et al., 2012 mESCDiff
Day 0, Day 1 Early
Day 3, Day 4 Intermediate
Day 6, Day 7 Late
Genes of these data sets have been compared between themselves for the early, intermediate and late stage. The log fold change chosen for this analysis has a cut-off of 0.5 log fold change expression (these values were obtained through “limma”).
For comparison, all genes were mapped with mouse EntrezGene Ids. It was recorded which genes are present in each data set and which genes are overlapping in the different combinations of these data sets.
It was created a web based program (HeartExpress: http://heartexpress.sysbiolab.eu/) [34] that provides researchers a direct access to the collected data and enables independent investigations. Heart Express allows to explore a genome-wide expression data for heart development and morphogenesis.
2.4. NETWORK ANALYSIS
For the analysis of networks, the Cytoscape software was utilized [35]. This software can generally be used for analysing protein-protein, protein-DNA and genetic interactions that are increasingly available for different model organisms [36]. Cytoscape has the purpose of modelling and integrate biomolecular interaction networks and states [36]. Cytoscape core handles basic features such as network layout and mapping of data attributes to visual displays properties. Dynamic states on molecules and molecular interactions are handled as attributes on node and edges, whereas static hierarchical data, such as, protein functional ontologies are supported by use of annotations [36]. Besides the graphical image presented by Cytoscape, there are other functionalities that allow the user to modulate the network (figure 2.5.1.).
Figure 2.4.1. A simplified schematic overview of the Cytoscape functionality. Besides the Cytoscape main window, which gives graphical presentation of interactions of the genes, the other functionalities allow the user to modulate the results, according to what is needed. (Schematic adapted from Shannon et al., 2012 [36]).
This tool was used to visualize the sets of the identified genes with early, intermediate and late expression during cardiomyogenesis within a network context and understand their behaviour. First, a large molecular interaction network was generated. This large network was examined for smaller sub-networks that could be of interest for this purpose of the study. This approach helped to identify other key players that have not been considered to be involved in heart development to date.