with the Extent of Coronary Artery Disease
Peter R. Sinnaeve1,3*, Mark P. Donahue1, Peter Grass2, David Seo1, Jacky Vonderscher2, Salah-Dine Chibout2, William E. Kraus1, Michael Sketch, Jr.1, Charlotte Nelson1, Geoffrey S. Ginsburg1, Pascal J.
Goldschmidt-Clermont1, Christopher B. Granger1
1Duke University Medical Center and Duke Clinical Research Institute, Duke University, Durham, North Carolina, United States of America,2Novartis Institute for Biomedical Research, Cambridge, Boston, United States of America,3UZ Leuven Gasthuisberg, University of Leuven, Leuven, Belgium
Abstract
Systemic and local inflammation plays a prominent role in the pathogenesis of atherosclerotic coronary artery disease, but the relationship of whole blood gene expression changes with coronary disease remains unclear. We have investigated whether gene expression patterns in peripheral blood correlate with the severity of coronary disease and whether these patterns correlate with the extent of atherosclerosis in the vascular wall.
Patients were selected according to their coronary artery disease index (CADi), a validated angiographical measure of the extent of coronary atherosclerosis that correlates with outcome. RNA was extracted from blood of 120 patients with at least a stenosis greater than 50% (CADi$23) and from 121 controls without evidence of coronary stenosis (CADi = 0).
160 individual genes were found to correlate with CADi (rho.0.2,P,0.003). Prominent differential expression was observed especially in genes involved in cell growth, apoptosis and inflammation. Using these 160 genes, a partial least squares multivariate regression model resulted in a highly predictive model (r2= 0.776,P
,0.0001). The expression pattern of these 160 genes in aortic tissue also predicted the severity of atherosclerosis in human aortas, showing that peripheral blood gene expression associated with coronary atherosclerosis mirrors gene expression changes in atherosclerotic arteries.
In conclusion, the simultaneous expression pattern of 160 genes in whole blood correlates with the severity of coronary artery disease and mirrors expression changes in the atherosclerotic vascular wall.
Citation:Sinnaeve PR, Donahue MP, Grass P, Seo D, Vonderscher J, et al. (2009) Gene Expression Patterns in Peripheral Blood Correlate with the Extent of Coronary Artery Disease. PLoS ONE 4(9): e7037. doi:10.1371/journal.pone.0007037
Editor:Pieter H. Reitsma, Leiden University Medical Center, Netherlands
ReceivedSeptember 22, 2008;AcceptedAugust 9, 2009;PublishedSeptember 14, 2009
Copyright:ß2009 Sinnaeve et al. This is an open-access article distributed under the terms of the Creative Commons Attribution License, which permits unrestricted use, distribution, and reproduction in any medium, provided the original author and source are credited.
Funding:The study was funded by Novartis. Drs Grass, Chibout and Vonderscher are full-time employees of Novartis, and participated in the study design and data collection and analysis, but had no influence in the decision to publish.
Competing Interests:Drs Grass, Chibout and Vonderscher are full-time employees of Novartis.
* E-mail: peter.sinnaeve@uzleuven.be
Introduction
Coronary artery disease, a multifactorial chronic disease, is the leading cause of death in Western countries. Despite considerable advances in the prevention and treatment of coronary artery disease and its complications, morbidity and mortality remains high. In half of patients with coronary artery disease, the first manifestation is death [1]. Consequently, substantial efforts are being put into the development of new strategies for accurate noninvasive diagnosis of coronary artery disease and the identification of novel treatment targets [2].
Systemic and local inflammation has been shown to play a prominent pathologic role in atherosclerotic coronary artery disease [3]. Adhesion of leukocytes to activated endothelial cells and their migration into the arterial wall are thought to initiate, propagate, and destabilize coronary plaques. All types of blood constituents appear to play a role in plaque formation, although the majority of inflammatory lesions in atherosclerotic vascular tissue consist of foam cell macrophages and activated T-cells [4]. Several studies have found distinct gene expression patterns in atherosclerotic arteries [5–8]. While other pathways are likely also important, a consistent feature has been differential expression of
inflammatory genes and genes involved in cell cycle control [9–12].
Methods
Patient Selection and Characteristics
Patients and control subjects were recruited from individuals that had undergone catheterization in the Duke University Hospital Cardiac Catheterization Laboratory and participated in a proteomics study to discover candidate proteins that are differentially displayed in populations with and those without angiographic coronary artery disease [16]. After being approached and providing informed written consent, subjects had clinical and laboratory data collected. The investigation conforms to the principles outlined in the Declaration of Helsinki, and was approved by the Duke Institutional Review Board.
Patient selection, design and results from the main proteomics study have been reported previously [16]. Populations were initially defined in order to minimize differences in plasma proteins unrelated to the presence or absence of coronary artery disease. As a practical strategy, three different cohorts of subjects (cases and controls) were enrolled: 1) matched men(n = 106),
who were matched for age and ethnic group, 2) unmatched men (n = 82), who did not fulfill the matching criteria and 3) unmatched women (n = 53). The severity of coronary artery
disease was scored using the Duke Coronary Artery Disease Index (CAD-Index) [17,18]. The CAD-index is a prognostic assessment of the extent of coronary artery disease, accounting for the number and severity of lesions and diseased vessels and involvement of left anterior descending and left main disease.
Inclusion criteria for the coronary artery disease patient population (cases) were: age between 40 and 65 and coronary artery stenosis of .50% in at least one major coronary artery. Inclusion criteria for the control population (controls) were: age between 40 and 65 for matched men cohort only, no angiographically detectable coronary artery stenosis on cardiac catheterization within the last two years, normal left ventricular ejection fraction and normal regional wall motion. Exclusion criteria for controls were typical signs of angina, or any history or evidence of myocardial ischemia on stress testing, myocardial infarction or unstable angina, any history of peripheral arterial or cerebrovascular disease, or significant vascular stenosis on noninvasive imaging or angiography. Exclusion criteria also included myocardial infarction within one month (for cases), diabetes, uncontrolled hypertension (systolic blood pressure
.180 mmHg or diastolic blood pressure .100 mmHg) or with end-organ damage, renal insufficiency (creatinine.2.0 mg/dL or BUN.40 mg/dL), active malignancy, significant valvular heart disease, NYHA Class III or IV heart failure, cigarette smoking.2 packs per day, total cholesterol .300 mg/dL or triglyceride
.400 mg/dL, anemia (hemoglobin ,12.5 g/dL for females or
,13.5 g/dL for males), and hypotension (systolic blood pressure
,90 mmHg and diastolic blood pressure,50 mmHg).
Blood Sampling and Gene Expression Analysis
The blood samples (2.5 mL) were collected in PAXgeneTM Blood RNA tubes and total RNA was isolated using the standardized RNA Kit (PreAnalytiX, Qiagen) [19]. RNA isolation started with a centrifugation step to pellet nucleic acids in the PAXgene Blood RNA Tube. The pellet was then washed, and Proteinase K added to digest proteins. Alcohol was added to adjust binding conditions, and the sample was applied to a PAXgene RNA spin column. During a brief centrifugation, RNA selectively bound to the PAXgene silica-gel membrane and eluted using an optimized buffer.
RNA was then quantified by absorbance at A260 nm and the purity was estimated by the ratio A260 nm/A280 nm. RNA
integrity was confirmed by non-denaturing agarose gel electro-phoresis. RNA was stored at280uC until further analysis. The quality of 19 RNA samples was insufficient for microarray analysis due to degradation. The genomic studies were conducted in the Novartis Genomics Factory, Basel, Switzerland.
Genome-wide transcript profiling was assessed using human HGU133A oligonucleotide expression probe arrays (Affymetrix, Santa Clara, CA, U.S.A.), comprising 22,483 probe sets. The experiments were done according to the recommendations of the manufacturer [20]. Data was normalized using MAS5 (Affyme-trix); the data is publicly available at the Gene Expression Omnibus (GEO) repository (accession number GSE12288, http:/ www.ncbi.nlm.nih.gov/geo/query/acc.cgi?acc = GSE12288). As quality control, RT-PCR was performed on 8 selected genes in 2620 subjects from the ‘matched men’ cohort.
Independent Evaluation of Predictive Gene Model in Human Aorta Tissue
To test whether the expression pattern in peripheral whole blood is representative for atherosclerosis in general, we have examined the capability of expression of genes derived from the peripheral blood cell study to predict the severity of atherosclerosis in human aortas. Gene expression data was generated using RNA extracted from a unique collection of freshly harvested human aortas with varying degrees of atherosclerosis (n = 67 donors). Donor identification, RNA extraction and micro-array methods (Affymetrix U95Av2) as well as gene expression signatures that differentiate between atherosclerotic disease states in human aortas have been reported previously [8]. As indicated in the original report, disease extent (normal, intermediate, severe) was scored by combining Sudan IV staining and raised lesion data. The ‘‘normal’’ or minimally diseased group showed no Sudan IV staining and contained no raised lesions, while the ‘‘intermediate’’ group showed more than 20% Sudan IV staining but contained no raised lesions. The ‘‘severe’’ group contained raised lesions covering more than 10% of the surface. We identified 20 normal, 25 intermediate and 22 severely diseased sections for this analysis.
Statistical Methods
Spearman rank correlation between CAD-index and gene expression was calculated (Partek Genomics Suite Version 6.3). An absolute correlation coefficient (rho) .0.2 was considered clinically relevant, corresponding to a p-value of 0.003 (n = 222). Among the 22,483 probe sets of the Affymetrix HGU133A chip, about 60 probe sets can be expected to have an absolute rho.0.2 by chance (false positives). Student’s t test, parametric correlation and rank correlation according to Spearman were performed with the statistical software package S-Plus Version 6.
Projections to Latent Structures (PLS) analysis including Orthog-onal Signal Correction (OSC) (SIMCA-P Version 10.0) was used to identify gene sets that discriminate between increasing CAD-indices or the three classes (normal, intermediate and severe) of atheroscle-rosis in the aorta samples. To reduce gene selection bias, models were subsequently repeatedly built based on data from two cohorts to predict CAD in the third cohort. In addition, extensive cross-validation by leave-one-out technique and cross-validation by response permutation was applied to 7 groups of approximately 32 subjects to reduce bias in creating a predictive gene set.
Results
Patient Demographics
was significantly more common in the cases. Aspirin, statins, and blood pressure lowering agents were more frequently taken by the cases. All controls had no angiographically significant coronary artery disease (CAD-Index = 0). Within the cases, however, there was a wide distribution, with 81% of cases having a CAD-Index between 25 and 63. Although most cases (93%) had at least two-vessel disease or severe single-two-vessel disease, the distribution of cases is skewed towards the lower end of CAD-Index.
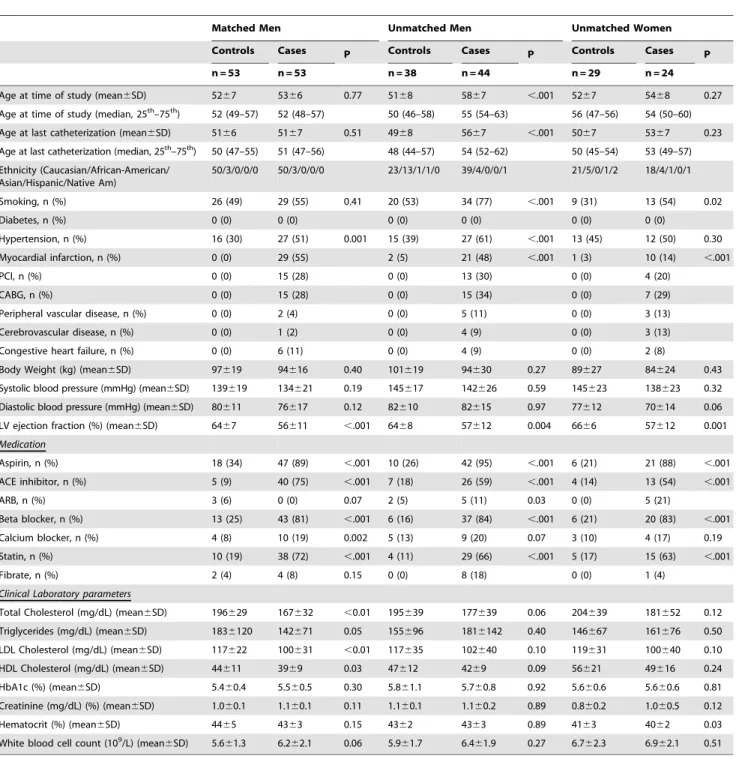
Clinical laboratory parameters were available for all subjects (table 1). Hematocrit and white blood cell counts were not significantly different. Total cholesterol and LDL-cholesterol levels
were significantly lower in the coronary artery disease group, probably reflecting a higher use of statins.
Prediction of Coronary Disease Using Risk Factors and Biochemical Markers
Traditional risk factors, including body weight, smoking, and systolic and diastolic blood pressure did not correlate significantly with the extent of coronary disease in a rank correlation analysis. Total cholesterol (but not LDL-cholesterol) level was found to be inversely related with the CAD-index (rho =20.41, P,0.0001), which may in part reflect the higher use of statins and better blood
Table 1.Demographics and baseline characteristics.
Matched Men Unmatched Men Unmatched Women
Controls Cases P Controls Cases P Controls Cases P
n = 53 n = 53 n = 38 n = 44 n = 29 n = 24
Age at time of study (mean6SD) 5267 5366 0.77 5168 5867 ,.001 5267 5468 0.27
Age at time of study (median, 25th–75th) 52 (49–57) 52 (48–57) 50 (46–58) 55 (54–63) 56 (47–56) 54 (50–60)
Age at last catheterization (mean6SD) 5166 5167 0.51 4968 5667 ,.001 5067 5367 0.23
Age at last catheterization (median, 25th–75th) 50 (47–55) 51 (47–56) 48 (44–57) 54 (52–62) 50 (45–54) 53 (49–57)
Ethnicity (Caucasian/African-American/ Asian/Hispanic/Native Am)
50/3/0/0/0 50/3/0/0/0 23/13/1/1/0 39/4/0/0/1 21/5/0/1/2 18/4/1/0/1
Smoking, n (%) 26 (49) 29 (55) 0.41 20 (53) 34 (77) ,.001 9 (31) 13 (54) 0.02
Diabetes, n (%) 0 (0) 0 (0) 0 (0) 0 (0) 0 (0) 0 (0)
Hypertension, n (%) 16 (30) 27 (51) 0.001 15 (39) 27 (61) ,.001 13 (45) 12 (50) 0.30
Myocardial infarction, n (%) 0 (0) 29 (55) 2 (5) 21 (48) ,.001 1 (3) 10 (14) ,.001
PCI, n (%) 0 (0) 15 (28) 0 (0) 13 (30) 0 (0) 4 (20)
CABG, n (%) 0 (0) 15 (28) 0 (0) 15 (34) 0 (0) 7 (29)
Peripheral vascular disease, n (%) 0 (0) 2 (4) 0 (0) 5 (11) 0 (0) 3 (13)
Cerebrovascular disease, n (%) 0 (0) 1 (2) 0 (0) 4 (9) 0 (0) 3 (13)
Congestive heart failure, n (%) 0 (0) 6 (11) 0 (0) 4 (9) 0 (0) 2 (8)
Body Weight (kg) (mean6SD) 97619 94616 0.40 101619 94630 0.27 89627 84624 0.43
Systolic blood pressure (mmHg) (mean6SD) 139619 134621 0.19 145617 142626 0.59 145623 138623 0.32
Diastolic blood pressure (mmHg) (mean6SD) 80611 76617 0.12 82610 82615 0.97 77612 70614 0.06
LV ejection fraction (%) (mean6SD) 6467 56611 ,.001 6468 57612 0.004 6666 57612 0.001
Medication
Aspirin, n (%) 18 (34) 47 (89) ,.001 10 (26) 42 (95) ,.001 6 (21) 21 (88) ,.001
ACE inhibitor, n (%) 5 (9) 40 (75) ,.001 7 (18) 26 (59) ,.001 4 (14) 13 (54) ,.001
ARB, n (%) 3 (6) 0 (0) 0.07 2 (5) 5 (11) 0.03 0 (0) 5 (21)
Beta blocker, n (%) 13 (25) 43 (81) ,.001 6 (16) 37 (84) ,.001 6 (21) 20 (83) ,.001
Calcium blocker, n (%) 4 (8) 10 (19) 0.002 5 (13) 9 (20) 0.07 3 (10) 4 (17) 0.19
Statin, n (%) 10 (19) 38 (72) ,.001 4 (11) 29 (66) ,.001 5 (17) 15 (63) ,.001
Fibrate, n (%) 2 (4) 4 (8) 0.15 0 (0) 8 (18) 0 (0) 1 (4)
Clinical Laboratory parameters
Total Cholesterol (mg/dL) (mean6SD) 196629 167632 ,0.01 195639 177639 0.06 204639 181652 0.12
Triglycerides (mg/dL) (mean6SD) 1836120 142671 0.05 155696 1816142 0.40 146667 161676 0.50
LDL Cholesterol (mg/dL) (mean6SD) 117622 100631 ,0.01 117635 102640 0.10 119631 100640 0.10
HDL Cholesterol (mg/dL) (mean6SD) 44611 3969 0.03 47612 4269 0.09 56621 49616 0.24
HbA1c (%) (mean6SD) 5.460.4 5.560.5 0.30 5.861.1 5.760.8 0.92 5.660.6 5.660.6 0.81
Creatinine (mg/dL) (%) (mean6SD) 1.060.1 1.160.1 0.11 1.160.1 1.160.2 0.89 0.860.2 1.060.5 0.12
Hematocrit (%) (mean6SD) 4465 4363 0.15 4362 4363 0.89 4163 4062 0.03
White blood cell count (109/L) (mean6SD) 5.661.3 6.262.1 0.06 5.961.7 6.461.9 0.27 6.762.3 6.962.1 0.51
lipid control in cases. In addition, other parameters were found to positively (potassium, blood urea nitrogen, phosphorus and osmolarity) or negatively (calcium and HDL-cholesterol) correlate with CAD-index (rho.0.2). Of note, important clinical markers such as LDL-C (rho = 0.02), CRP (rho =20.12) and homocysteine (rho = 0.02) exhibited a poor correlation with CAD-index, which could result from treatment of affected individuals. In a multivariate correlation analysis, the combination of risk factors and biochemical markers only poorly predicted the extent of coronary artery disease (r2= 0.228).
Gene Expression
Gene expression data from 222 out of 241 subjects were available for this analysis (110/121 cases and 112/120 controls); RNA from the remaining 19 subjects did not pass quality control due to degradation.
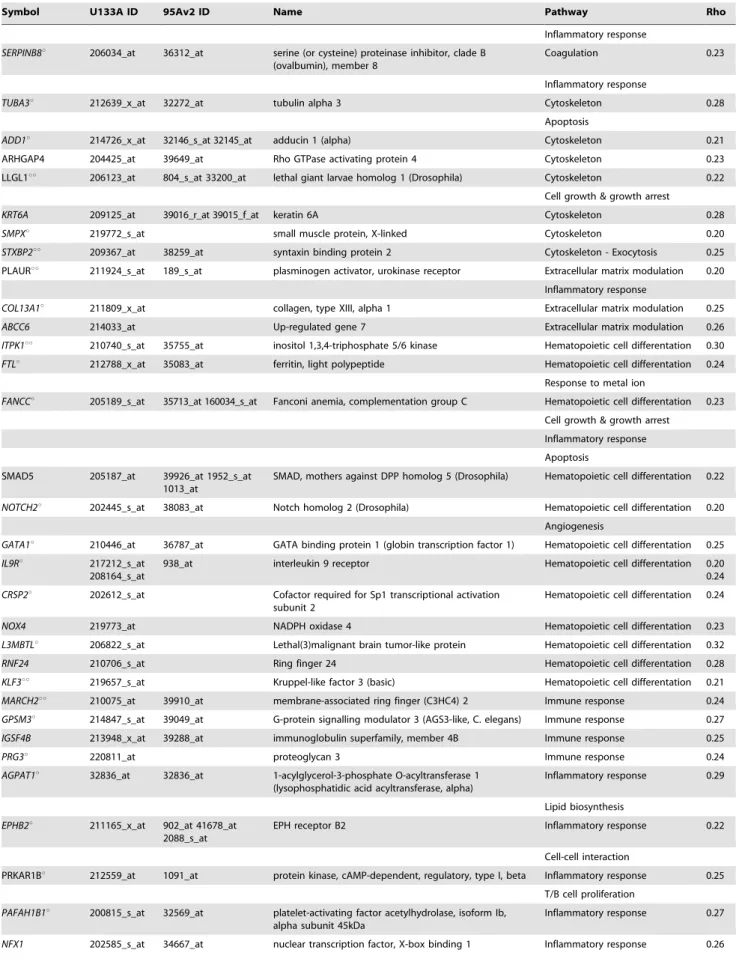
In a univariate analysis, 160 genes were found to correlate with CAD-Index with an absolute rank correlation coefficient (rho)
.0.2 (P,0.003). All probesets correlating with CAD-Index are listed in table 2. Most of these genes are known to be involved in hematopoietic cell differentiation, cell growth or growth arrest, apoptosis, cell adhesion, matrix modulation and inflammatory and immune response, processes known to modulate atherosclerosis.
Using log-transformed data with signal intensities.80, only 19 probesets were found to be significantly differentially expressed in a multiway ANOVA (smoking, age, gender, cohort, race, CAD (i.e. case vs. control) and CAD-index as fixed factors or random effects, respectively) (table 2). However, when only taking the 20 controls with the least predicted CAD versus the 20 cases with the most predicted disease into account, a formal comparison yielded 90 out of the 160 probesets with statistically significant differential expression (p,0.05, no adjustment for multiple comparisons) (table 2). rt-PCR confirmed the Affymetrix results for 7 of the 8 genes tested in 20 cases and 20 controls (FKBP8, ITPK1, MARCH2, PNPLA2, TUBA3, UBXD1, FTL); the remaining gene (PINK1) did not show a significantly different expression on rt-PCR.
Correlation of Gene Expression Profile with Coronary Disease
All 160 genes with rho.0.2 were included in the PLS analysis, with CAD-Index as the only response variable. Polynomial regression analysis of the resulting t1-scores versus CAD-Index resulted in the prediction model including 95% confidence range of the regression and the 95% prediction interval with r2= 0.764 (p,0.001) (figure 1). Predictive accuracy was found to be excellent in the overall population (RMSEE (root mean square error of estimation) = 0.323), but improved with increasing threshold of CAD (RMSEE = 0.249 for controls vs cases with CAD.40; RMSEE = 0.204 for controls vs cases with CAD.60 and RMSEE = 0.172 for controls vs cases with CAD.70).
In order to test for robustness of the model, the PLS analysis was performed separately for each of the three cohorts, with the model repeatedly constructed using two cohorts (training sample) and tested in the third cohort (test sample). While the controls remain quite stable in the range of -2 standard deviations, the t1-scores of the cases were located mainly in the+2 standard deviation range and increase with increasing CAD-Index (figure 2). This relationship is clearly present in each cohort. Cross-validation of the model was also performed by dividing the data into 7 groups of on average 32 subjects and then developing a number of parallel models from reduced data with one of the groups deleted. The omitted group was then used as a test data set, and the differences between actual and predicted CAD-Indices were subsequently
calculated for these data points. The reduced models validation demonstrated a Q2cum of 0.776, indicating an excellent predictive ability.
A Variable Importance in the Projection (VIP) of each gene for the separate PLS analyses of the three cohorts compared to the PLS analysis including all subjects was calculated. The VIP of the first 24 genes shows only little variation between the three cohorts suggesting a rather high stability of the prediction model (figure 3). A set of eight genes appears to have the highest impact on the model (FTL, FKBP8, TUBA3, PNPLA2, UBXD1, MARCH2, ITPK1,PINK1, in order of contribution; listed in bold in table 2). A PLS analysis only involving these eight highest ranking genes in the VIP analysis showed that the expressions profiles of these eight genes are also able to predict the CAD-Index (r2= 0.752). Adding traditional risk factors and biochemical markers do not signifi-cantly improve this model (r2= 0.782).
Test of Predictability in Human Aorta Tissue Samples Since the genes whose expression contributes to prediction of CAD were studied within circulating leukocytes, we sought to define whether they actually reflect a molecular process that is ongoing within atherosclerotic arteries or not. Furthermore, as a test of reproducibility of the contribution of these 160 genes to predicting atherosclerotic disorders, we have investigated whether the in situ expression pattern of our 160 genes derived from peripheral blood could also adequately predict the severity of aorta atherosclerotic lesions. To achieve this goal, we have used gene expression data extracted from a large set of human aortas obtained from heart donors (n = 67), an independent human model of atherosclerosis. Excluding genes that are not present on the microarray used in the aorta expression study, the expression pattern of the remaining genes accurately separated the aorta samples according to the severity of atherosclerosis (figure 4). These results indicate that gene expression changes in peripheral blood are correlated with the extent of coronary atherosclerosis reflect similar pathophysiological changes in atherosclerotic arteries.
Discussion
In this large-scale expression analysis of peripheral whole blood cells, we have found 160 genes whose expression correlates with the severity of angiographically documented coronary artery atherosclerosis. Taking into account that the CAD-Index is a semi-quantitative estimate of the extent of coronary atherosclerotic disease, which implies variation across subjects even with the same degree of disease, the prediction based on expression pattern of these genes is robust. Our findings are also robust as assessed by internal validation and consistency across three distinct subgroups. Importantly, the in situ expression pattern of the 160 genes derived from the peripheral blood analysis was also predictive of the severity of atherosclerosis in human aorta tissue. This provides validation of the association of this set of genes with atherosclerosis and support for the concept that peripheral blood gene expression reflects pathophysiology in the vascular wall. Taken together, the molecular signature in peripheral blood for varying degrees of coronary artery disease is remarkably consistent with that seen in the atherosclerotic arterial wall, providing valuable new informa-tion of the pathways and their genes that are involved in the atherosclerotic process.
C-Table 2.List of 160-gene model predictive of the extent of coronary artery disease.
Symbol U133A ID 95Av2 ID Name Pathway Rho
AIF1 207823_s_at 37011_at 33641_g_at allograft inflammatory factor 1 Angiogenesis 0.21
3640_at 37764_at Inflammatory response
MMP19u 204575_s_at matrix metalloproteinase 19 Angiogenesis 0.22
Response to metal ion
Extracellular matrix modulation
EPIM 207346_at epimorphin Angiogenesis 0.22
MMP24uu 78047_s_at Matrix metalloproteinase 24 (membrane-inserted) Angiogenesis 0.20
Response to metal ion
Extracellular matrix modulation
CRADDu 209833_at 822_s_at 1211_s_at CASP2 and RIPK1 domain containing adaptor with death domain
Apoptosis 0.25
WDR13u 222138_s_at 727_at WD repeat domain 13 Apoptosis 0.24
PDE4D 210837_s_at 38526_at phosphodiesterase 4D, cAMP-specific (phosphodie-sterase E3 dunce homolog, Drosophila)
Apoptosis 0.22
AK2uu 212174_at 40789_at 40788_at adenylate kinase 2 Apoptosis 0.28
FOLH1u 217487_x_at 1740_g_at 1739_at 1655_s_at
folate hydrolase (prostate-specific membrane antigen) 1 Apoptosis 0.22
TGM5 207911_s_at 33001_s_at transglutaminase 5 Apoptosis 0.24
P53AIP1u 220403_s_at p53-regulated apoptosis-inducing protein 1 Apoptosis 0.25
NALP1 211822_s_at NACHT, leucine rich repeat and PYD (pyrin domain) containing 1
Apoptosis 0.26
Inflammatory response
LGALS9u 203236_s_at 766_at 38091_at galectin 9 Cell adhesion 0.25
ICAM1u 202637_s_at 32640_at intercellular adhesion molecule 1 (CD54), human rhinovirus receptor
Cell adhesion 0.21
PCDHGC3 205717_x_at 657_at 35609_at 1691_at 1690_at 1169_at
protocadherin gamma subfamily C, 3 Cell adhesion 0.20
GPLD1 206265_s_at 934_at 1293_s_at glycosylphosphatidylinositol specific phospholipase D1 Cell adhesion 0.21
T/B cell proliferation
CDH11u 207173_x_at 36976_at 2087_s_at cadherin 11, type 2, OB-cadherin (osteoblast) Cell adhesion 0.24
DSC3 206032_at 32417_at desmocollin 3 Cell adhesion 0.20
Cytoskeleton
LAMB3u 209270_at 36929_at laminin, beta 3 Cell adhesion 0.25
PKP4 214874_at 33475_at plakophilin 4 Cell adhesion 0.22
Cytoskeleton
FN1 214702_at Fibronectin 1 Cell adhesion 0.21
IIp45u 48659_at IGFBP-2-Binding Protein, IIp45 (FLJ12438) Cell adhesion 0.22
PINK1uu 209018_s_at 35361_at PTEN induced putative kinase 1 Cell growth & growth arrest 0.22
Apoptosis
FKBP8uu 40850_at 40850_at FK506 binding protein 8, 38kDa Cell growth & growth arrest 0.25
UBXD1uu 220757_s_at UBX domain-containing protein 1 Cell growth & growth arrest 0.21
RXRAu 202426_s_at 405_at 32800_at retinoid X receptor, alpha Cell growth & growth arrest 0.24
Apoptosis
RIS1u 213338_at 35692_at Ras-induced senescence 1 Cell growth & growth arrest 0.28
NFYCu 202215_s_at 40466_at nuclear transcription factor Y, gamma Cell growth & growth arrest 0.30
CLN3 209275_s_at 497_at ceroid-lipofuscinosis, neuronal 3, juvenile (Batten, Spielmeyer-Vogt disease)
Cell growth & growth arrest 0.27
Apoptosis
RARA 211605_s_at 1337_s_at retinoic acid receptor, alpha Cell growth & growth arrest 0.26
HCFC1 202473_x_at 37910_at host cell factor C1 (VP16-accessory protein) Cell growth & growth arrest 0.23
Symbol U133A ID 95Av2 ID Name Pathway Rho
STAU2u 204226_at 38341_at 32386_at staufen, RNA binding protein, homolog 2 (Drosophila) Cell growth & growth arrest 0.26
ELAVL2 208427_s_at 36411_s_at 36410 _f_at
ELAV (embryonic lethal, abnormal vision, Drosophila)-like 2 (Hu antigen B)
Cell growth & growth arrest 0.25
TP53I11u 214667_s_at 36136_at tumor protein p53 inducible protein 11 Cell growth & growth arrest 0.31
NPR3 219789_at 34519_at natriuretic peptide receptor C/guanylate cyclase C (atrionatriuretic peptide receptor C)
Cell growth & growth arrest 0.21
Angiogenesis
PTP4A1u 200730_s_at 843_at 33413_at protein tyrosine phosphatase type IVA, member 1 Cell growth & growth arrest 0.27
STC2 203439_s_at 32043_at stanniocalcin 2 Cell growth & growth arrest 0.24
Response to metal ion
SEMA3C 203788_s_at 377_g_at 376_at sema domain, immunoglobulin domain (Ig), short basic domain, secreted, (semaphorin) 3C
Cell growth & growth arrest 0.28
Immune response
CCNA1 205899_at 1914_at cyclin A1 Cell growth & growth arrest 0.20
PTPRRu 206084_at 1658_g_at 1657_at protein tyrosine phosphatase, receptor type, R Cell growth & growth arrest 0.23
LHX2 206140_at 40528_at LIM homeobox 2 Cell growth & growth arrest 0.21
T/B cell proliferation
CPSF4 206688_s_at 35743_at cleavage and polyadenylation specific factor 4, 30kDa Cell growth & growth arrest 0.22
Inflammatory response
I–4u 207377_at 31735_at type 1 protein phosphatase inhibitor Cell growth & growth arrest 0.21
MEIS2 207480_s_at 41388_at Meis1, myeloid ecotropic viral integration site 1 homolog 2 (mouse)
Cell growth & growth arrest 0.20
NF2u 211092_s_at 38007_at 1894_f_at neurofibromin 2 (bilateral acoustic neuroma) Cell growth & growth arrest 0.23
Cytoskeleton
BRRN1u 212949_at 41639_at barren homolog (Drosophila) Cell growth & growth arrest 0.32
CDC42 214230_at 960_g_at 959_at 39736_at
cell division cycle 42 (GTP binding protein, 25kDa) Cell growth & growth arrest 0.23
ZMYND10u 216663_s_at 32993_s_at zinc finger, MYND domain containing 10 Cell growth & growth arrest 0.25
CROC4 222301_at 40483_at 40482_s_at transcriptional activator of the c-fos promoter Cell growth & growth arrest 0.22
PPP2R5Bu 635_s_at 635_s_at protein phosphatase 2, regulatory subunit B (B56), beta isoform
Cell growth & growth arrest 0.20
TRIM45u 219923_at tripartite motif-containing protein 45 Cell growth & growth arrest 0.23
TDRKH 221053_s_at tudor and KH domain containing Cell growth & growth arrest 0.26
PB1u 221212_x_at polybromo 1 Cell growth & growth arrest 0.25
NEIL1 219396_s_at nei endonuclease VIII-like 1 Cell growth & growth arrest 0.31
PMS2L5u 179_at Postmeiotic segregation increased 2-like 5 Cell growth & growth arrest 0.24
BLOC1S1u 202592_at Biogenesis of lysosome-related organelles complex-1, subunit 1
Cell growth & growth arrest 0.23
BRF2u 218955_at subunit of RNA polymerase III transcription initiation factor, BRF1-like
Cell growth & growth arrest 0.23
ASNA1uu 202024_at Arsenical pump-driving ATPase Cell growth & growth arrest 0.21
SIRT5uu 221010_s_at sirtuin (silent mating type information regulation 2 homolog) 5
Cell growth & growth arrest 0.21
HIST1H4G 208551_at histone 1, H4g Cell growth & growth arrest 0.27
SLD5 211767_at SLD5 homolog Cell growth & growth arrest 0.27
MAN2A2u 202032_s_at 41766_at 38188_s_at mannosidase, alpha, class 2A, member 2 Cell-cell interaction 0.28
GJB3u 215243_s_at 41076_at gap junction protein, beta 3, 31kDa (connexin 31) Cell-cell interaction 0.24
PLXNA2 207290_at 40395_at plexin A2 Cell-cell interaction 0.21
ADH1B 209613_s_at 35730_at alcohol dehydrogenase IB (class I), beta polypeptide Cellular metabolism 0.22
Immune response
FGA 205650_s_at 38825_at fibrinogen, A alpha polypeptide Coagulation 0.26
Cell adhesion
Symbol U133A ID 95Av2 ID Name Pathway Rho
Inflammatory response
SERPINB8u 206034_at 36312_at serine (or cysteine) proteinase inhibitor, clade B (ovalbumin), member 8
Coagulation 0.23
Inflammatory response
TUBA3u 212639_x_at 32272_at tubulin alpha 3 Cytoskeleton 0.28
Apoptosis
ADD1u 214726_x_at 32146_s_at 32145_at adducin 1 (alpha) Cytoskeleton 0.21
ARHGAP4 204425_at 39649_at Rho GTPase activating protein 4 Cytoskeleton 0.23
LLGL1uu 206123_at 804_s_at 33200_at lethal giant larvae homolog 1 (Drosophila) Cytoskeleton 0.22
Cell growth & growth arrest
KRT6A 209125_at 39016_r_at 39015_f_at keratin 6A Cytoskeleton 0.28
SMPXu 219772_s_at small muscle protein, X-linked Cytoskeleton 0.20
STXBP2uu 209367_at 38259_at syntaxin binding protein 2 Cytoskeleton - Exocytosis 0.25
PLAURuu 211924_s_at 189_s_at plasminogen activator, urokinase receptor Extracellular matrix modulation 0.20
Inflammatory response
COL13A1u 211809_x_at collagen, type XIII, alpha 1 Extracellular matrix modulation 0.25
ABCC6 214033_at Up-regulated gene 7 Extracellular matrix modulation 0.26
ITPK1uu 210740_s_at 35755_at inositol 1,3,4-triphosphate 5/6 kinase Hematopoietic cell differentation 0.30
FTLu 212788_x_at 35083_at ferritin, light polypeptide Hematopoietic cell differentation 0.24
Response to metal ion
FANCCu 205189_s_at 35713_at 160034_s_at Fanconi anemia, complementation group C Hematopoietic cell differentation 0.23
Cell growth & growth arrest
Inflammatory response
Apoptosis
SMAD5 205187_at 39926_at 1952_s_at 1013_at
SMAD, mothers against DPP homolog 5 (Drosophila) Hematopoietic cell differentation 0.22
NOTCH2u 202445_s_at 38083_at Notch homolog 2 (Drosophila) Hematopoietic cell differentation 0.20
Angiogenesis
GATA1u 210446_at 36787_at GATA binding protein 1 (globin transcription factor 1) Hematopoietic cell differentation 0.25
IL9Ru 217212_s_at 208164_s_at
938_at interleukin 9 receptor Hematopoietic cell differentation 0.20
0.24
CRSP2u 202612_s_at Cofactor required for Sp1 transcriptional activation subunit 2
Hematopoietic cell differentation 0.24
NOX4 219773_at NADPH oxidase 4 Hematopoietic cell differentation 0.23
L3MBTLu 206822_s_at Lethal(3)malignant brain tumor-like protein Hematopoietic cell differentation 0.32
RNF24 210706_s_at Ring finger 24 Hematopoietic cell differentation 0.28
KLF3uu 219657_s_at Kruppel-like factor 3 (basic) Hematopoietic cell differentation 0.21
MARCH2uu 210075_at 39910_at membrane-associated ring finger (C3HC4) 2 Immune response 0.24
GPSM3u 214847_s_at 39049_at G-protein signalling modulator 3 (AGS3-like, C. elegans) Immune response 0.27
IGSF4B 213948_x_at 39288_at immunoglobulin superfamily, member 4B Immune response 0.25
PRG3u 220811_at proteoglycan 3 Immune response 0.24
AGPAT1u 32836_at 32836_at 1-acylglycerol-3-phosphate O-acyltransferase 1 (lysophosphatidic acid acyltransferase, alpha)
Inflammatory response 0.29
Lipid biosynthesis
EPHB2u 211165_x_at 902_at 41678_at 2088_s_at
EPH receptor B2 Inflammatory response 0.22
Cell-cell interaction
PRKAR1Bu 212559_at 1091_at protein kinase, cAMP-dependent, regulatory, type I, beta Inflammatory response 0.25
T/B cell proliferation
PAFAH1B1u 200815_s_at 32569_at platelet-activating factor acetylhydrolase, isoform Ib, alpha subunit 45kDa
Inflammatory response 0.27
NFX1 202585_s_at 34667_at nuclear transcription factor, X-box binding 1 Inflammatory response 0.26
Symbol U133A ID 95Av2 ID Name Pathway Rho
KCNMB1uu 209948_at 38298_at potassium large conductance calcium-activated channel, subfamily M, beta member 1
Ion channel 0.22
CHRNA5 206533_at 36397_at cholinergic receptor, nicotinic, alpha polypeptide 5 Ion channel 0.21
Neurotransmission
SAHu 210377_at 33279_s_at 33278_at SA hypertension-associated homolog (rat) Lipid metabolism 0.30
HLCS 207833_s_at 37764_at holocarboxylase synthetase (biotin-[proprionyl-Coenzyme A-carboxylase (ATP-hydrolysing)] ligase)
Metabolic homeostasis 0.21
MAOA 204388_s_at 41772_at 41771_g_at 41770_at
monoamine oxidase A Neurotransmission 0.28
GABRA6u 207182_at 34025_at gamma-aminobutyric acid (GABA) A receptor, alpha 6 Neurotransmission 0.23
CEPBAuu 204039_at 32550_r_at CCAAT/enhancer binding protein (C/EBP), alpha Progenitor cell differentiation 0.35
Cell growth & growth arrest
SOX4u 201416_at 33131_at SRY (sex determining region Y)-box 4 Progenitor cell differentiation 0.20
ZNF305 206507_at 37083_s_at 37082_at zinc finger protein 305 Progenitor cell differentiation 0.21
ZNFN1A2u 220567_at zinc finger protein, subfamily 1A, 2 Progenitor cell differentiation 0.23
ZNF3u 219605_at zinc finger protein 3 (A8–51) Progenitor cell differentiation 0.22
Response to metal ion
Immune response
CAPN5u 205166_at 38504_at calpain 5 Response to injury 0.25
Cell growth & growth arrest
MTF1 205323_s_at 38945_at metal-regulatory transcription factor 1 Response to metal ion 0.25
CA12u 203963_at 36454_at carbonic anhydrase XII Response to metal ion 0.26
NEDD4Lu 212445_s_at 39356_at neural precursor cell expressed, developmentally down-regulated 4-like
Response to metal ion 0.22
CABIN1u 202624_s_at 37652_at calcineurin binding protein 1 T/B cell proliferation 0.21
SH3BP2u 209370_s_at 1303_at SH3-domain binding protein 2 T/B cell proliferation 0.23
Immune response
TNFRSF5 35150_at 35150_at 35149_at tumor necrosis factor receptor superfamily, member 5 T/B cell proliferation 0.22
Inflammatory response
Immune response
PBX2uu 211097_s_at 38295_at pre-B-cell leukemia transcription factor 2 T/B cell proliferation 0.25
IL2 207849_at interleukin 2 T/B cell proliferation 0.22
Cell growth & growth arrest
Immune response
HDAC5uu 202455_at histone deacetylase 5 T/B cell proliferation 0.28
Inflammatory response
PIPu 206509_at 41094_at 325_s_at prolactin-induced protein T/B cell regulation 0.23
GAD2u 216651_s_at 32280_at 32279_at glutamate decarboxylase 2 (pancreatic islets and brain, 65kDa)
T/B cell regulation 0.21
PNPLA2uu 39854_r_at 39854_r_at patatin-like phospholipase domain containing 2 Triglyceride homeostasis 0.24
MGLLu 211026_s_at 35792_at monoglyceride lipase Triglyceride homeostasis 0.27
MJD 216657_at 36819_at Machado-Joseph disease (spinocerebellar ataxia 3, olivo-pontocerebellar ataxia 3, autosomal dominant, ataxin 3)
Ubiquitination 0.2
FBXO31 219784_at F-box only protein 31 Ubiquitylation 0.26
GGA3u 211815_s_at 37959_at golgi associated, gamma adaptin ear containing, ARF binding protein 3
Ubiquitylation 0.26
N4BP1u 48612_at Nedd4 binding protein 1 Ubiquitylation 0.21
BC002942 31837_at 31837_at hypothetical protein BC002942 0.28
MGC21416u 212340_at 37891_a hypothetical protein MGC21416 0.27
DKFZp586F1822 37891_at DKFZp586F1822
CDRT1 215999_at 31781_at CMT1A duplicated region transcript 1 0.23
KIAA0241u 212475_at 39761_at KIAA0241 protein 0.28
reactive protein (CRP) are associated with cardiovascular risk, independently from traditional risk factors [21]. Nevertheless, there is debate as to the additional prognostic value of these tests beyond traditional risk factors [22]. Other non-invasive analyses, such as coronary multislice CT can identify the extent of coronary artery disease, but such tests require specialized equipment and involve use of intravenous contrast and radiation. A simple blood test that predicts the extent of coronary artery disease could provide an additional useful tool for screening for coronary artery disease in at-risk populations. A similar approach has been successfully used for detection of cardiac allograft rejection and the response to immunosuppressive therapy [23].
Most of the differentially expressed genes in the present study are involved in bone marrow cell differentiation, cell growth or growth arrest, apoptosis, cell adhesion and matrix modulation, and inflammatory and immune response, processes known to modulate atherosclerosis. Since blood samples were taken in stable patients, our finding that circulating blood cells differentially express many pro-inflammatory genes supports the paradigm that inflammation is an important process in patients with coronary artery disease. Expression patterns of the same genes were found to correlate with the extent of atherosclerosis in human aortas as well, indicating
that gene expression patterns in peripheral blood cells associated with coronary artery disease to some extent mirror gene expression changes in the atherosclerotic vessel wall. Indeed, many of the genes shared by our predictive models modulate monocyte or macrophage function, includingMAN2A[24],RXRA [25], LGALS9 [26], PSG3 [27], CEPBA [28], ARGHAP4 [29], MADH5[30],AIF1 [31],ELAVL2[32],STXBP2[33],KCNMB1 [34],PDE4D[35],EPHB2[36], GGA3[37],PLAUR[38],NPR3 [39] andTNFRSF5(CD40) [40]. Interestingly, four of these genes (KCNMB1, NEDD4L, ADD1 and NPR3) have been implied in genetic susceptibility for hypertension [41–44], while two genes have been associated with genetic susceptibility for stroke (PDE4D) [45] or myocardial infarction (ADD1) [46]. The present results also appear to support a role for ferritin light chain (FTL) in atherosclerosis [47]. Ferritin is the major intracellular iron storage protein that plays a major role in the reaction to oxidative stress. Using a proteomic approach, You et al. found that the levels of ferritin light chain protein were significantly increased in atherosclerotic coronary arteries [48]. Ferritin light chain is also upregulated in circulating leukocytes of patients with juvenile rheumatoid arthritis, sickle cell disease, autoimmune renal disease or multiple sclerosis, indicating that alteredFTLgene expression in
Symbol U133A ID 95Av2 ID Name Pathway Rho
13CDNA73u 214319_at 33276_at hypothetical protein CG003 0.24
SH3TC1u 219256_s_at SH3 domain and tetratricopeptide repeats 1 0.28
RER1u 213114_at RER1 homolog (S. cerevisiae) 0.26
DKFZp564M0616 215763_at cDNA DKFZp564M0616 0.26
KIAA0882u 212960_at KIAA0882 0.22
FLJ11155 219750_at hypothetical protein FLJ11155 0.23
LOC51145 220752_at erythrocyte transmembrane protein 0.23
SEC61A2 219499_at Protein transport protein Sec61 alpha subunit 2 0.20
C12orf4u 218374_s_at chromosome 12 open reading frame 4 0.24
STYK1 221696_s_at serine/threonine/tyrosine kinase 1 0.22
FLJ20674 220137_at hypothetical protein FLJ20674 0.24
PRO1693 221137_at PRO1693 0.22
FLJ12058uu 215971_at FLJ12058 fis, clone HEMBB1002092 0.21
FLJ10305u 216501_at hypothetical protein FLJ10305 0.25
DKFZP434O047 208008_at DKFZP434O047 protein 0.25
FLJ10970 219230_at hypothetical protein FLJ10970 0.21
FLJ22209 216450_x_at cDNA: FLJ22209 fis, clone HRC01496 0.20
FLJ11996 207487_at hypothetical protein FLJ11996 0.24
FLJ20241u 207083_s_at putative NFkB activating protein 0.24
FLJ14220u 219310_at FLJ14220, chromosome 20 open reading frame 39 0.21
SYNGR1u 213854_at synaptogyrin 1 0.22
FLJ11871u 220915_s_at FLJ11871, DKFZp686I0814 0.24
LRCH4 204692_at Leucine rich repeat neuronal 4 0.26
PRO2533 220787_at 0.23
EST 222308_x_at 0.24
EST 222302_at 0.22
EST 215906_at 0.28
The 8 most predictive genes according to the VIP analysis are listed in bold;uuindicated the 19 genes anduoruuthe 90 genes that were found to be differentially expressed in a multiway ANOVA.
doi:10.1371/journal.pone.0007037.t002
peripheral cells of CAD patients might in at least in part reflect a general pro-inflammatory state that leads to degenerative changes [49–52].
We intentionally did not separate peripheral blood cells or leukocyte subtypes. There is currently little pathophysiological evidence that the study of leukocyte subgroups would add to our predictive model and the isolation process could, in itself, affect the gene expression pattern. Using whole blood cells not only allows aggregate RNA expression analysis per patient without the need to pool rare subtypes, but is also more practical from a clinical perspective. Leukocyte levels in all groups were very similar, although it cannot be excluded that the percentage of specific subtypes differ between groups, and hence that different numbers of subtypes are responsible for the observed effect. Peripheral whole blood might also include differential expression signatures from reticulocytes, platelets or rare hematopoietic progenitors.
In a recent paper, Wingrove et al reported 526 differentially expressed genes (.1.3-fold expression) from a genome-wide microarray analysis of peripheral blood mononuclear cells of 27 cases with angiographically documented CAD and 14 controls [15]. The authors found that 14 genes, out of a a set of 106 genes including the 50 most significant genes from the microarray analysis and 56 genes selected from the literature, were associated with the presence of CAD and the severity of CAD in two independent cohorts. The overlap between our study and the Wingrove study at the individual gene level appears to be very limited. This might be in part due to the considerably different design of our study. Not only did we prefer a correlation-based approach, the Wingrove study also used a much smaller subset of patients for unbiased microarray-based gene discovery, and added 56 literature-based genes for the subsequent analysis in their two cohorts. As a result of our correlation analysis, we also did not exclude genes with differential expression below 1.3-fold; since
atherosclerosis is a chronic disease, small changes in gene expression might accrue over time and result in a clinically relevant phenotype. Moreover, in contrast with our study, a substantial proportion of microarray samples in the Wingrove analysis were taken from patients presenting with an acute coronary syndrome, which might have significantly influenced expression levels. Another reason for the discrepancies between the two studies might be the different types of microarray used and different types of cells studied. In our study, we analyzed RNA from whole blood in all patients, in contrast with isolated mononuclear cells used in the discovery phase of the Wingrove study. An Ingenuity Pathway Analysis (IPA, Ingenuity Systems, Redwood City, Ca; USA) comparing the 366 genes with p,0.05 (from the 526 probesets) and our 160 genes with rho.0.2 shows that similar biological functions were hit, despite the different microarrays and different matrices used (data not shown). In any case, the discrepancies between both studies suggest that these results need to be validated in larger and more diverse populations. Of the 160 genes we found to be correlated with the extent of CAD, only 19 were significantly differentially expressed between all cases and controls, while gene expression was significantly different for 90 genes when comparing 20 patients with the least predicted CAD-index to 20 patients with the highest predicted CAD-index. Most of our cases only have mild to moderate disease, with only a minority having extensive disease. Thus, in part as a result of our proteomics-driven patient selection, there is likely to be a very gradual transition from controls to cases, with the distrubution of cases being skewed towards the lower end of CAD-index. We therefore assumed that the difference between controls and cases was not likely to be very large, hence our preference for a correlation-based analysis. Furthermore, since the average age of the controls was 52 years, it is highly likely that some degree of coronary atherosclerosis is present in these subjects. Interestingly, Figure 1. Partial least squares plot of nominal CAD index versus predicted CAD index.Result of the partial least squares analysis including all controls and all cases; n = 222 and 160 genes. Cases are represented as triangles and controls as circles. The CAD-index as predicted by the gene expression is plotted versus the nominal CAD-index as obtained from coronary angiography. Regression line of the predicted CAD index versus nominal CAD-Index is displayed by the full line including 95% confidence interval of the regression (dotted lines) and the 95% prediction interval (striped lines). Goodness of fit is indicated by r2= 0.776 (p
patients with normal angiograms but with microvascular dysfunc-tion may also demonstrate peripheral monocyte activadysfunc-tion, although not to the extent seen in patients with angiographically documented coronary artery disease [53]. Our findings that the present model also accurately predicts the severity of coronary artery disease in female patients, in whom advanced coronary artery disease is less likely at the age of 50, is reassuring. It is notable that CRP and LDL did not predict disease in our population. However, while these are excellent markers for future cardiovascular events [54], their ability to predict the severity of angiographically documented CAD is known to be low [55–58]. We even observed an inverse correlation between LDL-cholesterol levels and CAD-index. This might be at least in part due to differences in treatments, especially in statin use. Statins might
indeed blunt gene expression differences in vascular cells and circulating monocytes to certain extent, which might have influenced our findings [59,60].
In conclusion, the combined predictive value of differentially expressed genes in peripheral blood correlates with the extent of coronary atherosclerosis. Importantly, the expression pattern of the same genes is also correlated with the extent of disease in atherosclerotic aortas. While these findings need prospective validation in further populations, our findings also suggest that gene expression profiles might represent a novel and promising non-invasive test to assess the presence and extent of coronary artery disease. Although the extent of angiographic disease is a strong predictor of clinical outcome, further studies in larger and unselected populations will also be needed to examine the Figure 2. Partial least squares plot per cohort.Results of the partial least squares regression analysis with 160 genes applied separately to each of the three cohorts (A) ‘‘Matched Men’’ (B) ‘‘Unmatched Men’’ and (C) ‘‘‘Unmatched Women’’. Models were each time constructed in two cohorts and then tested in the third cohort. Individual patients are ordered by their CAD-Index. Labels represent the individual CAD-Index. Controls (full line) have all CAD-Index 0, and the CAD-Index of cases (dotted line) increases from 23 up to 100. While the controls remain quite stable in the range of -2 standard deviations, the t1-scores increase with increasing CAD-Index (t1 indicates the t1 score vector result from the PLS analysis).
Figure 3. VIP.Variable Importance in the Projection (VIP) for the separate PLS analyses of the three different cohorts compared to the PLS analysis including all subjects. Displayed are the 24 probesets with the highest VIP. The curve shows a steep decrease for the first 8 genes (listed in table 2); the contribution of further genes is comparable as suggested by almost linear curves.
doi:10.1371/journal.pone.0007037.g003
Figure 4. Partial least squares discriminant analysis in atherosclerotic aortas.Result of the partial least squares discriminant analysis (t1/t2 score plot) including all aorta samples; n = 67. Dots represent normal aortas, squares represent intermediate atherosclerosis and diamonds indicate severe aorta atherosclerosis. Using expression data in aorta samples, the PLS analysis using the 160 peripheral blood genes adequately separates normal aortas from intermediate and severe atherosclerotic aortas (the ellipse indicates Hotelling’s T2 95% confidence region; t1 and t2 indicate the t1 and t2 score vector results from the PLS-DA analysis).
potential role of gene expression patterns in predicting outcome and to address potential confounding factors.
Acknowledgments
Dr Sinnaeve is a Clinical Investigator of the Fund for Scientific Research – Flanders.
Author Contributions
Conceived and designed the experiments: PRS MPD PG DMS JV WEK GSG PJGC CBG. Performed the experiments: MPD PG DMS MHSJ GSG PJGC CBG. Analyzed the data: PRS PG DMS SDC WEK CLN CBG. Contributed reagents/materials/analysis tools: MPD PG JV SDC MHSJ. Wrote the paper: PRS PJGC CBG.
References
1. Rosamond WD, Folsom AR, Chambless LE, Wang CH (2001) Coronary heart disease trends in four United States communities. The Atherosclerosis Risk in Communities (ARIC) study 1987–1996. IntJ Epidemiol 30 Suppl 1: S17. 2. Gibbons GH, Liew CC, Goodarzi MO, Rotter JI, Hsueh WA, et al. (2004)
Genetic markers: progress and potential for cardiovascular disease. Circulation 109: IV47.
3. Libby P (2002) Inflammation in atherosclerosis. Nature 420: 868.
4. Eriksson EE, Xie X, Werr J, Thoren P, Lindbom L (2001) Direct viewing of atherosclerosis in vivo: plaque invasion by leukocytes is initiated by the endothelial selectins. FASEB J 15: 1149.
5. Hiltunen MO, Tuomisto TT, Niemi M, Brasen JH, Rissanen TT, et al. (2002) Changes in gene expression in atherosclerotic plaques analyzed using DNA array. Atherosclerosis 165: 23.
6. Nanni L, Romualdi C, Maseri A, Lanfranchi G (2006) Differential gene expression profiling in genetic and multifactorial cardiovascular diseases. J Mol Cell Cardiol 41: 934–948.
7. Randi AM, Biguzzi E, Falciani F, Merlini P, Blakemore S, et al. (2003) Identification of differentially expressed genes in coronary atherosclerotic plaques from patients with stable or unstable angina by cDNA array analysis. J ThrombHaemost 1: 829.
8. Seo D, Wang T, Dressman H, Herderick EE, Iversen ES, et al. (2004) Gene Expression Phenotypes of Atherosclerosis. Arterioscler Thromb Vasc Biol 24: 1922–1927.
9. Cagnin S, Biscuola M, Patuzzo C, Trabetti E, Pasquali A, et al. (2009) Reconstruction and functional analysis of altered molecular pathways in human atherosclerotic arteries. BMC Genomics 10: 13.
10. Ijas P, Nuotio K, Saksi J, Soinne L, Saimanen E, et al. (2007) Microarray analysis reveals overexpression of CD163 and HO-1 in symptomatic carotid plaques. Arterioscler Thromb Vasc Biol 27: 154–160.
11. Mohler ER 3rd, Sarov-Blat L, Shi Y, Hamamdzic D, Zalewski A, et al. (2008) Site-specific atherogenic gene expression correlates with subsequent variable lesion development in coronary and peripheral vasculature. Arterioscler Thromb Vasc Biol 28: 850–855.
12. Sluimer JC, Kisters N, Cleutjens KB, Volger OL, Horrevoets AJ, et al. (2007) Dead or alive: gene expression profiles of advanced atherosclerotic plaques from autopsy and surgery. Physiol Genomics 30: 335–341.
13. Aziz H, Zaas A, Ginsburg GS (2007) Peripheral blood gene expression profiling for cardiovascular disease assessment. Genomic Med 1: 105–112.
14. Grimm RH Jr, Neaton JD, Ludwig W (1985) Prognostic importance of the white blood cell count for coronary, cancer, and all-cause mortality. JAMA 254: 1932. 15. Wingrove JA, Daniels SE, Sehnert AJ, Tingley W, Elashoff MR, et al. (2008) Correlation of Peripheral-Blood Gene Expression With the Extent of Coronary Artery Stenosis. Circ Cardiovasc Genet 1: 31–38.
16. Donahue MP, Rose K, Hochstrasser D, Vonderscher J, Grass P, et al. (2006) Discovery of proteins related to coronary artery disease using industrial-scale proteomics analysis of pooled plasma. Am Heart J 152: 478–485.
17. Felker GM, Shaw LK, O’Connor CM (2002) A standardized definition of ischemic cardiomyopathy for use in clinical research. J Am CollCardiol 39: 210. 18. Mark DB, Nelson CL, Califf RM, Harrell FE Jr, Lee KL, et al. (1994) Continuing evolution of therapy for coronary artery disease. Initial results from the era of coronary angioplasty. Circulation 89: 2015.
19. Wang J, Robinson JF, Khan HM, Carter DE, McKinney J, et al. (2004) Optimizing RNA extraction yield from whole blood for microarray gene expression analysis. ClinBiochem 37: 741.
20. Lockhart DJ, Dong H, Byrne MC, Follettie MT, Gallo MV, et al. (1996) Expression monitoring by hybridization to high-density oligonucleotide arrays. NatBiotechnol 14: 1675.
21. Rosenson RS, Koenig W (2003) Utility of inflammatory markers in the management of coronary artery disease. Am J Cardiol 92: 10i.
22. Danesh J, Wheeler JG, Hirschfield GM, Eda S, Eiriksdottir G, et al. (2004) C-reactive protein and other circulating markers of inflammation in the prediction of coronary heart disease. NEnglJ Med 350: 1387.
23. Horwitz PA, Tsai EJ, Putt ME, Gilmore JM, Lepore JJ, et al. (2004) Detection of cardiac allograft rejection and response to immunosuppressive therapy with peripheral blood gene expression. Circulation 110: 3815.
24. Misago M, Liao YF, Kudo S, Eto S, Mattei MG, et al. (1995) Molecular cloning and expression of cDNAs encoding human alpha-mannosidase II and a previously unrecognized alpha-mannosidase IIx isozyme. ProcNatlAcadSciUSA 92: 11766.
25. Fritsche J, Stonehouse TJ, Katz DR, Andreesen R, Kreutz M (2000) Expression of retinoid receptors during human monocyte differentiation in vitro. BiochemBiophysResCommun 270: 17.
26. Abedin MJ, Kashio Y, Seki M, Nakamura K, Hirashima M (2003) Potential roles of galectins in myeloid differentiation into three different lineages. J LeukocBiol 73: 650.
27. Snyder SK, Wessner DH, Wessells JL, Waterhouse RM, Wahl LM, et al. (2001) Pregnancy-specific glycoproteins function as immunomodulators by inducing secretion of IL-10, IL-6 and TGF-beta1 by human monocytes. Am J ReprodImmunol 45: 205.
28. Heath V, Suh HC, Holman M, Renn K, Gooya JM, et al. (2004) C/EBPalpha deficiency results in hyperproliferation of hematopoietic progenitor cells and disrupts macrophage development in vitro and in vivo. Blood 104: 1639. 29. Tribioli C, Droetto S, Bione S, Cesareni G, Torrisi MR, et al. (1996) An X
chromosome-linked gene encoding a protein with characteristics of a rhoGAP predominantly expressed in hematopoietic cells. ProcNatlAcadSciUSA 93: 695. 30. Liu B, Mao N (2004) Smad5: signaling roles in hematopoiesis and osteogenesis.
IntJ BiochemCell Biol 36: 766.
31. Arvanitis DA, Flouris GA, Spandidos DA (2005) Genomic rearrangements on VCAM1, SELE, APEG1and AIF1 loci in atherosclerosis. J Cell MolMed 9: 153. 32. King PH, Fuller JJ, Nabors LB, Detloff PJ (2000) Analysis of the 59end of the mouse Elavl1 (mHuA) gene reveals a transcriptional regulatory element and evidence for conserved genomic organization. Gene 242: 125.
33. Logan MR, Odemuyiwa SO, Moqbel R (2003) Understanding exocytosis in immune and inflammatory cells: the molecular basis of mediator secretion. J Allergy ClinImmunol 111: 923.
34. Hanley PJ, Musset B, Renigunta V, Limberg SH, Dalpke AH, et al. (2004) Extracellular ATP induces oscillations of intracellular Ca2+and membrane potential and promotes transcription of IL-6 in macrophages. ProcNatlAcadS-ciUSA 101: 9479.
35. Shepherd MC, Baillie GS, Stirling DI, Houslay MD (2004) Remodelling of the PDE4 cAMP phosphodiesterase isoform profile upon monocyte-macrophage differentiation of human U937 cells. BrJ Pharmacol 142: 339.
36. Yu G, Luo H, Wu Y, Wu J (2003) Ephrin B2 induces T cell costimulation. J Immunol 171: 106.
37. Kzhyshkowska J, Gratchev A, Martens JH, Pervushina O, Mamidi S, et al. (2004) Stabilin-1 localizes to endosomes and the trans-Golgi network in human macrophages and interacts with GGA adaptors. J LeukocBiol 76: 1151. 38. Paysant J, Vasse M, Soria J, Lenormand B, Pourtau J, et al. (1998) Regulation of
the uPAR/uPA system expressed on monocytes by the deactivating cytokines, IL-4, IL-10 and IL-13: consequences on cell adhesion to vitronectin and fibrinogen. BrJ Haematol 100: 45.
39. Baldini PM, De Vito P, Martino A, Fraziano M, Grimaldi C, et al. (2003) Differential sensitivity of human monocytes and macrophages to ANP: a role of intracellular pH on reactive oxygen species production through the phospho-lipase involvement. J LeukocBiol 73: 502.
40. Schonbeck U, Libby P (2001) CD40 signaling and plaque instability. CircRes 89: 1092.
41. Fernandez-Fernandez JM, Tomas M, Vazquez E, Orio P, Latorre R, et al. (2004) Gain-of-function mutation in the KCNMB1 potassium channel subunit is associated with low prevalence of diastolic hypertension. J ClinInvest 113: 1032. 42. Lanzani C, Citterio L, Jankaricova M, Sciarrone MT, Barlassina C, et al. (2005) Role of the adducin family genes in human essential hypertension. J Hypertens 23: 543.
43. Pankow JS, Dunn DM, Hunt SC, Leppert MF, Miller MB, et al. (2005) Further evidence of a quantitative trait locus on chromosome 18 influencing postural change in systolic blood pressure: the Hypertension Genetic Epidemiology Network (HyperGEN) Study. Am J Hypertens 18: 672.
44. Pitzalis MV, Sarzani R, Dessi-Fulgheri P, Iacoviello M, Forleo C, et al. (2003) Allelic variants of natriuretic peptide receptor genes are associated with family history of hypertension and cardiovascular phenotype. J Hypertens 21: 1491. 45. Gretarsdottir S, Thorleifsson G, Reynisdottir ST, Manolescu A, Jonsdottir S, et
al. (2003) The gene encoding phosphodiesterase 4D confers risk of ischemic stroke. NatGenet 35: 131.
46. Tobin MD, Braund PS, Burton PR, Thompson JR, Steeds R, et al. (2004) Genotypes and haplotypes predisposing to myocardial infarction: a multilocus case-control study. Eur Heart J 25: 459.
47. You SA, Wang Q (2005) Ferritin in atherosclerosis. Clin Chim Acta 357: 1–16. 48. You SA, Archacki SR, Angheloiu G, Moravec CS, Rao S, et al. (2003) Proteomic approach to coronary atherosclerosis shows ferritin light chain as a significant marker: evidence consistent with iron hypothesis in atherosclerosis. Physiol Genomics 13: 25.
50. Bomprezzi R, Ringner M, Kim S, Bittner ML, Khan J, et al. (2003) Gene expression profile in multiple sclerosis patients and healthy controls: identifying pathways relevant to disease. HumMolGenet 12: 2191.
51. Jarvis JN, Dozmorov I, Jiang K, Frank MB, Szodoray P, et al. (2004) Novel approaches to gene expression analysis of active polyarticular juvenile rheumatoid arthritis. Arthritis ResTher 6: R15.
52. Jison ML, Munson PJ, Barb JJ, Suffredini AF, Talwar S, et al. (2004) Blood mononuclear cell gene expression profiles characterize the oxidant, hemolytic, and inflammatory stress of sickle cell disease. Blood 104: 270.
53. Lin CP, Lin WT, Leu HB, Wu TC, Chen JW (2003) Differential mononuclear cell activity and endothelial inflammation in coronary artery disease and cardiac syndrome X. IntJ Cardiol 89: 53.
54. Ridker PM, Rifai N, Rose L, Buring JE, Cook NR (2002) Comparison of C-reactive protein and low-density lipoprotein cholesterol levels in the prediction of first cardiovascular events. N Engl J Med 347: 1557–1565.
55. Arroyo-Espliguero R, Avanzas P, Cosin-Sales J, Aldama G, Pizzi C, et al. (2004) C-reactive protein elevation and disease activity in patients with coronary artery disease. Eur Heart J 25: 401–408.
56. Hunt ME, O’Malley PG, Vernalis MN, Feuerstein IM, Taylor AJ (2001) C-reactive protein is not associated with the presence or extent of calcified subclinical atherosclerosis. Am Heart J 141: 206–210.
57. Schmidt SB, Wasserman AG, Muesing RA, Schlesselman SE, Larosa JC, et al. (1985) Lipoprotein and apolipoprotein levels in angiographically defined coronary atherosclerosis. Am J Cardiol 55: 1459–1462.
58. Zebrack JS, Muhlestein JB, Horne BD, Anderson JL (2002) C-reactive protein and angiographic coronary artery disease: independent and additive predictors of risk in subjects with angina. J Am Coll Cardiol 39: 632–637.
59. Morikawa S, Takabe W, Mataki C, Wada Y, Izumi A, et al. (2004) Global analysis of RNA expression profile in human vascular cells treated with statins. J Atheroscler Thromb 11: 62–72.