Braz. J. of Develop., Curitiba, v. 5, n. 8, p. 11317-11329 aug. 2019 ISSN 2525-8761
Evaluation of blood plasma flow around 2D erythrocytes with the use of computational
fluid dynamics
Avaliação do escoamento de plasma sanguíneo ao redor de eritrócitos 2D com o uso de
fluidodinâmica computacional
DOI:10.34117/bjdv5n8-013
Recebimento dos originais: 17/07/2019 Aceitação para publicação: 15/08/2019
Cristian Ricardo Schwatz
Chemical Engineering Master's Student - University of Blumenau Institution: University of Blumenau
Address: Rua São Paulo, 3250 - Bloco I - 2°Andar - Itoupava Seca, Blumenau – SC, Brasil. E-mail: criistianrs@hotmail.com
Igor Agusto Depiné Fiamoncini
Chemical Engineering Undergraduate - University of Blumenau Institution: University of Blumenau
Address: Rua São Paulo, 3250 - Bloco I - 2°Andar - Itoupava Seca, Blumenau – SC, Brasil. E-mail: igoradf@gmail.com
Ricardo Nava de Sousa
Chemical Engineering Master's Student - University of Blumenau Institution: University of Blumenau
Address: Rua São Paulo, 3250 - Bloco I - 2°Andar - Itoupava Seca, Blumenau – SC, Brasil. E-mail: ricardo.nava.sousa@gmail.com
Bruna Iten Bittelbrunn
Chemical Engineering Master's Student - University of Blumenau Institution: University of Blumenau
Address: Rua São Paulo, 3250 - Bloco I - 2°Andar - Itoupava Seca, Blumenau – SC, Brasil. E-mail: brunaiten@gmail.com
Leonardo Machado da Rosa
Chemical Engineering Doctor - University of Campinas Institution: University of Blumenau
Address: Rua São Paulo, 3250 - Bloco I - 2°Andar - Itoupava Seca, Blumenau – SC, Brasil. E-mail: leorosa@gmail.com
Henry França Meier
Chemical Engineering Doctor - University of Campinas Institution: University of Blumenau
Address: Rua São Paulo, 3250 - Bloco I - 2°Andar - Itoupava Seca, Blumenau – SC, Brasil. E-mail: meier@furb.br
Jaci Carlo Schramm Câmara Bastos
Chemical Engineering Doctor - University of Campinas Institution: University of Blumenau
Address: Rua São Paulo, 3250 - Bloco I - 2°Andar - Itoupava Seca, Blumenau – SC, Brasil. E-mail: camarabastos@gmail.com
Braz. J. of Develop., Curitiba, v. 5, n. 8, p. 11317-11329 aug. 2019 ISSN 2525-8761 ABSTRACT
Hemodynamic forces, such as Wall Shear Stress, are known to be one of the factors behind atherosclerotic plaque formation in blood vessels. Such plaque formation may lead to clinical conditions such as aneurysms and stenosis. Given the importance of understanding the hemodynamics inside blood vessels, CFD-based (Computational Fluid Dynamics) tools can be applied with Medical imaging techniques, in order to assist physicians. Although CFD simulations try to simulate cases as close as possible to their real physics, simplifications are often required. Furthermore, blood is usually taken as being a single-phase fluid, despite it being a suspension of blood cells in plasma. This is due to the focus of computational hemodynamics often being the whole blood flow or pathologies within the blood vessel. However, blood cells can account to more than half of the blood volume, depending on the patient. Hence, the present work aimed to study the behavior of plasma, flowing around a single erythrocyte, as well as a cluster of erythrocytes immersed in a 2D domain. In the simulations, parameters such as the Reynolds number and velocity profiles were analyzed. Results showed that erythrocyte geometry had an influence in the velocity profiles. Moreover, Reynolds numbers were considerably low, due to the micro scale utilized in the simulations, which was in accordance with literature.
Keywords: Blood, Eryhtrocytes, Hemodynamics, Simulations, Computational Fluid Dynamics. RESUMO
Sabe-se que forças hemodinâmicas, como o Stress de Cisalhamento na Parede, são um dos fatores responsáveis pela formação da placa aterosclerótica nos vasos sanguíneos. Essa formação de placas pode levar a condições clínicas, como aneurismas e estenoses. Dada a importância de se entender a hemodinâmica dentro dos vasos sanguíneos, ferramentas baseadas em CFD (Computational Fluid Dynamics) podem ser aplicadas com técnicas de imagem médica, a fim de auxiliar os médicos. Embora as simulações de CFD tentem simular os casos o mais próximo possível de sua física real, simplificações são frequentemente necessárias. Além disso, o sangue é geralmente considerado como sendo um fluido monofásico, apesar de ser uma suspensão de células sanguíneas no plasma. Isto é devido ao foco da hemodinâmica computacional, muitas vezes sendo o fluxo total de sangue ou patologias dentro do vaso sanguíneo. No entanto, as células do sangue podem representar mais da metade do volume de sangue, dependendo do paciente. Assim, o presente trabalho teve como objetivo estudar o comportamento do plasma, fluindo em torno de um único eritrócito, bem como um aglomerado de eritrócitos imersos em um domínio 2D. Nas simulações, parâmetros como o número de Reynolds e os perfis de velocidade foram analisados. Os resultados mostraram que a geometria dos eritrócitos influenciou os perfis de velocidade. Além disso, os números de Reynolds foram consideravelmente baixos, devido à escala micro utilizada nas simulações, que estava de acordo com a literatura.
Palavras-chave: Sangue, Eritrócitos, Hemodinâmica, Simulações, Fluidodinâmica Computacional. 1 INTRODUCTION
Hemodynamic forces, such as Wall Shear Stress, are known to be one of the factors behind atherosclerotic plaque formation in blood vessels. This plaque formation can lead to vascular pathologies, such as aneurysms and stenosis (BALOSSINO et al., 2009; CEBRAL et al., 2005; DONG et al., 2013). Given the importance of understanding the hemodynamics inside blood vessels,
Braz. J. of Develop., Curitiba, v. 5, n. 8, p. 11317-11329 aug. 2019 ISSN 2525-8761
numerical simulations such as those using the CFD (Computational Fluid Dynamics) technique have been applied, in order to aid physicians with further analysis of the blood flow. These simulations can be used alongside with common medical imaging technologies, such as MRI (Magnetic Resonance Imaging) and CT-scans (Computed Tomography) (LI et al., 2018). Although numerical studies try to simulate cases as close as possible to the real physical and biological behavior, many studies tend to adopt simplifications. Some usual considerations are the adoption of a Newtonian model for the single-phase blood rheology or the use of generic geometries representing the vessels. Nevertheless, the use of simplifications can lead to reasonable results (KARIMI et al., 2014; MORALES et al., 2013), which can be used as basis for further studies. Despite achieving acceptable results, blood is a suspension-type fluid, composed of blood cells, erythrocytes, leucocytes and thrombocytes, suspended in plasma (JUNG and HASSANEIN, 2008; RAZAVI et al., 2011). Whilst blood cell presence in blood flow is a known information, simulations tend to consider blood as a single-phase flow. Therefore, computational hemodynamics tend to focus on the whole blood as well as pathologies, rather than the physics behind the cells. However, blood cells can account to more than half of the blood volume, depending on the patient (JUNG and HASSANEIN, 2008; OU et al., 2016). Hence, the present work aimed to study the behavior of plasma, a Newtonian fluid, flowing around a single erythrocyte, as well as a group of erythrocytes contained in a 2D domain. From the simulations, parameters such as velocity magnitude and Reynolds number were analyzed, in order to provide more information that will be used in future studies by the research group.
2 MATERIALS AND METHODS
In order to carry out simulations, three generic geometries were developed in the pre-processing step. The first two geometries had a single erythrocyte, where the differences between both are the orientation and shape of the cell. In the first one, the erythrocyte is oriented parallel to the flow, whereas the second one is oriented perpendicular to the flow. The third geometry is composed of twenty-one erythrocytes oriented parallel to the flow. Data for superficial area, as well as erythrocyte volume was taken from the literature (JAY, 1975). With the geometrical data, 3D erythrocytes were made, in order to assure that the cell volume was in accordance with the literature. From the 3D model, a cross sectional area was taken, in order to obtain the 2D model. This model was used in both first and third geometries. For the second geometry, a “parachute” shape was adopted, due to orientation of the erythrocyte. This choice was made due to the fact that erythrocytes are known to deform under flow (LIU and LIU, 2006). Moreover, it has been stated that, especially in microvessels, erythrocytes
Braz. J. of Develop., Curitiba, v. 5, n. 8, p. 11317-11329 aug. 2019 ISSN 2525-8761
tend to form a “parachute” shape (NOGUCHI and GOMPPER, 2005). All the geometrical data is available in Table 1:
Table 1. Geometrical data used in the three geometries developed.
Parameter Surface Area (μm2) Volume (μm3) Cell Radius (μm) Cell lower width (μm) Cell higher width (μm) Single parallel cell 120.31 74.77 7.8 0.75 2.25 Single perpendicular cell 140.08 87.06 7.8 1.19 1.88
In order to solve conservation equations, numerical meshes for each scenario were developed. In this step, the spatial domain is divided into infinitesimal elements, in which conservation equations are solved for each element. For each case in Table 1, three meshes were created: a coarse, an intermediate and a refined mesh. The choice of creating three meshes was to ensure that the GCI (Grid Convergence Index) method could be applied (CELIK, 2008), assuring that the influence of the numerical meshes over the numerical results is negligible. The number of elements used in each mesh, as well as mesh dimensions are presented in Tables 2 and 3:
Table 2. Number of elements for each mesh in all cases.
Case
Number of Elements
Coarse Mesh Intermediate Mesh Refined Mesh
1. Single parallel cell 9410 9496 20224
2. Single perpendicular cell 13532 13170 26537 3. Multiple parallel cells 16746 16612 32684
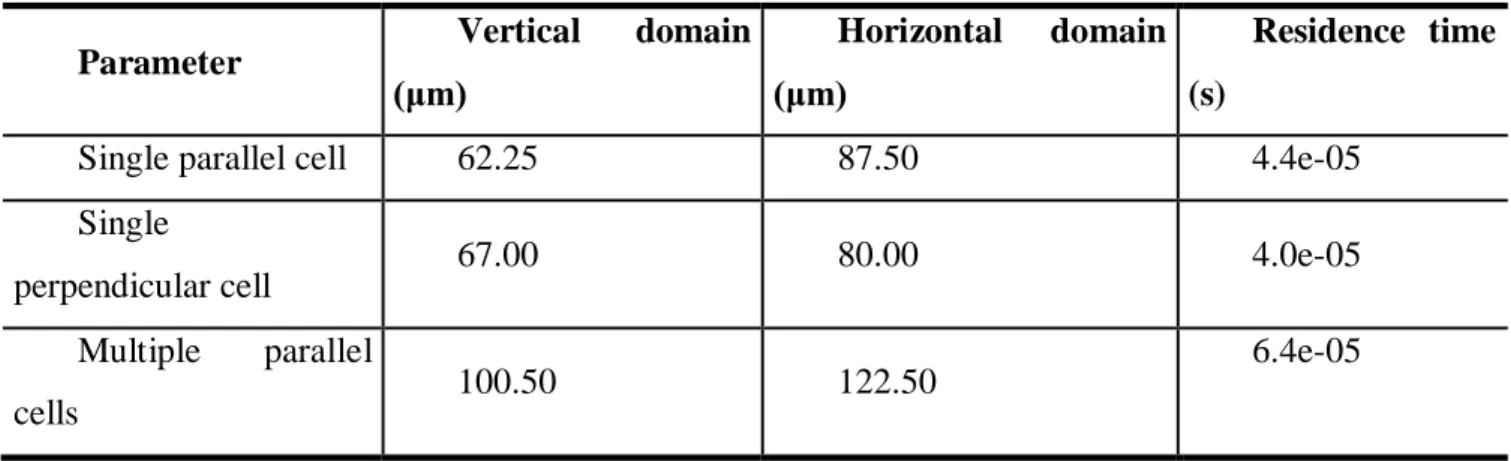
Braz. J. of Develop., Curitiba, v. 5, n. 8, p. 11317-11329 aug. 2019 ISSN 2525-8761 Table 3. Mesh dimensions and residence time for each case.
Parameter Vertical domain
(μm)
Horizontal domain (μm)
Residence time (s)
Single parallel cell 62.25 87.50 4.4e-05
Single
perpendicular cell 67.00 80.00 4.0e-05
Multiple parallel
cells 100.50 122.50
6.4e-05
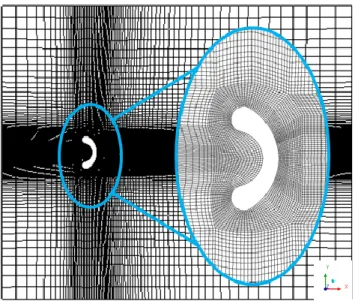
Additionally, Figures 1 to 3 show the numerical meshes developed. The number of elements chosen for each mesh was based in the factor of 1.3 proposed by Celik (2008). The parameter analyzed for the GCI development was the velocity profile in the Y direction. In all three cases, errors did not surpass 2%, which indicates that the numerical grid choice will have a considerable low influence on numerical results. Thus, for all three cases the refined grid was chosen, since the computational time to run simulations was similar for all meshes. All steps of the pre-processing were carried using the ANSYS FLUENT 19 software.
Braz. J. of Develop., Curitiba, v. 5, n. 8, p. 11317-11329 aug. 2019 ISSN 2525-8761 Figure 2. Numerical mesh for the second case.
Figure 3. Numerical mesh for the third case.
For the setup used in the simulations, a transient single-phase flow, in which mass and momentum conservation equations need to be solved, respectively (Equations 1 and 2):
(∇ · u) = 0 (1)
∂/∂t ρu = -(∇ ∙ρuu) - ∇ p – (∇ ∙ τ) + ρ g + F (2) Furthermore, since plasma is the fluid of interest, a Newtonian rheological model could be adopted. Thus, the stress tensor from Equation 2 can be written as (Equation 3):
Braz. J. of Develop., Curitiba, v. 5, n. 8, p. 11317-11329 aug. 2019 ISSN 2525-8761
τ=-μ [∇ u + (∇ u)T ] - 2/3 (∇ ∙ u)I (3)
Since blood flows have a tendency of presenting low Reynolds numbers (LIU and LIU, 2006), a laminar approach was adopted. For the processing step, plasma viscosity and density of 0.0011 Pa.s and 1020 kg/m3 were adopted (OU et al., 2016) and an inlet velocity of 0.5 m/s was used, to represent the average blood velocity. As side boundary conditions, a zero-shear boundary was adopted, since this control volume is taken to be located at a point inside the vessel, which is far from the vessel walls. Although the blood cells were taken as being solid, the same zero-shear condition was adopted on the walls of the erythrocyte, because the cells should be moving with the plasma. Thus, the velocity around them should not equal to zero. Average blood pressure of 100 mmHg was used as exit boundary condition. The simulations used a timestep of 10-6, due to the fact that the Courant number was highly dependent on the timestep size. This timestep ensured Courant numbers of approximately 1. All simulations were carried for a total flow time of 0.2 s, since convergence was achieved after 0.02 s of simulation. Moreover, the residence time inside the control volume is relatively small, according to Table 3, justifying the simulation time choice. Moreover, many simplifications were adopted for the simulation in this study. Inlet boundary condition was taken as being a constant velocity, whereas regular blood flow behaves in a pulsatile manner. The erythrocytes in the simulations were taken as being stationary, while in real scenarios red blood cells have a relative velocity to the plasma. Lastly, spatial domain was taken to be two dimensional, in order to facilitate the simulations.
3 RESULTS AND DISCUSSION
Results obtained in the three simulations are presented in Table 4 and Figures4 to 7.
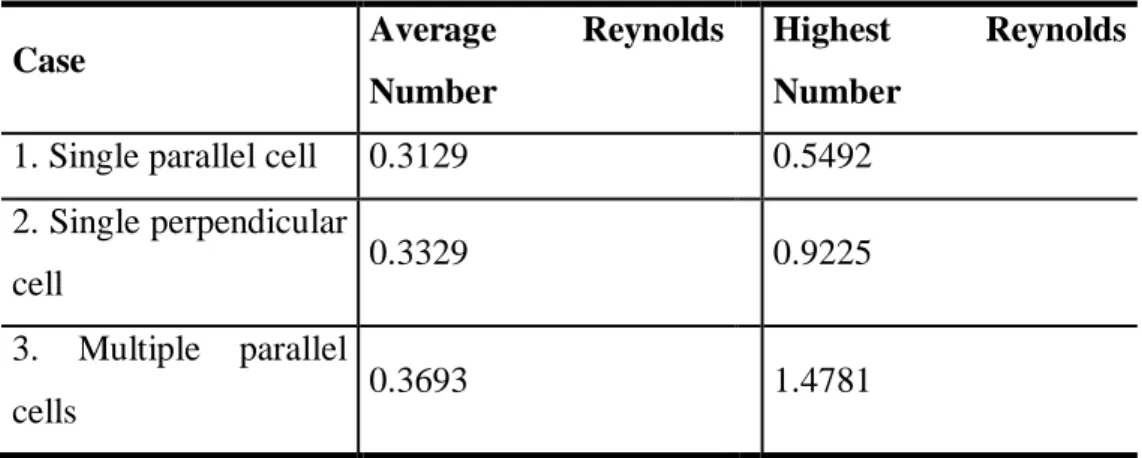
Table 4. Average and highest Reynolds number for each case.
Case Average Reynolds
Number
Highest Reynolds Number
1. Single parallel cell 0.3129 0.5492 2. Single perpendicular
cell 0.3329 0.9225
3. Multiple parallel
Braz. J. of Develop., Curitiba, v. 5, n. 8, p. 11317-11329 aug. 2019 ISSN 2525-8761
From Table 4, it can be seen that the average Reynolds number for the spatial domain is relatively low, which classifies the flow as being laminar. Although Reynolds numbers of this range are unusual for fluids with densities close to water density, these results are in accordance with experimental data from literature. Noguchi and Gomper (2005) stated that experimental Reynolds numbers for erythrocyte clusters are of 10-2 range in microvessels. Given that the volume control is in the micron range, its flow can be compared to flow in capillaries. Additionally, since the Reynolds number equation (Equation 4) has a characteristic length in the order of micrometers multiplying the numerator, low Reynolds numbers were expected from the simulations.
Re = (ρf uf Lc)/μf (4)
Where ρf is the fluid density, μf is the fluid viscosity, uf is the fluid velocity and Lc is the characteristic length. For this case, the fluid of interest is the plasma.
Figure 4. Velocity contour of the first case.
Braz. J. of Develop., Curitiba, v. 5, n. 8, p. 11317-11329 aug. 2019 ISSN 2525-8761 Figure 6. Velocity contour of the third case.
Figure 7. Velocity profiles of the three cases.
The velocity contours are shown in Figures 4 to 6. It is possible to see that the erythrocyte geometry has a significant effect on the velocity magnitude. From the velocity profiles in Figure 7, a relation of geometry to velocity can be drawn. It is visible that depending on the geometry, the deceleration of the plasma is more pronounced. In cases two and three, the geometry promotes a higher deceleration of the plasma at the middle line. Additionally, it promotes a higher velocity around the erythrocytes in the free flow regions, away from the centerline.
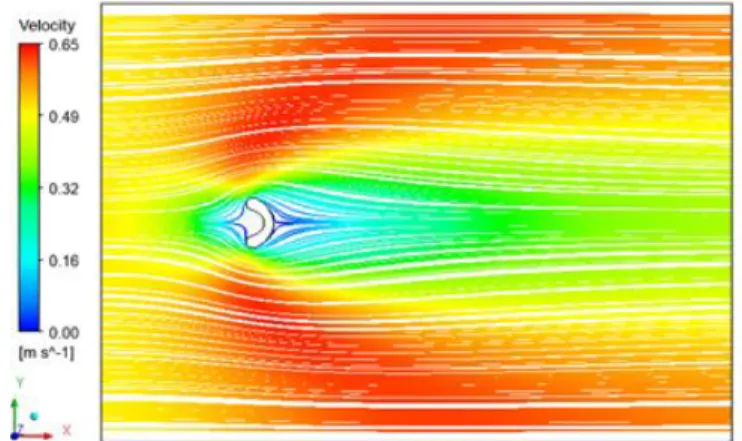
Braz. J. of Develop., Curitiba, v. 5, n. 8, p. 11317-11329 aug. 2019 ISSN 2525-8761 Figure 8. Flow streamlines of the first case.
Figure 9. Flow streamlines of the second case.
Figure 10. Flow streamlines of the third case.
Streamlines are presented in Figures 8 to 10. Although cases one and two are similar, case three showed a recirculation after the cells, despite having considerably low Reynolds numbers. This recirculation pattern can be attributed to the geometry chosen for this simulation. Since the spacing between each erythrocyte is relatively narrow, ranging from one to three erythrocyte diameters, plasma
Braz. J. of Develop., Curitiba, v. 5, n. 8, p. 11317-11329 aug. 2019 ISSN 2525-8761
might experience an expansion after leaving the erythrocyte cluster. This result could also be associated with the fact that the cells being simulated are rigid bodies, which is not the mechanical behavior of erythrocytes.
4 FINAL REMARKS
The present study aimed to simulate and analyze the plasma flow around erythrocytes using the computational fluid dynamic technique. From the simulations carried out, it was possible to see that the Reynolds number in the spatial domain adopted have relative low values, indicating that the flow is laminar. Such results were in accordance with literature. Furthermore, from the velocity contours and streamlines, it was noted that erythrocyte geometry had affects in the flow field. It was observed that the fluid deaccelerated in the middle line, as expected, and accelerated on the free flow regions. Although the present study is a preliminary study, this work was used to understand the physics of this type of flow and further studies are being carried.
ACKNOWLEDGEMENTS
This study was financed in part by the Coordenação de Aperfeiçoamento de Pessoal de Nível Superior – Brasil (CAPES) – Finance Code 001. The authors would also like to thank the Brazilian Biophysical Society and all the organizers at the 6th Annual congress of Biophysics for the opportunity.
Braz. J. of Develop., Curitiba, v. 5, n. 8, p. 11317-11329 aug. 2019 ISSN 2525-8761 REFERENCES
BALOSSINO, R. et al. Computational models to predict stenosis growth in carotid arteries: Which is the role of boundary conditions? Computer Methods in Biomechanics and Biomedical Engineering, v. 12, n. 1, p. 113–123, 2009.
CEBRAL, J. R. et al. Characterization of Cerebral Aneurysms for Assessing Risk of Rupture by Using Patient-specific Computational Hemodynamics Models. n. December, p. 2550–2559, 2005.
CELIK, I. B. Procedure for Estimation and Reporting of Uncertainty Due to Discretization in CFD Applications. v. 130, n. July 2008, p. 1–4, 2019.
DONG, J.; INTHAVONG, K.; TU, J. Image-based computational hemodynamics evaluation of atherosclerotic carotid bifurcation models. Computers in Biology and Medicine, v. 43, n. 10, p. 1353–1362, 2013.
JAY, A. W. L. GEOMETRY OF THE HUMAN ERYTHROCYTE I . EFFECT OF ALBUMIN ON CELL GEOMETRY. Biophysical Journal, v. 15, n. 3, p. 205–222, 1975.
JUNG, J.; HASSANEIN, A. Three-phase CFD analytical modeling of blood flow. Medical Engineering & Physics, v. 30, p. 91–103, 2008.
KARIMI, S. et al. Effect of rheological models on the hemodynamics within human aorta: CFD study on CT image-based geometry. Journal of Non-Newtonian Fluid Mechanics, v. 207, p. 42–52, 2014. LI, M. et al. Hemodynamics in Ruptured Intracranial Aneurysms with Known Rupture Points. World Neurosurgery, p. 1–6, 2018.
LIU, Y.; LIU, W. K. Rheology of red blood cell aggregation by computer simulation. Journal of Computational Physics, n. 220, p. 139–154, 2006.
MORALES, H. G. et al. Newtonian and non-Newtonian blood flow in coiled cerebral aneurysms. Journal of Biomechanics, v. 46, n. 13, p. 2158–2164, 2013.
NOGUCHI, H.; GOMPPER, G. Shape transitions of fluid vesicles and red blood cells in capillary flows. Proceedings of the National Academy of Sciences of the United States of America, v. 102, n. 40, p. 14159–14164, 2005.
Braz. J. of Develop., Curitiba, v. 5, n. 8, p. 11317-11329 aug. 2019 ISSN 2525-8761
OU, C. et al. Hemodynamic modeling of leukocyte and erythrocyte transport and interactions in intracranial aneurysms by a multiphase approach. Journal of Biomechanics, v. 49, n. 14, p. 3476– 3484, 2016.
RAZAVI, A.; SHIRANI, E.; SADEGHI, M. R. Numerical simulation of blood pulsatile flow in a stenosed carotid artery using different rheological models. Journal of Biomechanics, v. 44, n. 11, p. 2021–2030, 2011.