Microscale flow dynamics of red blood cells in
microchannels: an experimental and numerical
analysis
R. LIMA1, 2, M. NAKAMURA3, T. OMORI1, T. ISHIKAWA1, S. WADA3, T. YAMAGUCHI1
1) Dept. Bioeng. & Robotics, Grad. Sch. Eng., Tohoku Univ., 6-6-01 Aoba, 980-8579 Sendai, Japan. 2) Dept. Mechanical Tech., ESTiG, Bragança Polyt., C. Sta. Apolonia, 5301-857 Bragança, Portugal. 3) Dept. Mechanical Science and Bioeng., Grad. Sch. Eng., Osaka Univ., Toyonaka, 560-8531 Osaka, Japan.
1 Introduction
Approximately, the half volume of the blood is composed of red blood cells (RBCs) which is believed to strongly influence its flow properties. Blood flow in microvessels depends strongly on the motion, deformation and interaction of RBCs. Several experimental studies on both individual and concentrated RBCs have already been performed in the past (Gold-smith 1971, Gold(Gold-smith and Marlow 1979, Chien et al. 1984, Gold(Gold-smith and Turitto 1986). However, all studies used conventional microscopes and also ghost cells to obtain visible trace RBCs through the microchannel. Recently, considerable progress in the development of confocal micros-copy and consequent advantages of this microscope over the conventional microscopes have led to a new technique known as confocal micro-PIV (Tanaami et al. 2002, Park et al. 2004, Lima et al. 2006, 2007a). This tech-nique combines the conventional PIV system with a spinning disk confocal microscope (SDCM). Due to its outstanding spatial filtering technique to-gether with the multiple point light illumination system, this technique has the ability to obtain in-focus images with optical thickness less than 1 µm.
as arterioles and capillaries. In this way, we are developing an integrative multi-scale model to simulate the blood flow at mesoscopic level. This computational approach may provide important information on the rheol-ogy of blood in small vasculatures where non-Newtonian property of blood is not negligible.
The main purpose of this paper is to measure flow behavior of individ-ual RBCs at different haematocrits (Hct) through a 75µm circular polydi-methysiloxane (PDMS) microchannel by means of confocal micro-PTV system. Moreover we introduce an integrative multi-scale model to simu-late the blood flow behavior through microvessels in order to obtain more detailed insights about the blood rhelogical properties at cellular level.
2 Confocal micro-PTV measurements of RBCs
2.1 Materials and methods
2.1.1 Working fluids and microchannel
Four working fluids were used in this study: dextran 40 (Dx40) con-taining about 3%(3Hct), 13% (13Hct), 23% (23Hct) and 37% (37Hct) of human RBCs. The blood was collected from a healthy adult volunteer, where ethylenediaminetetraacetic acid (EDTA) was added to prevent co-agulation. The RBCs where separated from the bulk blood by centrifuga-tion (1500 RPM for 5 minutes) and aspiracentrifuga-tion of the plasma and buffy coat and then washed twice with physiological saline (PS). The washed RBCs were labeled with a fluorescent cell tracker (CM-Dil, C-7000, Molecular Probes) and then diluted with Dx40 to make up the required RBCs concen-tration by volume (Lima 2007, Lima et al. 2008a). All blood samples were stored hermetical at 4ºC until the experiment was performed at controlled temperature of about 37ºC. All procedures in this experiment were carried out in compliance with the Ethics Committee on Clinical Investigation of Tohoku University.
Figure 1. Cross section of the PDMS microchannel.
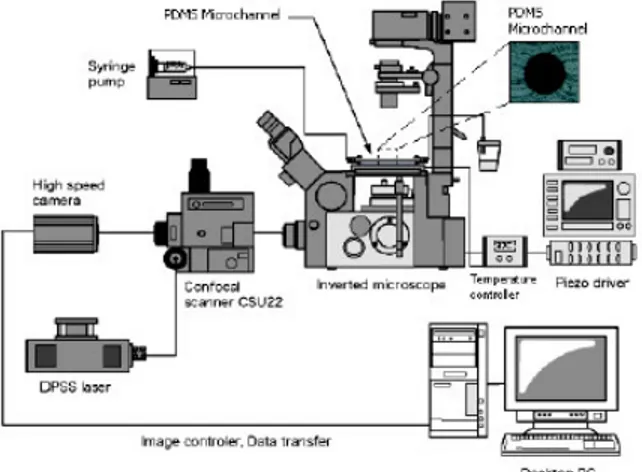
2.1.2 Confocal micro-PTV experimental set-up
The confocal micro-PIV system used in our experiment consists of an inverted microscope (IX71, Olympus, Japan) combined with a confocal scanning unit (CSU22, Yokogawa, Japan) and a diode-pumped solid state (DPSS) laser (Laser Quantum Ltd, UK) with an excitation wavelength of 532 nm. Moreover, a high-speed camera (Phantom v7.1, Vision Research, USA) was connected into the outlet port of the CSU22 (see Figure 2). The PDMS microchannel was placed on the stage of the inverted microscope where the flow rate of the working fluids was kept constant (Re ~ 0.004) by means of a syringe pump (KD Scientific Inc., USA). A thermo plate controller was set to 37ºC. All the confocal images were captured in the middle of the microchannels with a resolution of 640×480 pixels, at a rate of 100 frames/s with an exposure time of 9.4 ms. The recorded images were transfered to the computer and then evaluated in Image J (NIH) (Abramoff et al. 2004) by using a manual tracking MTrackJ (Meijering et al. 2006) plugin. As a result it was possible to track single RBCs through the middle plane of the PDMS microchannel.
2.1.3 RBC radial displacement and radial dispersion coefficient
The radial displacements (∆R) of the tracked RBCs were determined by using the following equation:
) ( ) ( )
(t R t0 t R t0
R = + −
∆ (2.1)
where R(t) is the radial position at time t, t0 is the initial time, and ∆R(t) is the radial displacement at time interval t.
Besides the calculation of the radial displacement (∆R), we have also analyzed the motions of RBCs by using a radial dispersion coefficient (Dyy) (Goldsmith and Turitto 1986, Ishikawa and Pedley 2007), given by:
(
)
=
− =
N
i
y i y
i yy
t R t R
N t D
1
2 , ,
2 ) 0 ( ) ( 1
)
( (2.2)
where R, t, N are the radial displacement, time interval and number of RBCs respectively.
2.2 Results and discussion
2.2.1 Blood flow visualization at several Hcts
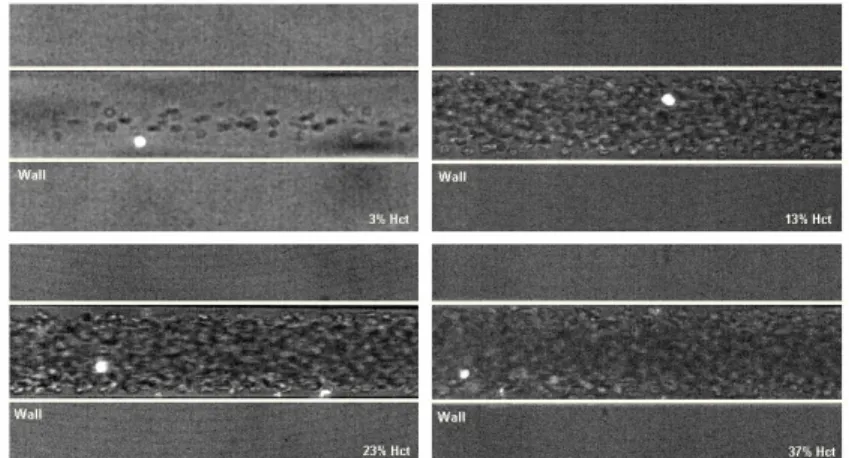
Figure 3 shows images with both non-labeled RBCs (halogen illumina-tion) and labeled RBCs (laser-emitted light) measured in centre plane of 75 µm circular PDMS microchannel at several Hcts (from 3% to 37%) with Re from 0.004 to 0.005.
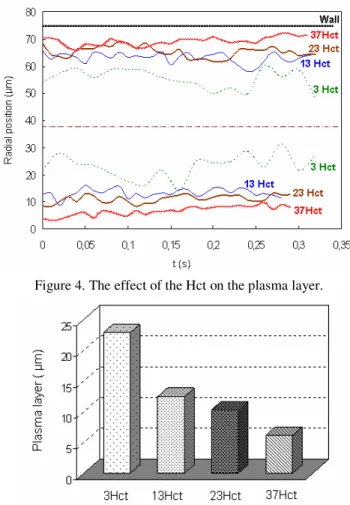
From Figure 3 it is possible to observe that the Hct decreases with the microchannel diameter which corroborates with the well known Faharaeus effect (Chien et al. 1984). Moreover, it is also evident that the plasma layer tends to increase by decreasing the Hct (see Figures 4 and 5). This latter phenomenon is related to the Fahareues-Lindqvist effect (Fahareues and Lindqvist 1931). Although this phenomenon is still not completely under-stood (Caro 1979), the most acceptable explanation is related to the ten-dency of the RBCs to migrate toward the microtube axis enhanced by the RBCs deformation and interations (Schmid-Schonbein and Wells 1969, Goldsmith 1971). A further consequence is that the apparent blood viscos-ity is reduced so that the flow resistance through the capillary also de-creases.
Figure 4. The effect of the Hct on the plasma layer.
2.2.2 Radial displacement in a 75µµµµm PDMS microchannel
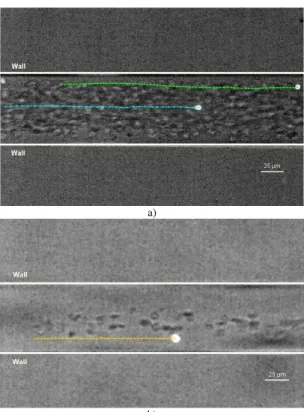
Figure 6a shows the effect of the radial position on the motion of la-beled RBCs flowing through a 75 µm PDMS capillary, for a feed Hct of about 13%. In addition Figure6b shows the radial displacement of a RBC flowing through microchannel with Hct of about 3%. The correspondent radial displacements (∆R) are shown in Figure 7.
a)
b)
Figure 7. Radial displacement (∆R) of labeled RBCs at several haematocrits (3% Hct and 13% Hct) and at different radial positions.
From Figure 7 it is clear that the RBCs radial displacement (∆R) for 13%Hct is higher than a RBC flowing within an Hct of 3%. In addition it is also possible to observe that the radial displacement (∆R) of the RBC flowing close to the plasma layer (12 µm from the wall) is around 3 times higher than the RBC (36 µm from the wall) traveling around the middle of the microchannel. These results suggest that RBCs flowing within the boundary region of RBC core appear to undergo the largest radial dis-placements. We believe that the random like transverse motions happening in this region are mainly due to multiple hydrodynamic interactions with neighboring RBCs which flow with lower velocity adjacent to the wall or tend to migrate away from the microtube wall towards the RBC core re-gion.
2.2.3 Radial dispersion in 75µµµµm PDMS microchannel at several Hcts
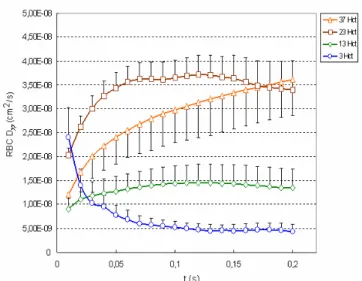
By measuring the radial displacement of labeled RBCs flowing through the microchannel for a known time interval, it was possible to calculate the correspondent dispersion coefficient (Dyy). Figure 8 shows the RBC
Figure 8. RBC averaged dispersion coefficient at the middle plane (Dyy) for sev-eral Hcts: 3%Hct, 13%Hct, 23%Hct and 37% Hct.
Figure 8 shows that the radial dispersion coefficient (Dyy) increases
with the Hct. The RBC Dyy for Hcts from 23% to 37% have almost one
or-der of magnitude greater than the Dyy with 3% Hct. These results clearly
reflect the RBCs radial displacement obtained in Figure 7.
Generally, our results demonstrate that the RBCs at dense concentra-tions exhibit higher erratic radial displacement when compared with di-luted suspensions of RBCs. Although it is evident that the RBC radial dis-persion rises with the increase of Hct at Hcts of about 24% it tends to level off (see Figure 9). Note that, these observations are consistent with several other measurements performed in glass microchannels (Goldsmith and Turitto 1986, Lima et al. 2008b).
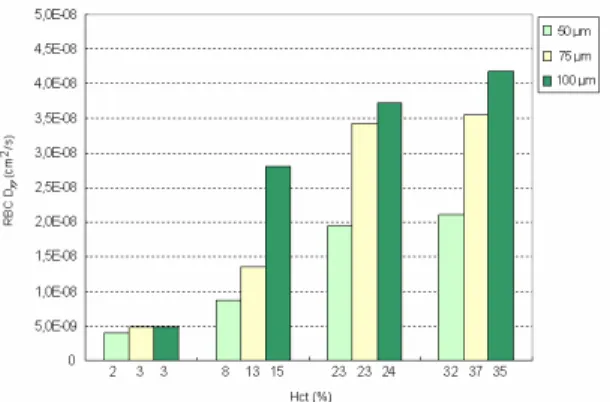
Figure 10. The effect of the microchannel diameter on the RBC Dyy.
The results from Figure 10 reinforce our previous measurements ob-tained from glass capillaries (Lima et al. 2008b). These data clearly dem-onstrate that RBC radial dispersion tend to decrease with the diameter. We believe that the main reason is due not only to Hct reduction with the di-ameter (Faharaeus effect) but also to the geometry constriction which lim-its the amplitude of the RBCs radial displacements.
3 Numerical flow model of multiple RBCs
3.1 Materials and methods
3.1.1 Microscale blood flow model (RBC flow model)
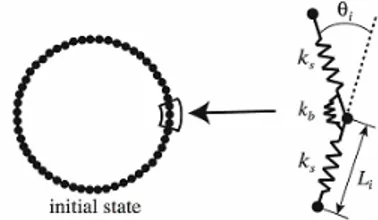
An RBC model developed by Wada and Kobayashi (2003) was adopted. This model is capable of expressing a biconcave shape of the RBC at rest as well as its elastic deformation while in motion. As shown in Fig. 11, the model was constructed by surrounding the internal liquid of RBC with RBC membrane consisting of N nodal points linked by a spring element.
Owing to deformation, elastic energies are generated and stored in RBC. The stretching energy Ws and bending energy Wb are modeled as
(
)
1 2 0 -2 1 N l l l ss k L L
W = = (3.1) = = 2 tan 2 1 2 1 l N l l b b l L k
W
θ
(3.2)where ks and kb are spring constants, N, Nl are the number of nodes and lines, Ll0 ,Ll are length of spring at the natural state and after deformation, θl is the contacting angle between neighboring elements. To maintain the
total area of RBC (actually it is volume in 3D), a penalty functions WA was
introduced. Mathematically, it was defined by
0 2 0 0 2 1 A A A A k
WA = A − , (3.3)
where subscript 0 denotes the natural state, Ne is the number of bending
springs, ka is a coefficient for the area constraint.
Figure 11. Red blood cell model. Nodal points on the membrane were connected by a mechanical spring. The neighboring springs were also linked by a bending spring.
RBC membrane. The potential function Ψ for nodal point i is a summation of interactive forces from all neighboring nodal points as formulated by
= = Ψ = Ψ N i N j ij 1 1 (3.4)
where Ψij is the potential function on nodal point i from nodal point j on
neighboring RBC.It is given by
≤ ≤ ≤ − − = Ψ ij ij ij ij r ij z for z for z z k 0 0 0 1 2 tan 2
π
π
(3.5)where zij = dij /δ −1, dij is a distance between nodal points i and j, and δ is
equilibrium distance. According to this function, a repulsive force acts when they are come much closer. In the present simulation, the equilib-rium distance δ is set to L0 which is natural length of a spring.
An interactive force working between an RBC and a vessel wall is mod-eled in a way similar to the interactive force between two RBCs. The po-tential function Z for nodal point i is expressed by a summation of interac-tive forces from all neighboring nodal points as formulated by
= Ζ = Ζ N i i 1 (3.6)
where Ζi is the potential function on nodal point i from nodal point j on
neighboring RBC, which is given by
≤ ≤ ≤ − − = i i i i w i z for z for z z k Z 0 0 0 1 2 tan 2
π
π
(3.7)where zi = Di /δw −1,Di is the distance between nodal point i and the wall,
kw is a parameter to express the magnitude of a repulsive force, and δwis
an equilibrium distance. Here, δwwas set to the same as δ.
Modeling of a fluid force fi working on an RBC is made separately for
forces fni and fti which respectively work in normal and tangential
direc-tions to a line element i of an RBC membrane. On the basis of the conser-vation of momentum, the normal force, fni working on a line element i of
the RBC membrane is modeled as
2 ni i ni L v
f =
ρ
(3.8)where ρ is a density of plasma, and vni is a normal component of the
veloc-ity difference between an RBC and a plasma flow. The tangential force ft
velocity at a distance from an RBC membrane is the same as a flow ve-locity at the RBC membrane, the tangential force fti that works on a line
element i can be approximated as
∆ = p i ti ti L v
f
µ
(3.9)where µp is a viscosity of plasma, vti is a tangential component of vi. The
equivalent distance ∆ in Eq. (3.9) was estimated from Oseen flow theory where a two-dimensional cylinder with a radius of a falls down in a vis-cous fluid. The distance ∆ is therefore
0 . 8 0 . 1 Re 0 . 8 ln 0 .
2 − + a
=
∆
γ
(3.10)where Re is the Reynolds number determined from a relative velocity of the cylinder to a fluid and a diameter of the cylinder and γ is Euler constant (= 0.57721). In the present study, a is set to be comparable to the size of an RBC. Note that the fluid force is assumed not to work when a distance be-tween two RBCs is less than δ for presuming the situation that they are in touch.
Given elastic energies and fluid forces, the motion of nodal point i
placed on RBC membrane was determined from
(
i g)
i ii
mr +
γ
r −r =F +f (3.11)where a dot means a time derivative, ri is the position vector of nodal point
i, m is mass of the nodal point, and fiis a fluid force (=fti+ fni).Based on
the virtual work theory, an elastic force Fi is given by
i i W r F
∂
∂
= (3.12)
Ζ + Ψ + + +
=Ws Wb Wa
W . (3.13)
3.1.2 Macroscale blood flow model (Continuum flow model)
A macroscale blood flow at a steady state is modeled as a continuum expressed by the Navier-Stokes and continuity equations;
+ + − = i j j i j i j i j x u x u x x p x u u
∂
∂
∂
∂
∂
∂
∂
∂
∂
∂
Re 1 (3.14) 0 = i i x u∂
∂
(3.15)where ui is a flow velocity component and p is a pressure. In general, fluid
blood flow. However, it is not true in small arteries due to spatial variation of RBC concentration. We here introduce a Hematocrit function F(Hct) to the viscous term of the Navier-Stokes equation in order to express a local viscosity dependent on a local hematocrit.
Blood flow is often represented by Casson model. Shiga et al. (1979) obtained an empirical formula of the relationship between Casson viscosity ηc and hematocrit Hct as
Hct
ln =k⋅
p c
η
η
(3.16)
where ηp is a plasma viscosity and k is a constant. Based on this equation,
we express the hematocrit function F as
[
Hct]
exp ⋅ = = k F p c
η
η
, (3.17)
whereby the Navier-Stokes equation is rewritten as
[
⋅]
+ + − = i j j i j i j i j x u x u x k x p x u u∂
∂
∂
∂
∂
∂
∂
∂
∂
∂
Re Hct exp (3.18).In the actual simulation of a macroscale flow, we solve Eqs. (3.15) and (3.18) by a finite element method.
3.1.3 Geometry model of a small vasculature
The present study solved blood flowing between a two-dimensional par-allel plate flow channel. The x-axis and y-axis were respectively set in ax-ial and radax-ial directions of the channel. For the microscale simulation, 108 RBCs were put in the channel with height of 96 µm and length of 44 µm. In this case, Hct is 0.31. A periodic boundary condition was assumed for both x-ends of the channel. For the macroscale flow analysis, the channel is extended to 480 mm. The flow region was divided into triangular finite elements. The total numbers of nodal points and elements were 2500 and 4752, respectively.
3.1.4 Simulation condition
Table 1 Parameters used for the simulation
Number of nodes, N 60
Mass, m 1.0x10⁻¹⁵ kg
Spring constant for stretching, ks 1.0x10⁻¹⁷ J
Spring constant for bending, kb 1.0x10⁻¹⁸ J
Spring constant for the area constraint, ka 1.0x10⁻¹⁶ J
Viscosity of the red blood cell membrane,
γ
1.0x10⁻¹⁰ kg/s3.1.5 Simulation procedure
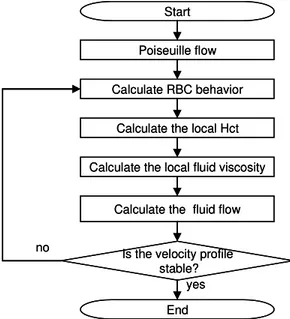
A flowchart of the simulation is shown in Fig. 12. Assuming with Poiseuille flow as an initial axial flow, the microscale flow is calculated. When the radial distribution of RBCs becomes stable, the calculation is stopped, and the Hct functions are obtained for flow segments defined by radially subdividing the flow channel by N to incorporate the influence of the local variation of an RBC distribution into the macroscale flow analy-sis. The macroscale flow simulation is performed until a fully-developed axial velocity profile is obtained. With this velocity profile, the simulation is back to the microscale simulation. This process is repeated until a change in the axial velocity profile after the microscale flow simulation is negligible. In the present simulation, N = 8.
Calculate the local Hct Start
Calculate the local fluid viscosity Calculate RBC behavior
Calculate the fluid flow Poiseuille flow
End Is the velocity profile
stable? yes no
Calculate the local Hct Start
Calculate the local fluid viscosity Calculate RBC behavior
Calculate the fluid flow Poiseuille flow
End Is the velocity profile
stable? yes no
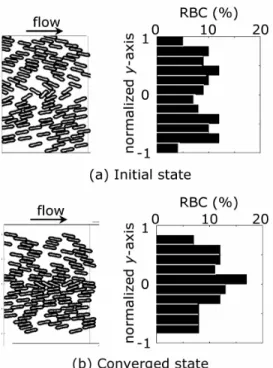
Figure 13. Comparison of RBC distribution between the initial state (a) and the converged state (b).
3.2 Result
The results showed a drastic change in the distribution of RBCs with progress of the simulation. The spatial distributions of RBCs at the initial state and the converged state are shown in Fig. 13. On the right of each fig-ure, the percentage of RBCs in each flow segment at each state is plotted. At the initial state, RBCs were distributed almost uniformly in a radial di-rection and were found near the wall the initial state. As RBCs were car-ried downstream by a fluid flow, they inclined and migrated to the center of the flow channel. As a result, RBCs were concentrated around the cen-ter and barely found near the wall, forming a plasma layer.
The axial velocity profiles at the initial and converged states are de-picted in Fig. 14. At the initial state, the velocity profile was parabolic as given. With progress of the simulation, there was a tendency that velocity at the center of the flow channel decreased while that near the wall in-creased. At the converged state, the axial flow took a rather flat velocity profile as seen in Fig. 14. The maximal velocity at the converged state de-creased by 13.7 % compared to that of the Poiseuille flow.
3.3 Discussion
A blood flow property in a small vasculature was analyzed by interac-tively simulating macro- and micro- scale blood dynamics. The results of the microscale flow simulation showed that RBCs gathered around the center of the flow channel and a plasma layer near the wall at the con-verged state. On the other hand, the macroscale flow showed a flat velocity profile. These flow features are quite similar to the in vivo observations (Oka 1984, Cloutier et al. 1996). It is therefore considered that the simula-tion results represent the process of how the microscopic flow influences the macroscopic flow.
4 Conclusions
Quantitative description of the flow behavior of labeled RBCs in both diluted and concentrated suspensions were studied under a confocal micro-PTV system. The experiments were performed in the middle plane of 75 µm circular PDMS microdevice at low Reynolds numbers (Re ~ 0.004) by using Hcts from 3% up to 37%. Our experimental results suggest that the RBC paths are strongly dependent on the Hct and as a result both RBC ra-dial displacement and RBC rara-dial dispersion increase with the heama-tocrict. Moreover, our results also indicate that RBCs flowing around the plasma layer appear to undergo the largest radial displacements. The con-focal micro-PTV system used in the present work is proved to be a power-ful technique to measure the motion of labeled RBCs at different Hcts through a circular PDMS microchannel.
A novel computational scheme for the analysis of the mesoscopic blood rheology was proposed. The scheme was applied for the analysis of blood flow in a small vasculature. The simulated flow dynamics were in good agreement with the Casson flow model and in vivo observations. These results addressed the potential of the present computational approach to the analysis of the rheology of blood in small vasculatures where non-Newtonian property of blood is significant.
By comparing both results we hope in the near future to clarify a vari-ety of complex phenomena occurring at the microscale level.
Acknowledgements
References
Abramoff M., Magelhaes P., Ram, S. (2004) Image Processing with Image J. Bio-photonics International 11: 36-42.
Caro C., Pedley, T., Schroter R., Seed W. (1978) The mechanics of the circulation. Oxford University Press.
Chien S., Usami S., Skalak R. (1984) Blood flow in small tubes In: Handbook of Physiology – The cardiovascular system IV, pp 217-249.
Cloutier G., Qin Z., Durand L.G., Teh B.G. (1996) Power Doppler ultrasound evaluation of the shear rate and shear stress Dependences of red blood cell aggregation.IEEE Trans. Biomed. Eng. 43: 441-450.
Fahraeus R., Lindqvist T (1931) The viscosity of the blood in narrow capillary tubes. Am. J. Physiol. 96: 562-568.
Goldsmith H. (1971) Red cell motions and wall interactions in tube flow, Federa-tion Proceedings 30: 1578-1588.
Goldsmith H., Marlow J. (1979) Flow behavior of erythrocytes. II. Particles mo-tions in concentrated suspensions of ghost cells, Journal of Colloid and Inter-face Science 71: 383-407.
Goldsmith H., Turitto V. (1986) Rheological aspects of thrombosis and haemosta-sis: basic principles and applications. ICTH-Report-Subcommittee on Rheol-ogy of the International Committee on Thrombosis and Haemostasis. Thromb Haemost. 55: 415–435.
Ishikawa T., Pedley T., (2007) Diffusion of swimming model micro-organisms in a semi-dilute suspensions. Journal of Fluid Mechanics 588: 437-462.
Lima R., Ishikawa T., Imai, Y., Takeda, M., Wada, S., Yamaguchi, T. (2008a) Microhemodynamic measurements in concentrated suspensions of Red Blood Cells using a confocal micro-PTV system (under revision to Annals of Bio-medical Engineering).
Lima R., Ishikawa T., Imai, Y., Takeda, M., Wada, S., Yamaguchi, T. (2008b) Radial dispersion of red blood cells in blood flowing through glass capillaries: role of heamatocrit and geometry (under revision to Journal of Biomechan-ics).
Lima R. (2007) Analysis of the blood flow behavior through microchannels by a confocal micro-PIV/PTV system. PhD Thesis, Tohoku University, Japan. Lima R., Wada, S., Takeda, M., Tsubota, K., Yamaguchi, T. (2007a) In vitro
con-focal micro-PIV measurements of blood flow in a square microchannel: the effect of the haematocrit on instantaneous velocity profiles. Journal of Bio-mechanics, 40: 2752-2757.
microchan-nel: experimental observations using a confocal micro-PIV system. Biomedi-cal Microdevices 10: 153-167.
Lima R., Wada, S., Tsubota, K., Yamaguchi, T. (2006) Confocal micro-PIV measurements of three dimensional profiles of cell suspension flow in a square microchannel. Measurement Science and Technology 17: 797-808. Meijering E., Smal I., Danuser G. (2006) Tracking in Molecular Bioimaging,
IEEE Signal Processing Magazine, 23: 46-53. Oka S. (1984) Biorehology, Shokabo, Tokyo.
Park J, Choi C, Kihm K. (2004) Optically sliced micro-PIV using confocal laser scanning microscopy (CLSM). Experiments in Fluids 37: 105-119.
Schmid-Schonbein, H., Wells, R. (1969) Fluid drop-like transition of erythrocytes under shear. Science 165: 288-291.
Shiga T., Maeda N., Suda T., Kon K., Sekiya M., Oka S. (1979) Rheological and kinetic dysfunctions of the cholesterol-loaded, human erythrocytes, Biorheol-ogy, 16: 363-369.
Tanaami T, Otsuki S, Tomosada N, Kosugi Y, Shimizu M. Ishida H. (2002) High-speed 1-frame/ms scanning confocal microscope with a microlens and Nip-kow disks. Applied Optics 41: 4704-4708.