Behavioural patterns towards innovation: the case of European rural regions
Maria Teresa de Noronha Vaz*; Marisa Isabel Silva Cesário** * Faculdade de Economia, Universidade do Algarve, [email protected] ** Faculdade de Economia, Universidade do Algarve, [email protected]
Abstract
Contrarily to big firms, small firms interact intensively with the territory in which they locate, as a signal of their embeddedness. The particular tight links they develop with their external environment reduce uncertainty risks. In general, for them, geographical and sociological proximities constitute the main sources of assets and information determining their perspectives and strategic choices.
The present study uses a set of enquires, developed within the framework of a European research project, with the purpose of modelling the determinants of innovation in a bi-univocal relationship of interdependencies between small firms and their environmental contexts. We dealt mainly with lagging regions and a panel of 323 firms from the agro-food sector, located in 11 different European rural regions from six different countries.
Using a set of variables able to characterise the innovative processes and through the application of k-mean clusters statistical analysis, it was possible to detect behavioural patterns towards innovation among those firms. Non-innovators, pioneer innovators and follower innovators were the identified patterns. Using cross tabs analysis between those patterns and a set of attributes dealing with the importance of human capital, the profile of each group were drawn.
Key words: patterns of innovation, determinants of innovation, regional innovation systems, rural areas
1. Introduction
During the last two decades the tendency to accept SMEs as major factors of regional dynamics as strengthened. The moments of economic crises have permitted to reveal the inadequacies of big firms to new emerging industrial models more related to systems of flexible production. Easy learning capabilities and stiffness to integrate changing processes has become the present advantage of the small firm as a source of economic growth and employment. The permanent recognition of such fact by policy makers and the European Commission as created much enthusiasm towards the reorganization of the production activity within most of the European countries. Many successful experiences of SMEs can be observed, as well as the proliferation of many phenomena of downsizing and outsourcing, particularly in the services sector. Such a desegregation process of productive systems, in some cases financially supported by the EC, is simultaneously contributing to regional indirect or direct positive effects. Aware of such effects, many regions have restructured based on the need to reshape their regulatory and institutional contexts in order to better frame some of the SMEs requirements.
Trying to explain the raising importance of the small firm during the last 20 years, Julien (1995) supplies an explanation based on internal and external factors to the firm. The first group of arguments connects the increasing market segmentation to the existence of scale diseconomies in certain activities branches. The second one results from the development of new technologies, more adapted to the small dimension. Still, the high unemployment rates generating increases in self employment is an additional reason for policy makers to support the small firms and the self employment. It is worthwhile noting that the set of circumstances could be simply considered of cyclic or short term nature, taking place only whereas big firms are not adapted and need to recover their market shares.
But the economic importance of SMEs is due to a larger panel of reasons: the role of firm leaders in the economical changes in general, the existence of markets, particularly adapted to SMEs, the growth incertitude in the economic cycle and the imposition of flexible choices upon producers. In the first case the entrepreneurial aptitude of firm leaders is discussed. How are such agents able to face the new directions of a changing society? In the case of SMEs, for which the strategic choices generally are not dissociated from personal interests, entrepreneurship deals with psychological attitudes and preferences. On the other
hand, suggesting that the economy, as a complexity, generates market forms which dynamics are not adapted to the large scale production, imposes firms a permanent adapting process to new business opportunities. Therefore, the growing market diversification and the speed at wish changes occur take us to the third argument, the uncertainty. Traditionally, the reply of the big firms to uncertainty was related to its growth, increasing scale economies and market control. Such strategies are unfeasible for SMEs. Not able to control risk, they are obliged to keep flexible managing their procedures with few administrative or organizational charges.
Contrarily to big firms, SMEs interact intensely with the territory in which they locate, as a signal of their embeddedness. The particular tight links they develop with the external environment also reduce uncertainty risks. In general, SMEs do not only locate nearby the residence of their owners but also the geographical and sociological proximities constitute their main sources of assets and information. This fact determines the perspectives and strategic choices of the firms, because most of the market perception arises from the inputs that the territorial institutional context supplies them. Growth determinants as competition capability, political understanding, and knowledge or consumption behaviour do result from the external environment of the firm. Not surprising that the attributes of such environments become, therefore, a crucial factor for the development of entrepreneurship. Improving also inter-firm cooperation, the institutional framing is the better guarantee for the links between SMEs and its external environment. Not always such links conduct to the development of innovative activities in the firms, however. This is the main reason not to despise the internal sources of innovation as the formation of human capital and the level of networking aptitudes within the firm.
The contribution of SMEs to the territories is the other side of the coin in these analyses. The issue has long been developed by Maillat (1991), who pointed out the strategic role of the small firm for the local development, particularly if such firms do manage innovative activities. In this context, innovation in SMEs becomes a major issue for discussions related with regional development policies (see contributions of Vaz, 2004 and Vaz, Cesário and Fernandes, 2006). Is it possible to awake the need for innovation in SMEs and use them as incubators for local development? If so, how do firms behave when they are innovative? Which determinants have a more effective impact on the innovative choices of small firms?
2. Tangible and intangible determinants of innovation
In order to be able to answer the previous questions, a review on the complexity related to the phenomena of innovation comprehending a clear understanding of the tangible and intangible nature of its determinants is required.
For a long time capital investment was considered to be the driving force of economic growth. More recently, however, the importance of technological change has been stressed. Still, most of the developed literature in this area was dealing with tangible assets as determinants of innovation including the pioneering work of Solow (1956) who investigated the growth of output in the USA using a neoclassical economic growth model. Since than, much changed in this initial model: for example, Arrow's model (1962) introduced the concept of
learning by doing as a determinant of technological development; later, the
inclusion, by Lucas (1988) of human capital as a determinant of technical change was another major step and in 1986 and 1990, Romer considered technical change endogenously determined by research. The spills over effects resulting from such approaches were explored in the Marshall-Arrow-Romer model, as discussed by Acs and Audretsch (1984), Audretsch (2002) and nowadays, the technological innovation output is understood as the product of an enlarged knowledge base generator of multiple inputs. The discussion is reaching a peek for which the determinants of innovation do integrate almost completely a set of intangible assets. No wonder that, as Markussen (1999) pointed out, the considerable economic literature regarding innovation shows a tendency to fuzziness in the use of concepts regarding the interface among technical change, innovation and knowledge in spite of a clear neoclassical path.
One of the vertices towards which technical change, innovation and knowledge converge is the organisation's capacity to learn. Although intangible, such major driver can be related to factors internal or external to the firm, particularly if human capital can serve to perceive the nature of such learning capacity. In this study we have used as proxys of “the organisation's capacity to learn” the following variables: multiple characteristics of the top managers, skills and training for the workforce or other aspects such as interactions with suppliers, customers, industry associations and public support bodies. All these aspects do determine firms’ capacity to innovate and shape several typical entrepreneurial behaviours worth investigating.
3. Methods
The present empirical analyses uses a set of enquires developed within the frame work of an European research project whose main goal was to model the determinants of innovation in a biunivocal relationship of interdependencies between small firms and their environmental contexts. We dealt mainly with lagging regions and the questionnaires were used in 323 firms located in 12 different European rural regions of six countries.
In this particular case, clustering techniques based on variables related to the history of the firm, sources of capital and governmental support characterised the three groups of firms as non innovators, innovators and followers. Their choices concerning firm leadership, skills of the labour force and interaction with other stakeholders, issues earlier discussed in the theoretical framework of this paper, have been studied and compared.
3.1. Sectorial characteristics of the analysed sample
The food and drinks processing industry was selected as the observation field. The reason for this choice is that, in Europe this sector contemplates the presence of large numbers of small firms, many of them closely linked to both farming and household activities (Gellynck, Verbeke and Viaene 2003). In this particular case, competitive pressures, economies of scale, and social change have developed the meaning of size over time (Burns 1983) in the agro-food activity. Indeed, some authors emphasized this as its prevailing characteristic (Smallbone, Cumbers and Leigh 1996).
Knowing however from the existence of many small firms that survive due to choices in very narrow market segments, particularly in France, we argue to be in presence of a branch of activity with mixed tendencies: still, the classical model of scale economies prevails and already, some market niches are developing in presence of a new industrial model related to flexible production.
Usually this industry is defined as 'low tech' (OECD definition) integrating low levels of research and development expenditure, especially among smaller firms. Several reports from the EU (European Commission 2000) have shown that few employed within this industry had completed a higher degree. This suggests a tendency for the existence of lower skills in the sector. In spite of this and probably due to very severe market pressures the agro-food sector detains a significant rate in the introduction of new products and processes (Galizzi and Venturini 1996). The existent dynamism in the process of innovation in the
industry (Nicolas and Vaz, 2000) must be accepted as a main form for competitive advantage (Grunert, Harmsen et al. 1997a, 1997b and Grunet and Ottowitz, 1997). Also, organisational innovation is being recognised (as in Green, Lanini and Schaller, 1996) increasing the opportunities for smaller producers as consumers seek permanently differentiated food products (Ilbery and Kneafsey 1999). New forms of marketing channels are being explored (Verhaegen and van Huylenbroeck 2001).
No doubt that the impact of such product, process and organisational innovation may play a particularly important role in motivating local economic development.
3.2. Choice for the location of the firms
Several basic criteria served to guide the choice of areas to be observed (Table 3.2 shows the regional provenience of the investigated firms) as Morgan and Crawford (2004):
Administratively discrete: It was important to identify territories for which official economic data could be collected and, as far as possible, that the territories were at a similar level in the different areas.
Lagging and peripheral: This was defined both economically and geographically. In economic terms, these were areas that had lower levels of economic development than the national average. From a geographical standpoint, there was particular interest in more remote areas where levels of communications infrastructure also compared unfavourably with other, more developed regions. Rural: The study focused on rural development and the place of the food industry within it and so it was important that the chosen areas were those in which agriculture played an important role. Territories dominated by large, urban populations were generally to be avoided.
Contrasting: The two regions chosen in each case should provide contrasting developmental levels for comparative purposes.
The application of the questionnaire was duly taken with the help of an instruction guide helping to standardize the possible answers to doubts and possible question. The long size of the forms obliged the support personal to follow strict directions. This step took a full semester. At the end of the field data collection phase, a total of 323 answers have been obtained. As discussed earlier, enterprises were chosen for inclusion in the study on the basis of size rather than the sub sector of the industry in which they operated. As Table 3.2.2 shows, the resulting sample covering a wide range of food and drink processing activities
with certain sectors such as meat, fruit and vegetables, dairy products and drinks accounting for a sizeable proportion of the total sample.
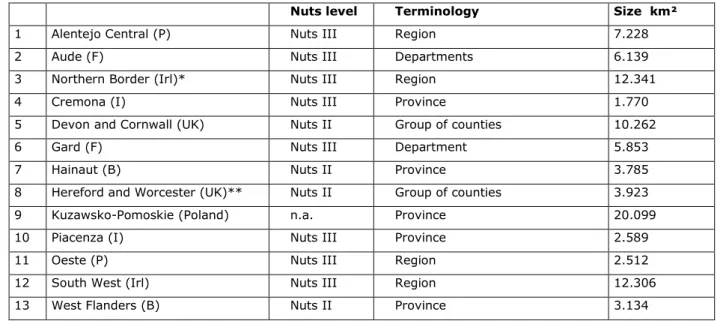
Table 3.2.1 Territorial systems by NUTS level, administrative designation and size
Nuts level Terminology Size km²
1 Alentejo Central (P) Nuts III Region 7.228
2 Aude (F) Nuts III Departments 6.139
3 Northern Border (Irl)* Nuts III Region 12.341
4 Cremona (I) Nuts III Province 1.770
5 Devon and Cornwall (UK) Nuts II Group of counties 10.262
6 Gard (F) Nuts III Department 5.853
7 Hainaut (B) Nuts II Province 3.785
8 Hereford and Worcester (UK)** Nuts II Group of counties 3.923 9 Kuzawsko-Pomoskie (Poland) n.a. Province 20.099
10 Piacenza (I) Nuts III Province 2.589
11 Oeste (P) Nuts III Region 2.512
12 South West (Irl) Nuts III Region 12.306
13 West Flanders (B) Nuts II Province 3.134
Source: National statistics
*Only a part of the Nuts III region has been selected
**Nuts II region includes the county of Warwickshire. However, in this research, Warwickshire is excluded for the sake of homogeneity.
3.3. Some generic characteristics of the respondents
Before proceeding to the multivariate statistical analyses we have observed some of the characteristics of the whole respondents, in this case mostly firm leaders, concluding that a wide variation in the average age of the enterprises could be detected. Belgium has firms more mature in general (forty years respectively) then Ireland and England (average age was less than twenty years). Poland had the youngest average age of the enterprises at fourteen years while France had a large number of very old established enterprises so the average age was not computed. Also, family owned enterprises constitute nearly ninety percent of the sample in England.
Top managers are much older in England (more than half the top managers were more than fifty years) then in Belgium, Ireland, France and Poland. However, the proportion of enterprises having young top managers (less than thirty years old) is small (less than 10 percent) in most of the countries. France is the exception with fifteen percent of enterprises in this category.
The educational level of the enterprise managers was measured using indicators related with the post school qualifications or higher degree. Here also many asymmetries are to be observed: about one third of the enterprises in Belgium, France, Ireland and England had managers with post school qualifications. Poland and Portugal are lagging behind with only one fifth of their managers in this category.
Table 3.2.2: Size distribution of food manufacturing enterprises (by no of enterprises)
Number of employees 1-9 10 – 19 20 - 49 Total Belgium Hainaut Relevant population 50 17 14 81
Target sample 7 7 16 30
Actual sample 6 11 10 27
West Flanders Relevant population 94 41 57 192
Target sample 4 6 20 30
Actual sample 5 7 18 30
France Aude Relevant population 180 29 13 222
Target sample 15 7 8 30
Actual sample 17 6 7 30
Gard Relevant population 151 25 22 198
Target sample 12 6 12 30
Actual sample 9 10 11 30
Ireland Border Relevant population 37 15 11 63
Target sample 7 9 14 30
Actual sample 12 12 6 30
Southwest Relevant population 59 16 24 99
Target sample 6 6 18 30 Actual sample 8 13 9 30 Poland Kujawsko-Pomorskie Relevant population 1507 219 150 1876 Target sample 13 10 12 35 Actual sample 11 11 14 36
Portugal Oeste Relevant population Target sample Actual sample 5 3 14 22 Alentejo Central Relevant population Target sample Actual sample 17 8 5 30 UK Devon and Cornwall Relevant population 174 24 23 221 Target sample 13 6 11 30 Actual sample 12 7 11 30 Hereford and Worcester Relevant population 76 17 10 103 Target sample 12 8 10 30 Actual sample 10 10 10 30
3.4. The quantitative approach
Considering the multiple forms associated to the concept of innovation (product innovation, process innovation or organizational innovation) and accepting the hypothetical intangibility of the concept, the following list of indicators is suggested (see Vaz and Cesário, 2004) to appreciate the level and type of innovativeness in the whole set of studied firms:
Introduction of new or substantially modified products
Introduction of new or substantially modified production processes Introduction of innovation at the level of:
o Product composition – new ingredients
o Product composition – new packaging material o Visual appearance
Introduction of organisational innovation (including management, marketing, financial structure, production, R&D, logistics or others)
Newness of product innovation to the market
The quantitative approach uses such variables for an application of multivariate statistics, K-means clusters: three different firms’ behavioural patterns have been detected. The history of the firms, their sources for starting capital and the way how governmental supports have been used contributed to the description of the clusters’ main characteristics. The forms how the firms in each of the different groups had used the sources of innovation permitted to distinguish them in non
innovators, pioneers and followers.
The significance level of the innovation variables used was tested by ANOVA. The table in Annex 2 supplies the results of this test and confirms that all variables revealed a statistically significant contribution to the clustering process.
In a posterior exercise, the use of cross tab analyse served to detect clearer behavioural patterns in what concerns the intangible assets related to human capital. The results have been presented in spider graphs in order to facilitate a comparative evaluation.
4. Results
4.1. Behavioural patterns towards innovation
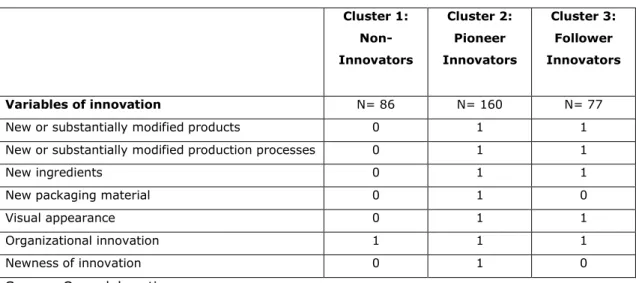
As earlier pointed out, the application of statistical analysis to the set of 323 firms, resulted in three distinct groups, each one representing a different behavioural pattern towards innovation. Table 4.1 gives us for each group the values of the key identification variables: indicators that measure the level and type of innovativeness. To note that for analytical purposes the value 1 indicates Yes (the referred cluster performs that type of innovation) and value 0 indicates No (the referred cluster does not perform that type of innovation).
Table 4.1: Patterns of innovation – results from K-mean cluster analysis Cluster 1: Non-Innovators Cluster 2: Pioneer Innovators Cluster 3: Follower Innovators Variables of innovation N= 86 N= 160 N= 77
New or substantially modified products 0 1 1 New or substantially modified production processes 0 1 1
New ingredients 0 1 1
New packaging material 0 1 0
Visual appearance 0 1 1
Organizational innovation 1 1 1
Newness of innovation 0 1 0
Source: Own elaboration.
Cluster 1 is composed by 86 firms and is mainly characterised by lack of innovation. Those firms belonging to the group only performed organisational changes inside their units. They are located essentially in the Portuguese regions Alentejo Central (19%), and Oeste (12%), the Belgium region of West Flanders (14%) and the Irish regions of South West (13%) and Border (11%). Please see Annex 1 for detailed information on the percentages of the other regions. They will be labelled as the Non-Innovators.
Cluster 2 is composed by 160 firms, representing the higher innovative level. The firms included in this group perform all the types of innovation listed previously. As their innovative initiatives are also new to the market, they will be labelled as
Pioneers. Firms belonging to this cluster are mainly coming from The British areas
of Devon/Cornwell (17%) and Hereford/Worcester (16%) and the Polish region Kuzawsko-Pomorskia (15%).
Cluster 3 is composed by 77 firms and distinguishes from the other two due to two factors: the high level of innovation performed in the firms but, contrarily to the previous case, innovation developed is not new to the market. This is the reason why the group as been labelled as Followers. This cluster is mainly composed by the French regions of Aude (27%) and Gard (14%).
Our research clearly indicates a negative correspondence between the firm age and its aptitude to innovate. Innovators registered the lower weight of firms with more than 10 years. Only in this group, new firms, with less than 5 years, were found. Non innovators are greatly composed by aged firms.
All the 3 groups mainly chose the option Personal or family idea when asked about the main sources of the original business idea. The same happened with the business location, with personal or family reasons predominating homogeneously. Considering that we are dealing with very small firms from agro-food sector, such choices based on familiar roots were to be expected.
Retained earnings were the mainly used source of capital for the 3 groups in a very similar way. This source was followed by bank loans, particularly in the case of Innovators (70% of firms in this group used this source). Followers were the ones that most asked for subsidies (29% against 14% from non-innovators and 10% from pioneers).
Regarding the used sources for innovative activities, and excluding the Non
innovators, we can find some slightly differences between the two clusters
performing innovation.
When improving production processes, in-house developments were the main starting point for both groups (58% of firms with affirmative answers in pioneers against 62% in followers). Equipment suppliers were indicated as the following main source of process innovation (35% for Innovators and 34% for Followers). Hereby, Innovators have a higher proportion of contacts abroad comparing with
Followers.
Also customers have a similar effect, however with less importance than the previous. For the Followers, more important than customers were similar firms (29% of firms in this group used this source), a natural source for imitators. Regarding the development of new products, again in house developments were the main used source (83% affirmative answers by Innovators and 62% by
Followers). However, contrarily to what stated before, when developing new products, firms also use customers as an important source (57% by Innovators and 51% by Followers) as they function as drivers for innovation by ways of market pressure.
4.2. The organization’s capacity to learn in the behavioural patterns of small firms
In order to be able to better identify the importance of specific assets related to human capital we have observed in detail some of the attributes of the three clusters: characteristics of the top manager (TM), skills of the labour force and interactions with other agents internal or external to the region.
Figure 4.2.1: Characteristics of the TM
0% 50% 100% Higher degree Qualification in Business Qualification in Technology Less then 5 years as TM
Involved within the region 1
2 3
Figure 4.2.1 presents the relative perceptual heights of the different attributes that characterize TMs. The comparative graph identifies the three groups of firms, concluding about those characteristics that are more distant from the innovative behaviour: in this case they are very few and quite tenuous. In spite of the fact that Followers do have a higher number of TM with higher education this attribute does not seem to be a very determining one in what concerns different attitudes between Innovators and Non innovators. In any case still many firms do not have TM with higher education. In those cases when it exists, around 25% is formation in business or economics and 27% in technology or engineering. The Non
innovators and Followers tend to hire more TMs in the technological areas. Innovators and Followers have more TMs that are recent in their position (less
then five years). Another attribute that we have analysed is the involvement of the TM to the region. It was very curious to observe that Innovators do not look
case for the Followers, which from the three groups have the highest percentage of TMs with regional links.
Figure 4.2.2: Skills of the labour force
0% 50% 100% Trainning Qualified emp < 25% Qualified emp > 25% 1 2 3
Figure 4.2.2 represents the relative perceptual heights of those attributes determining the degree of formation of the labour force in the observed firms. Training carried out by the firms as well as qualified technical formation of labour were the selected items. The number of firms having less then 25% employees with technical qualification is very high in all the three groups of firms and it is clear that innovators do have more trained personnel then the other groups. Training is an attribute that serves better then technical qualification to distinguish the behavioural patterns. There is a clear higher number of firms to have carried out training (81%) in the group of Innovators then in the Non innovators or even Followers (55% and 68%).
Figure 4.2.3: Interactions with other agents internal to the region
0% 20% 40% 60% 80% Equipment Suppliers Material Suppliers Customers Similar firm Research institution IT Specialists 1 2 3
Figure 4.2.3 helps to a better understanding of the role of the environment in the firms’ attitude towards innovativeness. If we compare the distance among the lines related to each group we realise that the interactions with other agents do represent determinants with a much higher level of significance to innovation then the previous two groups of attributes. This is the reason why we have disaggregated interactions (coordination) in internal and external to the region. We can point out that exchanges with suppliers located inside the region are less influent upon innovation. Still, the other set of considered factors is very important, particularly, when we compare Innovators and Followers to Non
Innovators. Those two groups have very similar attitudes regarding external
relations and in both cases the relations with customers, with information technologies specialists and research centres detach them from the non innovators.
Figure 4.2.4: Interactions with other agents external to the region
0% 20% 40% 60% Equipment Suppliers Material Suppliers Customers Similar firm Research institution IT Specialists 1 2 3
The interactions with agents located outside of the region occur less frequently, therefore are not indicating so clearly the importance of interaction because they take place. Nevertheless the tendencies persist. It is important to introduce the consideration of the example given by similar competitors that mainly in the case of interactions outside of the regions represent positive effects to innovativeness, particularly in the group of Followers. Figure 4.2.4 illustrates this argument.
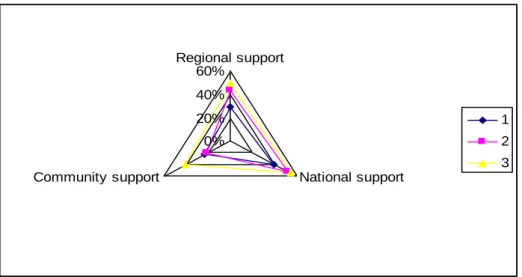
Figure 4.2.5: Governmental assistance 0% 20% 40% 60% Regional support National support Community support 1 2 3
Figure 4.2.5 illustrates how the three considered groups benefit from governmental assistance. This figure allows us to have very interesting conclusions: governmental support doesn’t seem to be directly correlated with innovativeness, although Followers (more than 40% of such firms) do need more support then Non-innovators or Innovators. A conclusion that is valid for the three considered forms of assistance: regional, national or from the European Commission (in which case this situation is more evident). The second conclusion is that independently from their behavioral pattern, firms tend to use more support from the national institutions then from the regional or European bodies. At last, we can observe that Non-innovators make, in general, much less use of governmental support at their disposal then others.
5. Conclusion
Regional analysts have explained the difference among the innovative capacity of regions as well as the relation among the effort put in innovation and the level of regional competitiveness determined basically by the performance of firms. Many have been the methods to describe and identify those causes underlining the sequence of cause-effect relationships in this complex phenomenon. This paper suggests observing firms behavioural pattern regarding innovation, using an extended sample of small firms located in peripheral European areas and considering some of the most important factors related with firms’ environmental conditions to learning.
The quantitative approach demonstrated the level of proximity between innovation and firms choices related to factors like: formation of the leadership, or labour skills, coordination with suppliers and clients, relationships with research institutions, external connections.
A detailed observation of the questionnaire would allow us to conclude new arguments like the importance of the quality standards imposed by clients in the achievement of stable relationships. This understated but powerful factor contribute significantly to increase the level of innovation of the small firm. The promotion of regional products or the interconnection of firms with chambers of commerce also increases the number of innovative actions taken by the small firm.
On the other side, curiously, the governmental support has served basically not to detect innovative profiles, but in many cases to generate financial viability in firms, suggesting an extended discussion on the economic efficiency of such aids.
References
Acs, Z. and Audretsch D. B. (1984) Small Business in Industrial Economics: the new learning, Revue d'Economie Industrielle, nº 67, pp 21-39.
Arrow, K.J. (1962) The Economic Implication of Learning by Doing, Revue of Economic Studies, 29, pp. 155-173.
Audretsch, D. (2002) The innovative advantages of US cities, European Planning Studies, 10, pp 165-176.
Burns, J.A. (1983) A Synoptic view of the Food Industry, in J. Burns, J. McInerey and A. Swinbank (Eds.), The Food Industry: Economics and Policies, Heinemann, London.
European Commission (2000) Panorama of European Business: data for 1988 – 99. Theme 4 Industry, trade and services. Luxembourg: Office for Official Publications of the European Communities.
Galizzi, G. and Venturini, L. (1996) Product innovation in the food industry: nature, characteristics and determinants, in G. Galizzi and L. Venturini (Eds.), Economics of innovation: the case of the food industry, Physica-Verlag, Heidelberg.
Gellynck, X., Verbeke, W., and Viaene, J. (2003) Food processing, in Johnson, P. (Ed.), Industries in Europe: competition, trends and policy issues. Edward Elgar. Cheltenham. Green, R. H., Lanini, L., and Schaller, B. (1996) Technical and organisational innovations in the food system: the case of fresh products in France, in Galizzi, G. and Venturini, L. (Eds.), Economics of Innovation: The Case of the Food Industry, Physica-Verlag., Heidelberg.
Grunert, K.G., Harmsen, H., Meulenberg, M., Kuiper, E., Ottowitz, T., Declerck, F., Traill, B., Göransson, G., (2) (1997a) Innovation in the food sector: a revised framework, in Traill, B. and Grunert, K.G. (Eds.), Product and Process Innovation in the Food Industry. Blackie Academic & Professional, London.
Grunert, K.G., Harmsen, H., Meulenberg, M., Kuiper, E., Ottowitz, T., Declerck, F., Traill, B., Göransson, G. (1997b), 'A framework for analysing innovation in the food sector', in B. Traill and K.G. Grunert (Eds.), Product and Process Innovation in the Food Industry, Blackie Academic & Professional, London.
Grunert, K.G., Ottowitz, T. (1997) Neumarkter Lammsbäu: brewing beer for Greens, in B. Traill and K.G. Grunert (Eds.), Product and Process Innovation in the Food Industry, Blackie Academic & Professional, London.
Ilbery, B., and Kneafsey, M. (1999) Niche markets and regional speciality food products in Europe. Towards a research agenda, Environment and Planning. A.31: 2207 –2222 p. Julien P. A. (1995) Economic Theory, Entrepreneurship and New Economic Dynamics, in: S. Conti, E. Malecki e P. Oinas (Eds), The Industrial Enterprise and its environment: Spatial Perspectives. Avebury, England, pp 123 - 142.
Lucas, R.E. (1988), On the Mechanics of Economic Development, Journal of Monetary Economics, 22, pp 92-96.
Maillat, D. (1991) PME et Systeme Territorial de Production, in C. Fourcade (Ed), Petite Enterprise et Développement Local. Editions Eska, Paris, pp 178 – 200.
Markussen A. (1999) Fuzzy Concepts, Scanty Evidence, Policy Distance: the Case for Rigor and Policy Relevance, Critical regional Studies, Regional Studies, Vol 33,9, pp 869-884. Morgan, E. and Crawford, N. (2004) Research Design: Territorial Systems and the enterprise survey, in Vaz et al. (Eds), Innovation in Small Firms and Dynamics of Local Development, Scholar Publishing House, Warsaw, pp 32-61.
Nicolas, F. M. e Vaz, M. T. N. (2000) State of art in instruments for local development, SMEs and VSEs, Public report D1, contract nº HPSE-1999-00024.
Romer P. M. (1986) Increasing Returns and Long Term Growth, The Journal of Political Economy, 94, pp 1002-1037.
Romer P. M. (1990) Endogenous Technological Change, The Journal of Political Economy, 98 (5) pp 71-102.
Smallbone, D., Cumbers, A., and Leigh, R. (1996) The single market process and SMEs in the UK food processing sector, International Small Business Journal 14, 4: pp 55- 71. Solow (1956) A Contribution to Theory of Economic Growth, The Quarterly Journal of Economics, 70, pp 65-94.
Vaz, M. T. N., M. Cesário (2004) Padrões Comportamentais dos empresários portugueses face à inovação: o caso das PME’s do sector agro – alimentar localizadas no Alentejo Central e Oeste, in APDR (Ed), Demografia e Desenvolvimento Regional - Actas do X Encontro Nacional (CD ROM), Colecção APDR, Coimbra.
Vaz, M. T. N. (2004) The environmental context for small firms in the EU in Vaz et al. (Eds), Innovation in Small Firms and Dynamics of Local Development, Scholar Publishing House, Warsaw, pp 13-31.
Vaz, M. T. N., Cesário, M. and Fernandes, S. (2006) Interaction between Innovation in Small Firms and their Environments: An exploratory study, European Planning Studies, Special Issue: Rural Development, nº1/2006.
Verhaegen, I., and van Huylenbroeck, G. (2001) Costs and benefits for farmers participating in innovative marketing channels for quality food products, Journal of Rural Studies, Volume 17. nº 4: pp 443-456.
Annex 1 – Cluster’s distribution by region
A4 .Re gio n * Clu ste r Nu m b e r of Cas e Cros s tab ulatio n
5 4 21 30 5,8% 2,5% 27,3% 9,3% 7 12 11 30 8,1% 7,5% 14,3% 9,3% 2 27 1 30 2,3% 16,9% 1,3% 9,3% 2 25 3 30 2,3% 15,6% 3,9% 9,3% 10 6 6 22 11,6% 3,8% 7,8% 6,8% 16 9 5 30 18,6% 5,6% 6,5% 9,3% 11 14 5 30 12,8% 8,8% 6,5% 9,3% 9 15 6 30 10,5% 9,4% 7,8% 9,3% 12 9 8 29 14,0% 5,6% 10,4% 9,0% 4 15 7 26 4,7% 9,4% 9,1% 8,0% 8 24 4 36 9,3% 15,0% 5,2% 11,1% 86 160 77 323 100,0% 100,0% 100,0% 100,0% Count % w ithin Cluster Number of Cas e Count % w ithin Cluster Number of Cas e Count % w ithin Cluster Number of Cas e Count % w ithin Cluster Number of Cas e Count % w ithin Cluster Number of Cas e Count % w ithin Cluster Number of Cas e Count % w ithin Cluster Number of Cas e Count % w ithin Cluster Number of Cas e Count % w ithin Cluster Number of Cas e Count % w ithin Cluster Number of Cas e Count % w ithin Cluster Number of Cas e Count % w ithin Cluster Number of Cas e A ude Gard Devon/Cornw ell
Heref ord/Worc ester
Oes te A lentejo Central South West Border West Flandria Hairnaut Kuzaw sko-Pomorskie A 4 .Region Total 1 2 3
Clus ter Number of Case
Total
Annex 2 – ANOVA results
ANOV A 26,786 2 4,952E-02 320 540,937 ,000 6,713 2 ,191 320 35,107 ,000 17,488 2 ,141 320 124,278 ,000 9,997 2 ,176 320 56,716 ,000 11,860 2 ,176 320 67,215 ,000 1,687 2 ,214 320 7,879 ,000 36,682 2 2,267E-02 320 1617,757 ,000
E2.a New or substantially modif ied produc ts E2.b New or substantially modif ied produc tion proces ses
E7.a1 Ty pe of
innovation,compos ition of produc t, new f ood ingredients
E7.b1 Ty pe of innovation, compos ition of produc t, new packaging material E7.c 1 Ty pe of innovation, visual appearance Organis ational innov ation New ness Mean Square df Clus ter Mean Square df Error F Sig.
The F tests s hould be used only f or desc riptive purposes bec aus e the clus ters hav e been c hos en to max imiz e the dif f erences among cases in dif f erent c lus ters. The obs erved signif ic anc e levels are not corrected f or this and thus cannot be interpreted as tests of the hy pothesis that the cluster means are equal.