Comparison of nonlinear models for the description of
carbon mineralization in soils treated with pig slurry
Gustavo Sérgio de Paula1Edilson Marcelino Silva2 Thais Destefani Ribeiro Furtado3 Ariana Campos Frühauf 4 Joel Augusto Muniz5
Abstract
One of the strategies to reduce environmental impacts caused by pig slurry is its application to soils for agricultural productions. Carbon mineralization curves can be used to determine the best pe-riods for the use of organic matter for an adequate management of soils and growing plants. The ob-jective of this study was to evaluate the fit of nonlinear models for soil carbon mineralization. The ex-periment was conducted using a randomized block design with four replications and four treatments.
The treatments consisted of monthly applications of pig slurry at rates of 0, 7.5, 15.0, and 30.0 m3
ha-1 ofpig slurry. Soil samples were collected and incubated for 26 days; then, seven observations
of mineralized carbon volume were made over time. The description of the carbon mineralization followed the Stanford and Smith, Cabrera, and Juma models, considering the structure of autoregres-sive errors AR (1), when necessary; the fits were compared using the Akaike Information Criterion (AIC). The description of carbon mineralization in the treatments by nonlinear models was, in general, adequate. Juma was the most adequate model to describe the treatment with rate of 0. Stanford and
Smith was the most adequate model to describe the treatments with rates of 7.5 and 15.0 m3 ha-1.
Cabrera was the most adequate model to describe the treatment with rate of 30.0 m3 ha-1.
Keywords: Organic waste. Stanford and Smith model. Cabrera model. Juma model.
Introduction
Pig production is relevant in the Brazilian agrobusiness due to the high number of people em-ployed in this production chain and the expressive generation of income for producers and exports to the country. Brazil is the fourth largest pig meat producer and exporter country (CONAB, 2017; GUIMARÃES et al., 2017). Its high pig production generates a large amount of liquid wastes, which can cause several environmental problems when not appropriately used or disposed, such as conta-mination of water bodies and public health problems due to the release of substances, such as nitrate in water courses (CADONÁ, 2017).
1 Universidade Federal de Lavras (UFLA), graduando em Agronomia. [email protected]. Departamento de Estatística,
Campus Universitário da UFLA, Lavras, Minas Gerais, CEP 37200-000.
2 UFLA, doutorando em Estatística e Experimentação Agropecuária. [email protected]. 3 UFLA, doutoranda em Estatística e Experimentação Agropecuária. [email protected]. 4 UFLA, doutoranda em Estatística e Experimentação Agropecuária. [email protected].
However, an alternative for the use of pig slurry to decrease its environmental impacts is its use as a source of nutrients to agricultural crops. The chemical composition of pig slurry includes a large amount of nitrogen, which is required in large amounts by plants (BISON PINTO et al., 2014). Moreo-ver, the input of organic compounds to the soil stimulates the growth of microorganism populations, resulting in carbon immobilization or mineralization as carbon dioxide; and the amount and quality of the substrate and its interaction with the soil microbiota can result in mineralization of the native soil organic matter (FERNANDES et al., 2011).
Several factors affect the decomposition process of organic compounds in the soil, such as the relation between the compound pH and soil pH, the compound chemical composition, the amount of carbon, the C to N ratio, and the form of application to the soil (e.g. incorporation). Most of the car-bon mineralization occurs, in general, at the beginning of the decomposition of organic compounds in the soil because of a greater soluble fraction with labile compounds in this period; when this fraction decreases, the mineralization is slower because of the more resistant compounds to microorganisms (GIACOMINI et al., 2008). This dynamic of the mineralization curve can be described by mathema-tical functions that constitute nonlinear regression models (FERNANDES et al., 2011; SILVA et al., 2019a).
Thus, studying carbon mineralization curves over time is important and necessary to unders-tand the decomposition dynamics of organic compounds that can assist in more favorable soil ma-nagement practices for agricultural production. Nonlinear models are used to describe carbon mine-ralization curves; they provide a good fit and gather the information contained in the data into few parameters, providing estimates with biological and practical interpretations, which are useful to rural producers (SILVEIRA et al., 2018).
One of the most used nonlinear models to describe soil carbon mineralization over time is the Stanford and Smith (1972). This model was used in several studies on dynamics of carbon, presen-ting good results in researches on eucalyptus plantations (BARRETO et al., 2010), tannery sludge (MARTINES et al., 2006), septic tank sludge, anaerobic digestor sludge, reactor sludge (SILVA, 2017), carcass and residue of small ruminants (PEREIRA, 2014), pig slurry and oat plant residues (SILVA et al., 2019a), and sewage sludge and oat plant residues (SILVA et al., 2019b).
In studies on nonlinear models with measures in the same experimental unities over time, observations normally present correlations, which also occurs in studies of decompositions in soils (SILVA et al., 2019a), presenting structures of dependence in the experimental errors. According to Silveira et al. (2018), considering the modeling of this correlation is necessary to obtain an appro-priate fit.
The objective of the present work was to evaluate the fit of nonlinear regression Models Cabrera (1993), Juma et al. (1984), and Stanford and Smith (1972) for the description of carbon
mineraliza-tion in soils from the 2nd to the 26th day after pig slurry application, and to identify the most adequate
model to describe the dynamics of decomposition of organic compounds in the soil.
Material and methods
The data used to fit the models were extracted from Fernandes et al. (2011) and correspond to mean results of an experiment that evaluated carbon mineralization in soils using different rates of pig slurry. The experiment was conducted in São Gabriel do Oeste, MS, Brazil. The soil of the area was classified as a Typic Hapludox (Latossolo Vermelho Distrófico - SiBCS); it was covered with pastures
for bovine milk production. Soil samples were collected from the 0-10 cm layer. The pig slurry used consisted of feces and urine, feed leftovers, and water from the drinkers and cleaning processes.
The experiment was conducted in a randomized block experimental design, with four treatments and four replications. The treatments consisted of monthly applications of pig slurry at rates of 0, 7.5,
15.0, and 30.0 m3 ha-1 of pig slurry. The carbon mineralization (C) data was obtained in laboratory
conditions by measuring the C released by the soil microbial activity as carbon dioxide (CO2). The soil
samples were air dried and sieved (2.0 mm mesh). Aliquots of 50.0 g of soil were placed in 100.0-ml flasks. The soil moisture was corrected to 60.0% of maximum water retention capacity. The amount of mineralized carbon was evaluated after 2, 6, 9, 13, 16, 22, and 26 days of incubation.
The nonlinear models evaluated were: Cabrera (1), Juma (2), and Stanford and Smith (3), ac-cording to the following equations:
Ci = C1(1 - exp(-k1ti)) + k0ti + ui (1) Ci = C0ti/(v + ti) + ui (2) Ci = C0(1 - exp(-kti)) + ui (3)
at which
ui = ϕ1ui-1 + ... + ϕpui-p + εi , with i= 1, 2, ..., n (n = number of evaluation times);
ui is the residue of the fit in the ith time;
ϕ1 is the autoregressive parameter of order 1;
ui-1 is the residue of the fit of the preceding time to the ith measure;
ϕp is the autoregressive parameter of order p;
ui-p is the residue of the fit in the p times before the ith measure;
εi is the experimental error, with normal distribution with mean zero and variance
σ2, e. g., ε
i ~ N(0, σ2).
When the residues in the models were independent, the parameters ϕi were null and,
conse-quently, ui = εi (MAZZINI et al., 2003; GUEDES et al., 2004, SAVIAN et al., 2007; MENDES et al.,
2008; PRADO et al., 2013; SOUZA et al., 2014).
The Ci in the equations (1), (2), and (3) defines the mean value of the amount of
minerali-zed carbon in the times
t
i in days; C0 indicates the value of the amount of potentially mineralizablecarbon; C1 is the amount of easily mineralizable carbon; k, k1, k0 are mineralization rates; v is the
half-life time; ti is the time of the ith evaluation, expressed in days (PEREIRA et al., 2005; PEREIRA
et al., 2009). The half-life time (v) of potentially mineralizable carbon for the Stanford and Smith model, and of easily mineralizable carbon for the Cabrera model was estimated by v = ln(2)/k, and
v = ln(2)/k1, respectively. When the parameter k0 of the Cabrera model was zero, the model became
the Stanford and Smith model. Moreover, the Cabrera model considers two carbon fractions: an easily
mineralizable (C1) and a resistant (k0) fraction. The Juma model and the Stanford and Smith model
consider only one carbon fraction: potentially mineralizable fraction (C0).
The estimation of the parameters C0, C1, k, k1, k0, and v of the models was done using the
minimum square method, obtaining the nonlinear normal equation system. In the case of nonlinear models, the system presents no direct solution, and use of iterative algorithms of numerical search is necessary to obtain the estimates of the parameters (CARNEIRO et al., 2014; MUIANGA et al.,
2016). Several iterative processes are described in the literature; the one used in the present work was the Gauss-Newton algorithm (MUNIZ et al., 2017; RIBEIRO et al., 2018a; RIBEIRO et al., 2018b). This algorithm considers the expansion in series of Taylor to approach the nonlinear regres-sion model with linear terms, then, applying the ordinary minimum square method to estimate the parameters. The calculations of estimates for the sampled data, their fit to graphics, and all compu-tational processes involved with the elaboration of this work were developed using the R program (R DEVELOPMENT CORE TEAM, 2016).
Confidence intervals of the estimated parameters were obtained under the supposition of nor-mality of residues. According to Draper and Smith (2014), an interval of 95% of confidence for the parameter βi of the model is defined as:
IC(βi) : bi ± t(νν;0;025).S(bi) (4)
at which:
bi is the estimate for the parameter (βi);
S(bi) is the standard error of the estimate;
t(ν;0;025) is the upper quantile of the Student t distribution, considering α= 5% and the degrees of freedom v=n – d, at which d is the number of parameters of the model.
The Durbin Watson test was applied to verify the presence of residual dependence between the measures, evaluating if the residue of an observation is associated with the residue of the adjacent observations (FURTADO et al., 2019). The Breusch-Pagam test was used to verify the homogeneity of residues, and the Shapiro-Wilk test was used to verify their normality.
The models were compared for quality of fit, and the most adequate model to describe the C mineralization curve over time was indicated. The following criteria was used:
i . Adjusted coefficient of determination,R2
aj, defined by: (1-R2)(n-1) R2 aj=1– ; (5) at which
R2 the coefficient of determination;
n is the number of observations and d is the number of parameters of the model.
A model should be preferred than the other when presenting a higher value of AIC. ii. Akaike information criterion (AIC) given by the expression:
AIC= – 2logL(θ)+2p
(6)at which
L (
θ)
is the maximum of the likelihood function; p is the number of parameters in the model;log is the natural logarithm operator. Between two models, the lower the value of AIC, the better the model fits the data.
n – d
~
Results and discussion
The results obtained by analysis of experimental errors (TABLE 1) were expressed by the Sha-piro-Wilk, Breusch-Pagan, and Durbin-Watson tests. According to the results, the Shapiro-Wilk test indicated residual normality for all models and all treatments evaluated, except for the treatment with pig slurry rate of 0 of the Stanford and Smith model (p<0.05); thus, this model was disregarded, and the estimates of the parameters were not presented, as well as the evaluators of quality of fit of this model for the rate of 0. The Breusch-Pagan test indicated residual homogeneity for all models and treatments (p>0.05). The Durbin-Watson test showed correlations for all treatments of the Juma
model, and for the treatment with rate of 30.0 m3 ha-1 of the Cabrera model; thus, the correlation
was considered in the study and the fits with autoregressive errors of order 1 AR(1) was presented to explain the dependence of residues of these treatments. This correlation of the errors was expected, since the measures were made in the same plot over time. Silva et al. (2019a) also found correla-tion for the fit of nonlinear models to data of carbon mineralizacorrela-tion from pig slurry; and Silveira et al. (2018) found correlation of errors when fitting nonlinear models t o accumulated production of biogas from pig waste. The treatments evaluated by the Stanford and Smith model and Cabrera model
pre-sented independence of errors in the pig slurry rates of 0, 7.5, and 15.0 m3 ha-1.
Table 1 – P-values of Shapiro-Wilk (SW), Durbin-Watson (DW), and Breusch-Pagan (BP) tests applied to errors
of models for mineralized carbon (mg CO2 kg-1) of the evaluated treatments.
Treatments
(Rate of slurry) Model p-valueSW p-valueBP p-valueDW
0 Stanford and Smith 0.0172 0.7773 0.6880
0 Cabrera 0.3564 0.2199 0.9240
0 Juma 0.4946 0.1730 0.0220
7.5 Stanford and Smith 0.4235 0.0824 0.0620
7.5 Cabrera 0.6256 0.1797 0.1280
7.5 Juma 0.3216 0.1876 0.0120
15 Stanford and Smith 0.7274 0.1939 0.7220
15 Cabrera 0.6247 0.2079 0.7020
15 Juma 0.3421 0.2237 0.0100
30 Stanford and Smith 0.5128 0.8778 0.6260
30 Cabrera 0.2637 0.1472 0.0200
30 Juma 0.3857 0.1469 0.0200
Source: Elaborated by the authors (2019).
The estimates of parameters of models and their respective confidence intervals at 95%
pro-bability are presented in Table 2. The estimate of confidence interval of parameter k0 of the Cabrera
model for the rates of 0, 7.5, and 15 m3 ha-1 included the value zero. According to Zeviani et al.
(2012), this result indicates that the parameter value is zero, therefore, the model did not fit for these
treatments; when the parameter k0, is not considered, the model reduces itself to the Stanford and
Smith model, with only one fraction of carbon (potentially mineralizable fraction). For the rate of 30 of the Cabrera model, the estimates of confidence intervals showed that all parameters of the model did not include the value zero, showing that the model describes the treatment, and the half-life time
(v) of easily mineralizable carbon was estimated in 2.5 days (table 2). Only this treatment presented
two mineralization phases, an easily mineralizable (C1) and a resistant phase (k0). Silva et al. (2019a)
found that the Cabrera model was more adequate for the use of pig slurry at rates of 20 m3 ha-1,
in-corporated to the soil; thus, the treatment presented two phases of carbon mineralization.
Table 2 – Estimates of the parameters of the models, and their respective asymptotic confidence intervals of
95% (LL = lower limit, and UL = upper limit) in the fit of mineralized C (mg of CO2 kg-1) of the evaluated
treatments.
Stanford and Smith Model
Rate 0 Rate 7.5 LL Estimates UL C0 --k --v -- -- -- LL Estimates UL C0 93.6419 94.9092 96.1986 k 0.2499 0.2643 0.2798 v 2 .4772 2.6225 2.7736 Rate 15 Rate 30 LL Estimates UL C0 97.3797 97.9326 98.4894 k 0.2627 0.2690 0.2755 v 2.5159 2.5767 2.6385 LL Estimates UL C0 100.8229 101.4000 101.9444 k 0.2586 0.2647 0.2709 v 2.5586 2.6186 2.6803 Cabrera Model Rate 0 Rate 7.5 LL Estimates UL C1 87.0386 91.5985 96.8376 k0 -0.2614 0.0285 0.1813 k1 0.2443 0.2694 0.2964 v 2.3386 2.5729 2.8372 LL Estimates UL C1 88.1567 91.5890 95.3962 k0 -0.0177 0.1539 0.3129 k1 0.2598 0.2800 0.3013 v 2.3005 2.4755 2.6680 Rate 15 Rate 30 LL Estimates UL C1 95.2927 98.3546 101.6897 k0 -0.1682 -0.0195 0.1199 k1 0.2518 0.2672 0.2832 v 2.4476 2.5941 2.7528 LL Estimates UL C1 98.8410 100.0313 100.2218 k0 0.0548 0.0638 0.0726 k1 0.2692 0.2702 0.2711 v 2.5568 2.5653 2.5748 ϕ -0.9544
Juma Model Rate 0 Rate 7.5 LL Estimates UL C0 95.1644 105.4848 115.8052 v 1.7842 3.0315 4.2789 ϕ 0.3152 LL Estimates UL C0 101.679 110.0563 118.4334 v 2.1089 3.0908 4.0727 ϕ 0.3056 Rate 15 Rate 30 LL Estimates UL C0 102.9182 113.4426 123.9671 v 1.8619 3.0481 4.2344 ϕ 0.3190 LL Estimates UL C0 107.5219 117.7371 127.9524 v 1.9906 3.1155 4.2403 ϕ 0.2985
Source: Elaborated by the authors (2019).
The Stanford and Smith model fitted to the rates of 7.5, 15.0, and 30.0 m3 ha-1, and the Juma
model fitted to the data of the four treatments, since the estimates of confidence intervals showed that all parameters of the model did not include the value zero.
Considering the confidence intervals to estimate the parameter C0 in the Stanford and Smith
model, there was no superposition between confidence intervals in the treatments with rates of 7.5,
15.0, and 30.0 m3 ha-1. Thus, the rate of 30.0 m3 ha-1 presented higher potentially mineralizable
carbon than the rates of 15.0 and 7.5 m3 ha-1; and the rate of 15.0 m3 ha-1 had higher potentially
mineralizable carbon than the rate of 7.5 m3 ha-1. These results were expected, since a higher rate
can stimulate the microbial activity, increasing the mineralization of the carbon added to the soil and the degradation of the native soil organic matter (FERNANDES et al., 2011). Despite the differences
in amount of potentially mineralizable carbon (C0), the parameter half-life time (v) of all treatments in
the Stanford and Smith model had superposition of confidence intervals, showing that all treatments needed approximately 2.6 days to mineralize half of the potentially mineralizable carbon.
Superposition was found in the Juma model when considering the confidence intervals for the
estimate of the parameter C0 in all treatments; thus, all treatments presented the same amount of
po-tentially mineralizable carbon. Although the amount of carbon added was different, this factor alone does not totally explain the complexity in the soil ecosystem, where several other factors, such as C to N ratio and the type of N ions, can affect the carbon mineralization by microorganisms (FERNANDES et al., 2011). Superposition was found between the confidence intervals of the parameter half-life time (v) in all treatments of the model; as well as the Stanford and Smith model, this indicates that all treatments needed approximately 3 days to decompose half of the potentially mineralizable carbon.
All models presented, in general, good fit in all treatments, since the values of the adjusted
coe-fficient of determination (R2
aj) were above 94% (TABLE 3). The fits are shown in Figures 1 to 4. Silva
et al. (2019a) studied the fit of the nonlinear models (Stanford and Smith, and Cabrera) for carbon
mineralization from pig slurry and oat plant residues in soils and found R2
aj values higher than 0.97,
indicating that the models describe adequately the data. For the rate of 0, Juma was the only model
that described the carbon mineralization. For the rates of 7.5 and 15.0 m3 ha-1, Stanford and Smith
was the model that best described the carbon mineralization, which presented lower AIC values and
higher R2
aj values than the Juma model. For the rate of 30.0 m3 ha-1, Cabrera was the model that best
described the carbon mineralization, presenting the lowest AIC and the highest R2
aj, followed by the
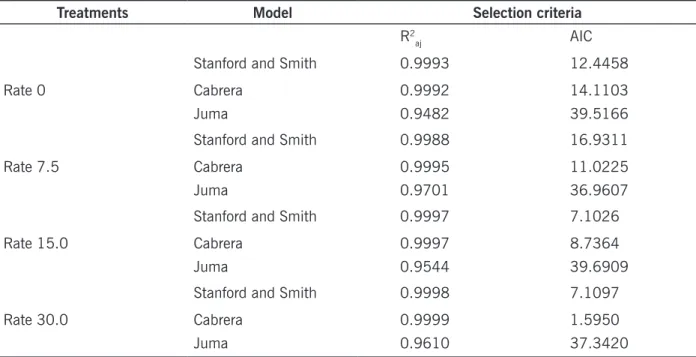
Table 3 – Estimates of selection criteria: adjusted coefficient of determination (R²aj) and Akaike information criterion (AIC) for the fitted models for the description of mineralized carbon (mg CO2 kg-1) of the evaluated
treatments.
Treatments Model Selection criteria
R2
aj AIC
Stanford and Smith 0.9993 12.4458
Rate 0 Cabrera 0.9992 14.1103
Juma 0.9482 39.5166
Stanford and Smith 0.9988 16.9311
Rate 7.5 Cabrera 0.9995 11.0225
Juma 0.9701 36.9607
Stanford and Smith 0.9997 7.1026
Rate 15.0 Cabrera 0.9997 8.7364
Juma 0.9544 39.6909
Stanford and Smith 0.9998 7.1097
Rate 30.0 Cabrera 0.9999 1.5950
Juma 0.9610 37.3420
Source: Elaborated by the authors (2019).
Figure 1 – Fitted model for carbon mineralization (mg of CO2 kg-1) as a function of time of incubation, at the
rate of 0 m3 ha-1 of pig slurry.
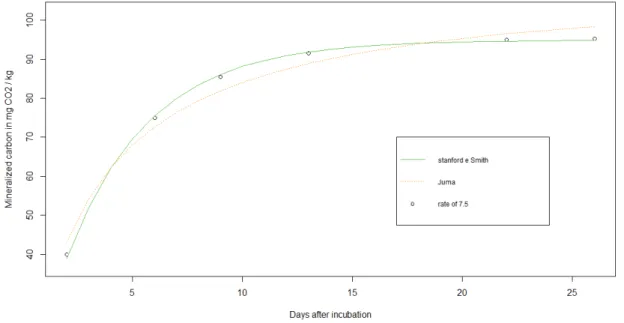
Figure 2 – Fitted model for carbon mineralization (mg of CO2 kg-1) as a function of time of incubation, at the rate
of 7.5 m3 ha-1 of pig slurry.
Source: Elaborated by the authors (2019).
Figure 3 – Fitted model for carbon mineralization (mg of CO2 kg-1) as a function of time of incubation, at the rate
of 15.0 m3 ha-1 of pig slurry.
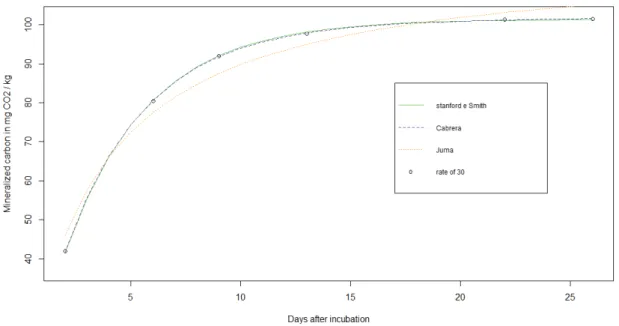
Figure 4 – Fitted model for carbon mineralization (mg of CO2 kg-1) as a function of time of incubation, at the rate
of 30.0 m3 ha-1 of pig slurry.
Source: Elaborated by the authors (2019).
Conclusions
Juma was the most adequate model for the description of carbon mineralization in the
treat-ment with pig slurry at rate of 0 m3 ha-1, thus, this treatment presents only one fraction of carbon that
is mineralizable.
Stanford and Smith was the best model for the description of carbon mineralization in the
treatments with pig slurry at rates of 7.5 m3 ha-1 and 15 m3 ha-1, i.e., these treatments presented only
carbon fractions that are exponentially mineralized.
Cabrera was the most adequate model to describe carbon mineralization in the treatment with
pig slurry at rate of 30.0 m3 ha-1, thus, this treatment certainly presents fractions of mineralizable
carbon with exponential behavior, and more resistant fractions with constant mineralization.
Comparação de modelos não lineares na descrição da mineralização
do carbono no solo tratado com dejetos de suínos
Resumo
Uma estratégia para reduzir os impactos ambientais causados por dejetos de suínos consiste em utilizar esses resíduos em solos para produção de culturas agrícolas. Por meio das curvas de mineralização de carbono é possível determinar os melhores períodos para utilização da matéria or-gânica visando ao manejo adequado do solo e das culturas. Objetivou-se com este estudo comparar
o ajuste de modelos não lineares que descrevem a mineralização de carbono no solo. O experimento foi realizado usando o delineamento blocos ao acaso com quatro repetições e quatro tratamentos.
Foram usados os seguintes tratamentos: sem adição (0), doses mensais de 7,5; 15,0 e 30,0 m3 ha-1
de dejetos de suínos. As amostras de solo coletadas foram incubadas por 26 dias e foram feitas sete observações do volume de carbono mineralizado ao longo do tempo. A descrição da mineralização do carbono foi feita pelos modelos Stanford e Smith, Cabrera e Juma, considerando estrutura de erros autorregressivos AR (1) quando necessário. Para comparar os ajustes foi utilizado o critério de infor-mação Akaike (AIC). Em geral, a descrição da mineralização de carbono nos tratamentos pelos modelos não lineares foi adequada. O modelo Juma foi o mais adequado para descrever o tratamento de dose 0.
O modelo Stanford e Smith foi o mais adequado para descrever os tratamentos de dose 7,5 e 15,0 m3
ha-1. O modelo Cabrera foi o mais adequado para descrever o tratamento de dose 30,0 m3 ha-1.
Palavras-chave: Resíduo orgânico. Modelo Stanford e Smith. Modelo Cabrera. Modelo Juma.
References
BARRETO, P. A. B.; RODRIGUES, E. F. G.; RODRIGUES, A. C. G.; BARROS, N. F.; ALVES, B. J. R.; FONSECA, S. Mineralização de nitrogênio e carbono em solos sob plantações de eucalip-to, em uma sequência de idades. Revista Brasileira de Ciência do Solo, Viçosa, v. 34, n. 3, p. 735-745, jun. 2010. Disponível em: http://www.scielo.br/scielo.php?script=sci_arttext&pi-d=S0100-06832010000300015&lng=en&nrm=iso. Acesso em: 14 jan. 2019.
BISON PINTO, M. A.; FABBRIS, C.; BASSO, C. J.; SANTI, A. L.; GIROTTO, E. Aplicação de dejeto
líquido de suínos e manejo do solo na sucessão aveia/milho. Pesquisa Agropecuária Tropical,
Goiâ-nia, v. 44, n. 2, p. 205-212, abr./jun. 2014. Disponível em: https://www.revistas.ufg.br/pat/article/ view/25759/16779. Acesso em: 14 jan. 2019.
CABRERA, M. L. Modeling the flush of nitrogen mineralization caused by drying and rewetting soils. Soil Science Society of America Jornal, v. 57, p. 63-66, 1993.
CADONÁ, E. A. Contaminação da água pelo uso agrícola de dejetos de suínos na bacia hidrográfica rio coruja/bonito, braço do Norte/SC. 2017. 127 p. Dissertação (Mestrado). Universidade Federal de Santa Catarina, Florianópolis.
CARNEIRO, A. P. S.; MUNIZ, J.A; CARNEIRO, P.L.S; MALHADO, C.H.M.M; MARTINS FILHO, R.; SILVA, F.F. Identidade de modelos não lineares para comparar curvas de crescimento de bovinos da raça Tabapuã. Pesquisa Agropecuária Brasileira, Brasília, v. 49, n. 1, p. 57-62, 2014. Disponível em: https://seer.sct.embrapa.br/index.php/pab/article/view/18183. Acesso em: 14 jan 2019.
CONAB, Companhia Nacional de Abastecimento. Análise mensal de carne suína, dezembro/2017, 5 p. Disponível em: https://www.conab.gov.br/info-agro/analises-do-mercado-agropecuario-e-extrativis-ta/analises-do-mercado/historico-mensal-de-carne-suina. Acesso em: 14 jan 2020.
DRAPER, N. R.; SMITH, H. Applied regression analisys. 3rd ed., reprint. New York: J. Wiley; 2014. FERNANDES, A. H. B. M.; CARDOSO, M. A.; SOUZA, R. A. C.; FERNANDES, F. A.; SOARES, M. T. S.; CRISPIM, S. M. A.; GALVANI, F.; LISITA, F. O. Nitrificação e Mineralização de Carbono em Solos Tratados com Dejetos de Suínos Biodigeridos. Corumbá: Embrapa Pantanal, 2011.
FURTADO, T. D. R.; MUNIZ, J. A.; SILVA, E. M.; FERNANDES, J. G. Drying kinetics of jabuticaba pulp by regression models. Revista Brasileira de Fruticultura, Jaboticabal, v. 41, n. 1, p. e-097, 2019.
GUEDES, M. H. P.; MUNIZ, J. A.; PEREZ, J. R. O.; SILVA, F. F.; AQUINO, L. H.; SANTOS, C. L. Estudo das curvas de crescimento de cordeiros das raças Santa Inês e Bergamácia consi-derando Heterogeneidade de variâncias. Ciência e Agrotecnologia, Lavras, v. 28, n. 2, p. 381-388, mar./abr. 2004. Disponível em: http://www.scielo.br/scielo.php?script=sci_arttext&pi-d=S1413-70542004000200019&lng=en&nrm=iso. Acesso em: 15 jan. 2019.
GUIMARÃES, D. D.; AMARAL, G. F.; MAIA, G. B. S.; LEMOS, M. L. F.; ITO, M.; CUSTODIO, S. Suinocultura: estrutura da cadeia produtiva, panorama do setor no brasil e no mundo e o apoio do BNDES. Agroindústria, 2017.
JUMA, N. G.; PAUL, E. A.; MARY, B. Kinetic analysis of net mineralization in soil. Soil Science So-ciety of America Journal, v. 48, p. 465-472, 1984.
MARTINES, A. M.; ANDRADE, C. A.; CARDOSO, E. J. B. N. Mineralização do carbono orgâni-co em solos tratados orgâni-com lodo de curtume. Pesquisa Agropecuária Brasileira, Brasília, v. 41, n. 7, p. 1149-1155, jul. 2006. Disponível em: http://www.scielo.br/scielo.php?script=sci_arttext&pi-d=S0100-204X2006000700011&lng=en&nrm=iso. Acesso em: 14 jan. 2019.
MAZZINI, A. R. A.; MUNIZ, J. A.; AQUINO, L. H.; SILVA, F. F. Análise da curva de crescimento de machos Hereford. Ciência e Agrotecnologia, Lavras, v. 27, n. 5, p. 1105-1112, 2003.
MENDES, P. N.; MUNIZ, J. A.; SILVA, F. F.; MAZZINI, A. R. A. Modelo Logístico difásico no estudo do crescimento de fêmeas da raça Hereford. Ciência Rural, Santa Maria, v. 38, n. 7, p. 1984-1990, 2008.
MUIANGA, C. A.; MUNIZ, J. A.; NASCIMENTO, M. S.; FERNANDES, T. J.; SAVIAN, T. V. Descrição da curva de crescimento de frutos do cajueiro por modelos não lineares. Revista Brasileira de Fruti-cultura, Jaboticabal, v. 38, n. 1, p. 22-32, 2016.
MUNIZ, J. A.; NASCIMENTO, M. S.; FERNANDES, T. J. Nonlinear models for description of cacao fruit growth with assumption violations. Revista Caatinga, Mossoró, v. 30, n. 1, p. 250-257, 2017. PEREIRA, J. M.; MUNIZ, J. A.; SILVA, C. A. Nonlinear models to predict nitrogen mineralization in an Oxisol. Scientia Agricola, Piracicaba, v. 62, n. 4, p. 395-400, ago. 2005 . Disponível em: http:// www.scielo.br/scielo.php?script=sci_arttext&pid=S0103-90162005000400014&lng=en&nrm=i-so. Acesso em: 15 jan. 2019.
PEREIRA, J. M.; MUNIZ, J. A.; SAFADI, T.; SILVA, C. A. Comparação entre modelos para predição do nitrogênio mineralizado: uma abordagem bayesiana. Ciência e Agrotecnologia. Lavras, v. 33, p. 1792-1797, 2009.
PEREIRA, M. S. Avaliação das taxas de mineralização de carbono e nitrogênio do composto orgâni-co proveniente de carcaça e despojo de pequenos ruminantes. 2014. 48 p. Dissertação (Mestrado). Universidade Federal do Ceará, Fortaleza.
PRADO, T. K. L.; SAVIAN, T. V.; MUNIZ, J. A. Ajuste dos modelos Gompertz e Logístico aos dados de crescimento de frutos de coqueiro anão verde. Ciência Rural, Santa Maria, v. 43, n. 5, p. 803-809, maio 2013.
RIBEIRO, T. D.; SAVIAN, T. V.; FERNANDES, T. J.; MUNIZ, J. A. The use of the nonlinear models in the growth of pears of ‘Shinseiki’ cultivar. Ciência Rural, Santa Maria, v. 48, n. 1, e20161097, jan. 2018 (a). Disponível em: http://dx.doi.org/10.1590/0103-8478cr20161097. Acesso em: 16 jan. 2019.
RIBEIRO, T. D.; PACOPAHYBA, R. W. M.; MORAIS, A. R.; MUNIZ, J. M. Description of the growth of pequi fruits by nonlinear models. Revista Brasileira de Fruticultura, Jaboticabal, v. 40, n. 4, p. e-949 , 2018 (b). Disponível em: http://dx.doi.org/10.1590/0100-29452018949. Acesso em: 16 jan. 2019.
SAVIAN T. V.; MUNIZ, J. A. A Study of in situ degradability: Heterogeneity of variances and correlated errors. Scientia Agrícola, Piracicaba, v. 64, p. 548-554, 2007. Disponível em: https://doi.org/10.15
90%2Fs0103-90162007000500013. Acesso em: 16 jan. 2019.
SILVA, D. A. P. Mineralização da matéria orgânica de lodo aplicado no solo e produtividade do capim-tifton 85. 2017. 92 p. Dissertação (Mestrado). Universidade Federal de Minas Gerais, Belo Horizonte.
SILVA, D. M.: ANTONIOLLI, Z. I.; JACQUES, R. J. S.; SILVEIRA, A. O.; SILVA, D. A. A.; RACHE, M. M.,; PASSOS, V. H. G.; SILVA, B. R. Indicadores Microbiológicos de Solo em Pastagem com Aplicação Sucessiva de Dejetos de Suínos. Revista Brasileira de Ciência do Solo, Viçosa, v. 39, n. 6, p. 1585-1594, dez. 2015. Disponível em: http://www.scielo.br/scielo.php?script=sci_arttext&pi-d=S0100-06832015000601585&lng=en&nrm=iso. Acesso em: 14 jan. 2019.
SILVA, E. M.; RIBEIRO, T. D.; FERNANDES, J. G.; MUNIZ, J. A. Descrição da mineralização do car-bono de dejetos de suíno e palha de aveia no solo por modelos não lineares. Revista Agrogeoambien-tal, Pouso Alegre, v. 11, p. 210-225, 2019a. Disponível em: https://agrogeoambiental.ifsuldeminas. edu.br/index.php/Agrogeoambiental/article/view/1299/pdf_1. Acesso em: 14 jan. 2020
SILVA, E. M.; SILVEIRA, S. C.; RIBEIRO, T. D.; MUNIZ, J. A. Descrição da decomposição do lodo de esgoto e palha de aveia por modelos não lineares. Revista Agrogeoambiental, Pouso Alegre, v. 11, p. 153-164 , 2019b. Disponível em: https://agrogeoambiental.ifsuldeminas.edu.br/index.php/ Agrogeoambiental/article/view/1287/pdf_1. Acesso em: 14 jan. 2020
SILVEIRA, S. C.; MUNIZ, J. A.; SOUSA, F. A.; CAMPOS, A. T. Modelos não lineares ajustados à produ-ção acumulada de biogás provenientes de camas sobrepostas de suínos. Revista Agrogeoambiental, Pouso Alegre, v. 10, n. 3, p. 91-103, jul./set. Disponível em: https://agrogeoambiental.ifsuldeminas.
edu.br/index.php/Agrogeoambiental/article/view/1168. Acesso em: 14 jan. 2019.
STANFORD, G.; SMITH, S. J. Nitrogen mineralization potentials of soil. Soil Science Society of America Journal, v. 36, p. 465-471, 1972.
SOUSA, I. F.; KUNZLE NETO, J. E.; MUNIZ, J. A.; GUIMARÃES, R. M.; SAVIAN, T. V.; MUNIZ, F. R. Fitting nonlinear autoregressive models to describe coffee seed germination. Ciência Rural, Santa Maria, v. 44, p. 2016-2021, 2014.
ZEVIANI, W. M.; SILVA, C. A.; CARNEIRO, W. J. O.; MUNIZ, J. A. Modelos não lineares para a li-beração de potássio de estercos animais em latossolos. Ciência Rural, Santa Maria, v. 42, n. 10, p. 1789-1796, out., 2012. Disponível em: http://www.scielo.br/pdf/cr/v42n10/a28712cr3006.pdf. Acesso em: 15 jan. 2019.
Received: February 27, 2019 Accepted: May 10, 2019