System Level Simulation of E-MBMS Transmissions in LTE-A
Paulo Gomes, José Seguro and Américo Correia
Instituto de Telecomunicações (IT-IUL/ISCTE-IUL)Lisbon, Portugal [email protected],
[email protected], [email protected]
Abstract–Interference coordination methods for Evolved-Multimedia Broadcast/Multicast Service (E-MBMS) in Long-Term Evolution Advanced (LTE-A) are presented. In this paper, OFDM/OFDMA signals based on LTE parameters are combined with Multipoint MIMO, Turbo codes and signal space diversity methods. Different interference coordination techniques, such as, Multipoint MIMO coordination, Fixed Relay stations, adaptive frequency reuse and schedulers are considered to evaluate the E-MBMS spectral efficiency at the cell borders.
The system level coverage and throughput gains of Multipoint MIMO system with hierarchical constellations and Turbo-codes are simulated associated to the presence or not of fixed relays and measuring the maximum spectral efficiencies at cell borders of single cell point-to-multipoint or single frequency network topologies. The influence of the relay transmission power and cell radius in the performance of the previous cellular topologies is also evaluated.
Keywords – OFDM; multiple antennas; diversity; Turbo-codes; MIMO; Interference; Relays.
I. INTRODUCTION
Long Term Evolution Advanced (LTE-A) considers a series of new transmission technologies, such as, coordinated multipoint transmission and reception or relay and carrier aggregation, in order to meet the high technical and service requirements of IMT-Advanced standards. Those requirements include amongst others, peak data rate up to 100Mbps in high speed mobility environment and 1 Gbps in a pedestrian environment, using increased spectral flexibility that allows bandwidth allocation between 20MHz and 100MHz. The LTE standard is the basic standard that paves the way for the future 4th Generation (4G) wireless networks, as stated in [1].
The Evolved - Multimedia Broadcast/Multicast Service (E-MBMS) framework [2] is envisaged to play an essential role for the LTA proliferation in mobile environments. E-MBMS constitutes the evolutionary successor of E-MBMS, which was introduced in the Release 6 of Universal Mobile
Telecommunication System (UMTS). With E-MBMS the mass provision of multimedia applications to mobile users
will be a reality.
Point-to-Multipoint (PTM) transmission does not employ feedback and therefore need to be statically configured to provide desired coverage in the cell since,
transmitted signal is lowest at the cell border. However, when close to cell borders, the PTM bearer can greatly benefit from exploiting also the signals from adjacent cells transmitting the same service, i.e., from soft-combining.
Two types of Evolved-MBMS transmission scenarios exist:
1) Multi-cell transmission (MBSFN: Multi-Media Broadcast over a Single Frequency Network) on a dedicated frequency layer or on a shared frequency layer
2) Single-cell transmission (SCPTM: Single Cell Point to Multipoint) on a shared frequency layer.
Inter-cell interference co-ordination is one method here considered which is expected to improve coverage and increase cell-edge bitrate [3]. Inter-cell interference co-ordination techniques, such as reuse schemes and channel allocation, has been studied thoroughly for circuit switched services in second generation accesses [4].
Cooperative multiple input multiple output (MIMO) and Fixed Relays are other emerging techniques to combat inter-cell interference and improve cell edge performance [5].
Sharing data and channel state information among neighboring base stations (BSs) allows them to coordinate their transmissions in the downlink and jointly process the received signals in the uplink. Cooperative MIMO techniques can effectively turn inter-cell interference into useful signals, allowing significant power and diversity gains to be exploited. The architecture of the high-speed backbone enables the exchange of information (data and control information) between the BSs. Cooperative MIMO systems are only concerned with the BS to mobile station (MS) channel which are PTM channels.
We consider Orthogonal Frequency Division Multiplexing / Orthogonal Frequency Division Multiple Access (OFDM/OFDMA) where the use of Turbo codes in combination with Multipoint MIMO and Complex Rotation Matrices (CRM) [6][7] are applied to OFDM/OFDMA and exploited to achieve spatial and frequency diversity gains in LTE-A networks.
The work of this paper is based on previous work carried out by the authors. In chapter 6 of [8] the authors have considered multi-resolution techniques for MBMS considering both WCDMA and OFDMA. In chapter 16 of [9] the authors have considered the capacity and inter-site gains of LTE E-MBMS. In this paper we have extended
194
that work including MIMO, CRM and Relays in the LTE E-MBMS network and have evaluated by system simulations the coverage and throughput performance. To the best of the authors’ knowledge, up to now there are no work in the literature that investigated the performance and benefits of such cellular OFDMA system that incorporates multi-point coordinated MIMO, turbo codes, CRM, hierarchical constellations and low power fixed relay stations.
Section II introduces the coordinated MIMO and coordinated interference schemes. In Section III, the performance curves of system level simulations are presented. Conclusions are drawn in Section IV.
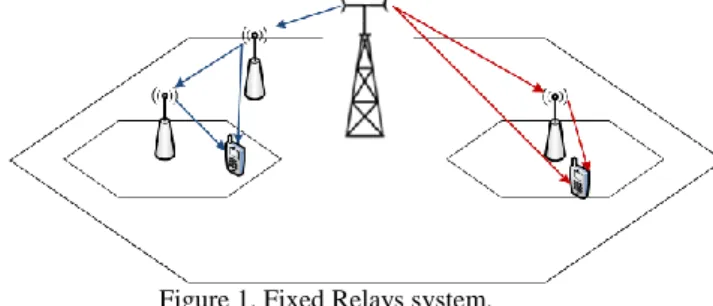
Figure 1. Fixed Relays system.
II. COORDINATED MIMO AND INTERFERENCE SCHEMES With MIMO cooperative systems [10][11] there is an important reduction of inter-cell interference in the area where the SISO/MIMO cooperative system exists. In LTE the BS is denoted as evolved-NodeB (eNB) and concentrates in it functionalities like radio resource managing, radio link control, interference coordination, mobility control, etc. The communication between eNBs is made through the X2 interface, and each adjacent eNB is interconnected to each other (mesh network). This feature eases the implementation of MIMO cooperative systems by reducing the interference as the same content can be transmitted to mobiles from different antennas (eNBs) at the same physical resource block.
Figure 1 illustrates the Fixed Relays stations (RSs). RSs are low cost fixed radio infrastructures without wired backhaul connections. They store data received from BS and forward to the MSs, and vice-versa. Fixed relay stations (RSs) typically have smaller transmission powers and coverage areas than BSs. They enhance the capacity at specific regions, namely, cell borders, improving signal reception. By combining the signals from RSs and BSs, the MS is able to exploit the inherent diversity of the relay channel (see Figure 1). The disadvantages of RSs are the additional delays introduced in the relaying process and the potentially increased levels of interference due to frequency reuse.
Without any inter-cell interference co-ordination each sector of the cell has unlimited access to the whole bandwidth; this is reuse 1. Any inter-cell interference co-ordination scheme will restrict the resources available for scheduling. By limiting the (maximum) output power as a function of frequency and/or time, Pmax(f,t). We will limit the power Pmax both in time (sub-frame duration) and on frequencies f in a planned scheme on sectors of cells. A pure fractional frequency reuse 1/3 is achieved by dividing
the frequencies into three subsets f1, f2 and f3 and limiting
the power by setting max max ( , ) , ( , ) 0, n n P f t P f f P f t f f (1)
for each sector of the cell. With reuse partitioning [12] the spectrum is first divided into partitions and then each partition into the desired number of reuse subsets. The scheduler can then utilize the partitions depending on mobile radio position, based on path loss measurements. A reuse partition with a mixture of reuse 1 and 1/3 is achieved by dividing the frequencies into two partitions, fA and fB,
where fB further is divided into three resulting in four
subsets, fA, fB1, fB2 and fB3. The power limitation for the
fractional reuse subsets fBn is set as above described.
Soft reuse [13] (hybrid reuse partitioning) is a variant of reuse partitioning where a tighter reuse is achieved by using the same frequencies in more than one partition (fA=fB) but
with different power levels. If we apply to the fractional 1/3 reuse example, then we limit the power by setting
max max ( , ) , ( , ) , n n P f t P f f P f t p P f f (2)
Figure 2 illustrates the cellular layout (tri-sectored antenna pattern) indicating the fractional frequency reuse of 1/3 considered in the system level simulations. 1/3 of the available bandwidth was used in each sector to reduce the multi-cell interference. As indicated in Figure 2, the identification of the sources of multi-cell interference, i.e., the use of the same adjacent sub-carriers (named physical resource blocks) is given by the sectors with the same colour, green, yellow and pink. The small blue hexagons refer to the area where reuse 1 co-exists with the fractional reuse of 1/3 as an example of soft reuse.
In the analysis of the scenario Single-Cell Point-to-Multipoint (SC-PTM) there is one radio link between the mobile and the closest base station. It does not assume any time synchronism between the transmissions from different base stations with the same colour resulting in interference from all cells without the same colour. However, an adaptation of this scenario can include macro-diversity to help reduce interference levels. This can be accomplished by combining the two best radio links from surrounding BSs. In this case, time synchronization between the two closest base station sites with the same colour (i.e. transmitting in the same frequency) is assumed in order to combine them at the receiver using soft-combining techniques. Multi-cell interference is reduced because only the other base station sites with the same colour remain un-synchronous and capable to interfere.
In the MBSFN scenario there are at least three radio links, one for each of the three closest base stations to the mobile. Time synchronism is assumed between the transmissions from the closest base stations with the same colour resulting in much less interference from the cellular environment. This results in macro-diversity combining of the three best radio links.
Figure 2. Cellular Layout with mixed fractional frequency reuse, R=1500m
III. NUMERICAL RESULTS
To study the behavior of the proposed scheme, several Monte Carlo simulations were performed in the link level simulation. This study is valid for any OFDM system and it was performed using the LTE parameters mentioned 3GPP documents [14] for a 10MHz bandwidth, which are shown in Table I. The reference link level parameter for all simulation results (SISO and MIMO) presented in this paper is BLER=0.01. This reference applies to near real time services where retransmissions are not allowed. Two different coding rates 1/2 and 3/4 where chosen to check which one would offer the highest average spectral efficiency for the analyzed SC-PTM and MBSFN topologies. The path loss uses 3GPP distance attenuation formula in Table I, and the distance d, is the distance between the actual geographic location of the user and the BS to which it has a radio link established with the best signal to interference plus noise ratio (SINR) as the selection criteria. Small and large scale fading are also included in the system level simulator, according to the parameters of Table I.
Transmission BW 10 MHz
Distance attenuation (d =
distance in kilometers) L=122.23+34.88log(d) Base station power (40 W) 46dBm
Cell Radius (m) 1500, 2250
Cell Layout (hexagonal grid) 3 sectors/site Shadow fading Log-normal σ=8dB
User Mobility Random walk
Multipath fading 3GPP TypU, MBSFN
Max antenna gain (Angular spread model from SCM, including feeder loss)
15dBi
TABLE I. SIMULATION PARAMETERS FOR 10MHZ.
Coverage Results
In the system level simulations mobile users receive blocks of bits transmitted from base stations and each block undergoes small and large scale fading and multi-cell interference. In terms of coverage or throughput the SINR of each block is computed taking into account all the above impairments and based on the comparison between the reference SINR at a BLER of 1%, and the evaluated SINR it is decided whether the block is or not correctly received.
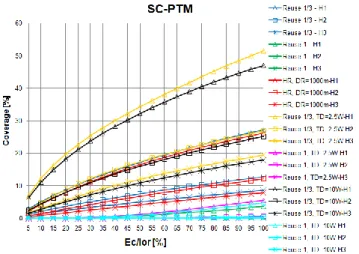
Figure 3 presents the coverage vs. the fraction of the total transmitted power (denoted as Ec/Ior), for hierarchical 64QAM (64-HQAM), coding rate 1/2 and SC-PTM scenario where different frequency reuse, namely, 1/3, 1 and hybrid 1+1/3 consisting of reuse 1 for users inside DR and reuse 1/3 for users outside DR (see Figure 2) is evaluated. All interfering sites transmit with the maximum power of 90% according to the parameters indicated in Table I. The cell radius R is 2250m, and strong blocks (H1) are separated from medium blocks (H2) and weak blocks (H3) without macro-diversity combining, denoted as 1RL. In addition, fixed relay with two different transmission powers, 10W and 2.5W are also illustrated (TD in the legend).
Figure 3. Coverage vs Ec/Ior SC-PTM (1RL) scenario, 64-HQAM, coding rate ½, R=2250m
With reuse 1/3, the base stations of the topology including fixed relays (FR) with TD=2.5W, provide the highest coverage (considering the coverage provided by BSs and RSs) followed by the topology with FR of TD=10W, the smallest coverage belongs to reuse 1. However, only reuse 1/3 with TD=2.5W is close to the reference value of 95% coverage. This is explained because the use of RSs allows the system to extend the coverage of BSs (especially at cell borders, see figure 7) without significant increase in intercell interference since RSs transmit with only 2.5W compared to 40W used by BSs. Depending on the value of transmitted power a cell area with different radius was considered. For TD=10W, the radius is R_relay=1500m and if TD=2.5W, R_relay=1000m. The results of Figures include the two R-relay values and show about the same normalized coverage independently of the transmitted power (TD). In this sense,
smaller TD is preferable to get higher power saving reduction and coverage gain.
Reuse 1 schemes have the worst overall performance as expected, since intercell interference in these is very high.
Figure 4 presents results for the same scenario in Figure 3, but using coding rate 3/4. In these case the performance of all schemes is greatly reduced due to higher coding rate used combined with 64QAM modulation and cell radius of 2250m. The same analysis done to Figure 3 can be applied, as we can see that reuse 1/3 with FRs provide the best coverage results and the smallest coverage belonging to reuse 1 scheme.
Figure 5 and Figure 6, present the results for the same scenarios but using hierarchical 16QAM (16-HQAM) instead. We can observe that with 16-HQAM there is a generalized gain in terms of coverage when compared to 64-HQAM. This is due to 16-HQAM being a lower level modulation, thus being more robust to fading and multi-cell interference. There is not a single 64-HQAM based scheme that is capable of achieving 95% coverage, therefore the use of lower coding rate (Figure 3), MIMO/SISO coordination with macro-diversity combining 2 radio links and hierarchical 16QAM is advised, to achieve the reference value.
Figure 4. Coverage vs Ec/Ior SC-PTM (1RL) scenario, 64-HQAM, coding rate ¾, R=2250m
Figure 5. Coverage vs Ec/Ior SC-PTM (1RL) scenario, 16-HQAM, coding rate ½, R=2250m
Figure 6. Coverage vs Ec/Ior SC-PTM (1RL) scenario, 16-HQAM, coding rate ¾, R=2250m
Figure 7. Coverage of Fixed Relays, and Base Stations, R=2250m.
The best results for 16-HQAM are achieved with reuse 1/3 with TD = 2.5W and reuse 1/3 with TD =10W.
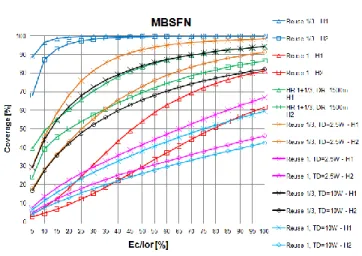
In Figure 8, the coverage performance curves for MBSFN scenario, versus Ec/Ior, are presented for cell radius of 2250m and should be compared to the corresponding results of Figure 3 for the SCPTM scenario. As expected there is a difference in the coverage between the two scenarios where MBSFN takes advantage of its lower inter-cell interference. The coverage values for reuse 1/3 H1 and H2 blocks is above 95% followed by reuse 1/3 with FR with TD=2.5W. The coverage of reuse 1 is the lowest. Reuse 1/3 can also introduce some energy saving advantage over other schemes since with just only 15% of Ec/Ior it can achieve coverage for H1 blocks over 95%, and furthermore, with just 50% of Ec/Ior the coverage for H1 and H2 blocks surpasses 95%.
There is no significant advantage in terms of coverage from using relay stations (RSs), since reuse 1/3 is better. This is due to the small amount of inter-cell interference in MBFSN scenario. However, as (RSs) have smaller transmission powers the comparison should take into account the reduction of the transmitted power in all the area. There are 12 RSs and 7 BSs in all area resulting in power saving advantage with RSs, especially with TD=2.5W.
Hybrid reuse with DR=1350m also achieves coverage values around 95%, and because it can use reuse 1 (for higher throughputs) and reuse 1/3 (for higher coverage) simultaneously it can be a good compromise between throughput vs. coverage. The coverage of reuse 1 is the lowest.
Figure 9 corresponds to Figure 8, but considering coding rate 3/4. In this case there is a reduction in coverage achieved for all schemes, and only reuse 1/3 and hybrid reuse can achieve 95% coverage. Reuse 1 has the worst coverage.
When we move to 16-HQAM (Figure 10 and Figure 11), we see that the coverage values improve slightly for all schemes, especially for reuse 1 based schemes. We also observe that with the same Ec/Ior, 16-HQAM modulation achieves higher coverage values than those of 64-HQAM, showing that using lower modulation schemes can improve coverage values and achieve power transmission savings.
Another important technique is the use of spatial multiplexing (MIMO) associated to signal space diversity (SSD) provided by CRM to enhance the capacity. The spectral efficiency of QPSK, 2x2MIMO is equivalent to H16QAM with SISO. Figure 12 and Figure 13 present the coverage vs. the fraction of the total transmitted power, for different coding rates considering the SC-PTM and MBSFN scenarios, respectively. Instead of H1 and H2 blocks now we have Antenna 1 (A1) and Antenna 2 (A2) blocks, where the coverage of each antenna is about the same. In the MBSFN scenario, we consider the existence of coordinated MIMO transmission, i.e., with macro-diversity combining the three best radio links. In addition to reuse 1/3, reuse 1 is also evaluated. As expected the coverage of reuse 1/3 is higher than the reuse 1 due to less inter-cell interference. With reuse 1/3 both coding rates assure the 95% coverage. The MBSFN scenario is preferable than SC-PTM because MBSFN takes advantage of its lower inter-cell interference.
Figure 16 and Figure 17 present the coverage vs. the fraction of the total transmitted power, for coding rate 1/2 and 3/4 respectively, considering the SC-PTM scenario and 4x4MIMO. Figures 11 and 12 correspond to the Figure 14 and Figure 15 but considering the MBSFN scenario.
The results are similar to the ones obtained to 2x2 MIMO. The coverage of reuse 1/3 is higher than the reuse 1 due to less inter-cell interference and the MBSFN scenario is better than SC-PTM because MBSFN takes advantage of its lower inter-cell interference. As expected, the code rate ½ presents better coverage than ¾.
Figure 8. Coverage vs Ec/Ior for MBSFN scenario, 64-HQAM, coding rate ½, R=2250m
Figure 9. Coverage vs Ec/Ior for MBSFN scenario, 64-HQAM, coding rate ¾, R=2250m
Figure 10. Coverage vs Ec/Ior for MBSFN scenario, 16-HQAM, coding rate ½, R=2250m
Figure 11. Coverage vs Ec/Ior for MBSFN scenario, 16-HQAM, coding rate ¾, R=2250m
Figure 12. 2x2MIMO coverage (%) vs. Ec/Ior (%), for SC-PTM scenario, R=2250m
Figure 13. 2x2MIMO coverage (%) vs. Ec/Ior (%), for MBSFN scenario, R=2250m
Figure 14. 4x4MIMO coverage (%) vs. Ec/Ior (%), for SC-PTM scenario, coding rate ½, R=2250m
Figure 15. 4x4MIMO coverage (%) vs. Ec/Ior (%), for SC-PTM scenario, coding rate ¾, R=2250m
Throughput Results
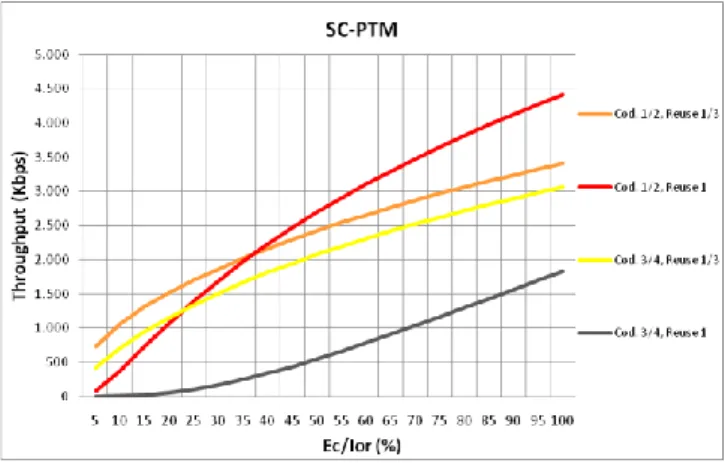
Figure 18 presents the average throughput distribution as function of Ec/Ior for H64QAM, coding rate 1/2 and the SC-PTM scenario without macro-diversity combining (1RL) for R=2250m and different reuse schemes. Here the results for schemes using BSs and RSs represent the joint throughput of those. We observe that the maximum throughput is achieved in the reuse 1/3 topology and RSs with TD=2.5W, as expected from the corresponding
Figure 16. 4x4MIMO coverage (%) vs. Ec/Ior (%), for MBSFN scenario, coding rate ½, R=2250m
Figure 17. 4x4MIMO coverage (%) vs. Ec/Ior (%), for MBSFN scenario, coding rate ¾, R=2250m
Figure 18. Throughput vs Ec/Ior for SC-PTM 64-HQAM, coding rate ½, Base Stations.
coverage values presented in Figure 3. HR is the second best, since it combines the coverage values achieved by using reuse 1/3 with the higher throughput achieved in the zones where users can use reuse 1.
With reuse 1/3 and RSs it was possible to increase the throughput compared to the single reuse 1/3, confirming the importance of having RSs in the cell area. Due to the smaller coverage, reuse 1 achieves the smallest throughput in spite of its higher inherent throughput. Users located closer to the base station have smaller inter-cell interference and higher throughput when reuse 1 is employed.
Figure 19 shows the respective throughput achieved only by RSs in Figure 18. As we can see, RSs have lower throughputs when compared to BSs, due to having transmission gaps where no information is transmitted and reduced power output. However, as we saw in Figure 18, the overall throughput when using a combination of BSs and RSs for SC-PTM is higher than those achieved by reuse 1 or 1/3, because BSs achieve significant higher throughputs when exists interfering RSs instead of BSs.
Figure 20 corresponds to previous Figure 18 but considering coding rate 3/4. We observe that the maximum throughput is achieved for reuse 1/3 and RS with TD=2.5W, followed by reuse 1/3 and RS with TD=10W. This was already expected due to higher coverage
associated to less inter-cell interference provided when reuse 1/3 schemes are used. We also denote that increasing the RS power output, from TD=2.5W to TD=10W slightly decreases maximum throughput, since RS transmitting with higher power will increase inter-cell interference, and reduce overall coverage as illustrated in Figure4. The results for RSs are presented in Figure 21. Again, RSs have lower throughput than BSs, but their reduced power output and transmission gaps greatly reduce intercell interference in neighbor cells, improving signal conditions and throughput in those.
Figure 19. Throughput vs Ec/Ior for SC-PTM, 64-HQAM, coding rate ½, Relay Stations.
Figure 20. Throughput vs Ec/Ior for SC-PTM 64-HQAM, coding rate ¾, Base Stations.
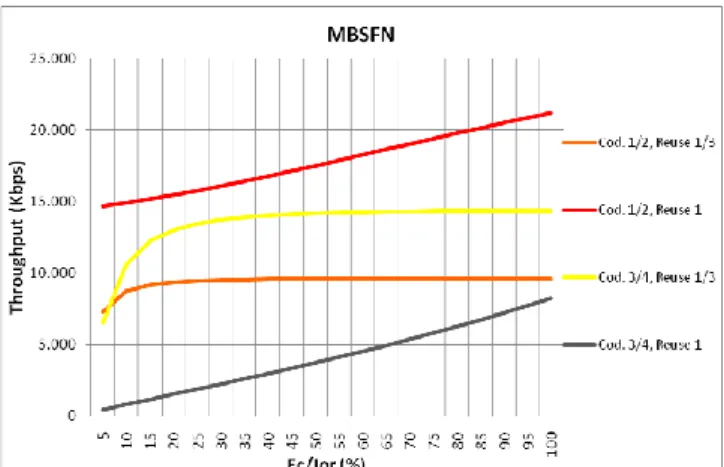
Figure 22 corresponds to Figure 18 but for MBSFN network. Hybrid reuse 1+1/3 achieves maximum throughput, followed by reuse 1 and reuse 1/3. This was already expected due to its higher coverage associated to less inter-cell interference provided by the SISO coordination of the MBSFN network. For this scenario, using RS is not essential due to the SISO coordination that increases both coverage and throughput, in particular, users located at the cell borders. Figure 24 and Figure 25 present the results considering coding rate 3/4. For this scenario the best results are achieved for hybrid reuse 1+1/3 and reuse 1/3. Reuse 1 and RS throughput results are almost three times lower than reuse 1/3, denoting the lack of robustness of the signal when higher coding rates are used. Reuse 1/3 and hybrid reuse are a better choice since they employ interference coordination.
For 16-HQAM and SC-PTM (Figure 26 to Figure 29) the maximum throughput achieved for all transmission schemes is slightly lower than 64-HQAM (due to lower modulation). Reuse schemes where BSs and RSs, namely reuse 1/3 with TD=2.5W, hybrid reuse 1+1/3 and reuse 1/3 achieve the best results like 64-HQAM. Also increasing coding rate (from 1/2 to 3/4) reduces the maximum throughput of all schemes, reducing signal robustness to transmission errors and interference and reducing overall coverage of cell area.
Figure 21. Throughput vs Ec/Ior for SC-PTM, 64-HQAM, coding rate ¾, Relay Stations.
Figure 22. Throughput vs Ec/Ior for MBSFN 64-HQAM, coding rate ½, Base Stations.
Figure 23. Throughput vs Ec/Ior for MBSFN, 64-HQAM, coding rate ½, Relay Stations.
Figure 24. Throughput vs Ec/Ior for MBSFN 64-HQAM, coding rate ¾, Base Stations.
Figure 25. Throughput vs Ec/Ior for MBSFN, 64-HQAM, coding rate ¾, Relay Stations.
Figure 26. Throughput vs Ec/Ior for SC-PTM 16-HQAM, coding rate ½, Base Stations.
Figure 27. Throughput vs Ec/Ior for SC-PTM, 16-HQAM, coding rate ½, Relay Stations.
Figure 28. Throughput vs Ec/Ior for SC-PTM 16-HQAM, coding rate ¾, Base Stations.
Figure 29. Throughput vs Ec/Ior for SC-PTM, 16-HQAM, coding rate ¾, Relay Stations.
Figure 30 to Figure 33 present the results for 16-HQAM and MBSFN network. When comparing the results for 16-HQAM (Figure 30) to 64-16-HQAM (Figure 22) when see that reuse 1 is now the reuse scheme that achieves higher spectral efficiency with around 10Mbps of throughput using all the transmission power available. This is happens because 16-HQAM is a modulation more robust and together with macro-diversity combining existing in MBSFN network allowing, this allows reuse one to take full advantage of using the total transmission bandwidth available.
Figure 30. Throughput vs Ec/Ior for MBSFN 16-HQAM, coding rate ½, Base Stations.
Figure 31. Throughput vs Ec/Ior for MBSFN, 16-HQAM, coding rate ½, Relay Stations.
Figure 32. Throughput vs Ec/Ior for MBSFN 16-HQAM, coding rate ¾, Base Stations.
Figure 33. Throughput vs Ec/Ior for MBSFN, 16-HQAM, coding rate ¾, Relay Stations.
To increase the spectral efficiency at the cell borders we will check the use of 2x2 and 4x4 MIMO associated with QPSK modulation and SSD provided by CRM. Figures 34 and Figure 35 presents the average throughput vs Ec/Ior for both coding rates 1/2 and 3/4, for the SC-PTM and MBSFN scenarios using MIMO 2x2. Figures 36 and 37 correspond to the Figures 21 and 22 but considering 4x4 MIMO. Table II shows a comparison between the system spectral efficiency. We observe that the maximum throughput is achieved for coding rate 1/2, reuse 1 and reaches more than 1.7bps/Hz/cell, or 1.4bps/. The existence of coordinated MIMO transmission in a scenario as MBSFN, with macro-diversity combining the three best radio link, provides higher values of throughput.
Please note that E-MBMS services use dedicated carriers, and because of this, all the available transmission power can be used to achieve the results we present. This confirms the higher spectral efficiency of MIMO compared to 64-HQAM (presented in Figure 24) independently of the chosen reuse scheme. There is no advantage in using coding rate ¾ due to its lower coverage, in spite of higher maximum throughput.
IV. CONCLUSIONS
In this work, we have analyzed interference coordination methods for Evolved-Multimedia Broadcast/Multicast Service (E-MBMS) in Long-Term Evolution Advanced (LTE-A).
Based on the average coverage and throughput simulation results, for the SCPTM scenario it is recommended the use of reuse 1/3 and Relay Stations to increase the coverage and throughput of users located at cell borders.
For the MBSFN scenario we also recommend the use of reuse 1/3 or the hybrid reuse 1+1/3 due to their best compromise between coverage and maximum achieved throughput. Relay Stations are not necessary due to the availability of SISO coordination in the MBSFN scenario.
The introduction of signal space diversity, converted to frequency diversity in multi-path Rayleigh channels with OFDMA transmission and spatial multiplexing 4x4 and 2x2 MIMO enables enhancing the spectral efficiency at the cell borders of MBSFN. The coding rate 1/2, reuse 1 provides the highest spectral efficiency. It is not recommended to increase the coding rate within the MBSFN network to not decrease the throughput at the cell borders.
Acknowledgment
This work was supported by the internal Instituto de Telecomunicações (IT) project designated as COILS.
Figure 34. 2x2MIMO Throughput vs Ec/Ior for SC-PTM scenario
Figure 35. 2x2MIMO Throughput vs Ec/Ior for MBSFN scenario
Figure 36. 4x4MIMO Throughput vs Ec/Ior for SC-PTM scenario
203
Figure 37. 4x4MIMO Throughput vs Ec/Ior for MBSFN scenario
Reuse Type Scenario Coding Fixed Relay Power (W) System spectral efficiency ((bit/s)/Hz per site) Reuse 1/3 SCPTM 3/4 N.A. 0.125 2.5 0.310 10 0.345 MBSFN 3/4 N.A. 0.760 2.5 0.302 10 0.310 MBSFN – MIMO 2x2 1/2 N.A. 0.540 3/4 N.A. 0.720 MBSFN – MIMO 4x4 N.A. 0.920 N.A. 1.480 Reuse 1 SCPTM 3/4 N.A. 0.010 2.5 0.025 10 0.022 MBSFN 3/4 N.A. 0.140 2.5 0.240 10 0.245 MBSFN – MIMO 2x2 1/2 N.A. 1.100 3/4 N.A. 0.530 MBSFN – MIMO 4x4 1/2 N.A. 2.080 3/4 N.A. 0.830 Hybrid (1+1/3) SCPTM 1/2 N.A. 0.350 MBSFN 3/4 N.A. 1.000
TABLE II. SYSTEM SPECTRAL EFFICIENCY FOR 64-HQAM AND MIMO
References
[1] P. Gomes, J. Seguro, A. Correia, “MIMO Coordnation for E-MBMS Transmissions in LTE-A”, 6th International Conference on Wireless and Mobile Communications (ICWMC’2010), Valencia, Spain, pp. 291-296, September 2010.
[2] 3GPP, “Feasibility Study on Improvement of the Multimedia Broadcast Multicast Service (MBMS); (Release 7)”, TR 25.905 v7.2.0 (2009-12). http://www.3gpp.org [last access; June 24, 2010] [3] 3GPP, “Physical Layer Aspects for Evolved UTRA;
(Release 7)“, TR 25.814 v7.1.0 (2009-12). http://www.3gpp.org [last access; June 24, 2010] [4] I. Katzela and M. Naghshineh, “Channel Assignment
Schemes for Cellular Mobile Telecommunication Systems: A Comprehensive Survey”, IEEE Personal Communications, vol. 3, pp. 10-31, June 1996.
[5] C. X. Wang et al. “Cooperative MIMO Channel Models: A Survey”, IEEE Communications Magazine, vol. 48, pp. 80-87, February 2010.
[6] J. Seguro, P. Gomes, N. Souto, A. Correia, R. Dinis,”Rotation Matrices for OFDM Transmission”, IEEE EUROCON’2011, Lisbon, Portugal, April 2011. [7] A. Correia, “Optimised Complex Constellations for
Transmitter Diversity, WPC Journal, Kluwer Pub., pp. 267-284, 2002
[8] M. Silva, A. Correia, R. Dinis, N. Souto, J. Silva, “Transmission Techniques for Emergent Multicast and Broadcast Systems”, CRC Press, 2010
[9] L. Song, J. Shen, “Evolved Cellular Optimisation for UMTS and LTE”, CRC Press, 2010
[10] CX Wang et. Al. “Cooperative MIMO Channels: A Survey”, IEEE Communications Magazine, Feb. 2010, pp. 81-87
[11] S. Ma, Y. Yang & H. Sharif “Distributed MIMO Technologies in Cooperative Wireless Networks”, IEEE Communications Magazine, May 2011, pp. 78-82 [12] T. Salvalaggio, “On the Application of Reuse
Partitioning”, in IEEE 38th Vehicular Technology
Conference, Philadelphia, pp. 182-185, June 1988. [13] G. Fodor, “Performance Analysis of a Reuse
Partitioning Technique for OFDM Based Evolved UTRA”, in IEEE 14th International Workshop on QoS,
New Haven, pp. 112-120, June 2006.
[14] 3GPP, “Evolved-UTRA Radio Frequency (RF) System Scenarios; (Release 9)” TR 36.942 v9.2.0 (2009-12). http://www.3gpp.org [last access; June 24, 2010]