Objective: To establish waist circumference cut off points according to pubertal staging to identif y over weight in adolescents.
Methods: Longitudinal study approved by the Ethics Research Committee and conducted with 557 adolescents, aged 10 to 15 years old, selected from public schools. Waist, arm, neck and hip circumferences, body fat percentage, body mass index (BMI), height and blood pressure were measured. Pubertal staging was evaluated by Tanner self assessment scale. The Receiver Operating Characteristic Curve (ROC curve) was used to determine predictive power, sensitivity, specificity and waist circumference cut off points to detect overweight.
Results: There was a positive correlation between waist circumference and weight, BMI, upper arm and hip circumferences, waist-to-hip ratio and blood pressure in both sexes. Cut off points for waist circumference according to pubertal stage as related to overweight in adolescents with the best performances in ROC curve were: 71.65 cm for prepubescent girls, 67.90 cm for pubescent girls, 70.25 cm for post pubescent girls, and 66.45 cm for pubescent boys. Age, weight, height, BMI, body fat percentage, arm and hip circumferences were associated to altered waist circumference.
Conclusions: The establishment of cut off points for waist circumference according to pubertal staging was proven a good means to identify overweight. These cut off points can be considered reliable for the Brazilian adolescent population, as the isolated use of chronological age in adolescents may underestimate their nutritional status.
Keywords: Waist circumference; Adolescent; Puberty; Overweight.
Objetivo: Elaborar pontos de corte de circunferência da cintura de acordo com o estadiamento puberal para identificar sobrepeso em adolescentes.
Métodos:Trata‑se de um estudo longitudinal, aprovado pelo Comitê de Ética em Pesquisa, com 557 adolescentes, de 10 a 15 anos de idade, selecionados em escolas públicas. Aferiram-se as medidas de circunferência de cintura, braço, pescoço e quadril, percentual de gordura, massa corporal, estatura e pressão arterial. Para determinar a maturação sexual, foi utilizada a autoavaliação da escala de Tanner. Aplicou-se a curva ROC (Receiver Operating Characteristic Curve) para determinar: poder preditivo, sensibilidade, especificidade e os pontos de corte de circunferência de cintura para identificação de sobrepeso.
Resultados: Observou-se correlação positiva entre circunferência de cintura e massa corporal, índice de massa corporal (IMC), circunferência do braço e quadril, razão cintura/quadril e pressão arterial em ambos os sexos. Os pontos de corte para circunferência de cintura de acordo com o estadiamento puberal para identificação de sobrepeso que apresentaram maior desempenho na curva ROC foram: 71,65 cm para meninas pré-púberes, 67,90 cm para meninas púberes, 70,25 cm para meninas pós-púberes e 66,45 cm para meninos púberes. Faixa etária, massa corporal, estatura, IMC, porcentagem de gordura, circunferência do braço e do quadril foram considerados fatores preditores da circunferência da cintura alterada.
Conclusões: Os pontos de corte de circunferência da cintura de acordo com o estadiamento puberal demonstraram excelente desempenho para a identificação de sobrepeso, podendo ser considerados fidedignos para a população de adolescentes brasileiros, uma vez que utilizar apenas a idade cronológica na adolescência pode subestimar o estado nutricional.
Palavras‑chave: Circunferência da cintura; Adolescente; Puberdade; Sobrepeso.
ABSTRACT
RESUMO
*Corresponding author. E-mail: [email protected] (A.P. Ganen). aCentro Universitário São Camilo, São Paulo, SP, Brazil.
bUniversidade Federal de São Paulo, São Paulo, SP, Brazil.
CUT OFF VALUES FOR WAIST CIRCUMFERENCE
TO PREDICT OVERWEIGHT IN BRAZILIAN
ADOLESCENTS, ACCORDING TO PUBERTAL STAGING
Pontos de corte de circunferência da cintura de acordo com o
estadiamento puberal para identificar sobrepeso em adolescentes
Ivete Alves dos Santos
a, Maria Aparecida Zanetti Passos
b, Isa de Pádua Cintra
b,
INTRODUCTION
According to the World Health Organization (WHO),1
ado-lescents are individuals aged between 10 years and 19 years, 11 months and 29 days, characterized as going through intense physiological, psychosocial, behavioral, cultural, and emotional changes.2,3 In puberty, hormonal changes
responsible for the appearance of secondary elements and physical changes take place. Therefore, the degree of physi-cal development of adolescents cannot be solely determined by chronological age, since it is influenced by other envi-ronmental and intrinsic factors.4
Adolescence can be considered a critical time for the onset of obesity. Studies have shown that adolescents have inadequate food preferences, with high consumption of processed and ultra-processed foods, which may favor dis-eases such as obesity, diabetes, hypertension, and metabolic syndrome.5-7 Obesity is explained as an inflammatory
dis-ease of multifactorial etiology, resulting from imbalance of energy balance and promoting accumulation of adipose tissue. Fat accumulation in the abdominal region implies increase in inflammatory adipokines, which, in turn, inten-sifies the risk of insulin resistance and the frequency of car-diovascular diseases.5
Thus, evaluating anthropometric measures associated with cardiometabolic markers becomes essential to identify risks of developing non-communicable chronic diseases. Waist circumference has been considered an important data for this assessment, whose measurement is low-cost and has excellent association with body image exams and cardiovas-cular risk markers.5-7 Increase in children and adolescents’
waist circumference, with cut-off points suggested by three authors in different years, showed a good correlation with dyslipidemia, hypertension, insulin resistance, and metabolic syndrome.7-9 A longitudinal study reported an increase in
body fat percentage of post-pubertal girls, with strong cor-relation between the weight gain and waist circumference at the age of menarche.10
Thus, nutritional status assessment should be performed in adolescents according to their pubertal staging, since changes in it strongly influence the process of sexual mat-uration. Excessive visceral adiposity has been associated with early menarche10 and negative impacts on bone mass
and bone mineral density in both genders. Higher growth rate and advanced bone aging have also been identified, including the progression of pubertal events in overweight adolescents, although it has not resulted in benefits to final stature gain.2,11,12
In addition, it is vital to monitor nutritional status and to recognize factors leading to such changes from a
public-health standpoint, which requires interventions to reduce risks and improve the quality of life of children and adolescents.13
The lack of studies associating anthropometric markers and indicators of cardiometabolic risks with pubertal devel-opment is evidenced. That being said, the main purpose of this study was to establish cut-off points for waist circumfer-ence indicating overweight in Brazilian adolescents according to pubertal staging.
METHOD
This was a longitudinal observational study conducted for three years, abiding by the guidelines for research involving human beings, contemplated by the National Health Council Resolution.13 The project was also approved by the Research
Ethics Committee of Centro Universitário São Camilo, proto-col number 60/2016. To that end, the informed consent form was obtained from the directors of the educational units, from parents or guardians of participants, and from adolescents tak-ing part in it.
After obtaining the list of schools under the jurisdic-tion of the General Secretariat of Educajurisdic-tion of the State of São Paulo, according to the 2010 School Census, a draw was made to find a sample representative of the city of São Paulo. After the management’s approval, a meeting was held with teachers to orient them on how to approach adolescents and collect data. Afterwards, the free and informed con-sent form was collected from parents and guardians, and the agreement form was signed by the adolescents. A total of 557 adolescents aged 10 to 15 years, from three public schools in the city of São Paulo, were selected for meet-ing the followmeet-ing inclusion criteria: age between 10 and 15 years, enrolled in the last year of primary education to the third year of high school. Exclusion criteria were: be taking part in a weight loss program, presenting chronic or mental illness, using medications that could interfere with body composition and blood pressure (BP), as well as ges-tation and lacges-tation.
Weight was measured in a portable digital scale of the brand Seca®
(Seca Brasil, Cotia, São Paulo, Brazil), with a capacity for 150 kg. The adolescents were weighed while standing on the platform, barefoot, in light clothing and in a firm posi-tion with their arms along the body, with one decimal place being considered.14
Height was obtained in a digital wall stadiometer of the brand Seca®
(Seca Brasil, Cotia, São Paulo, Brazil), at 90º to the floor, fixed to a wall without skirting board. The participant was instructed to stand barefoot, without a cap and with loosen hair, eyes and ears lined horizontally, inhaling, and with their back to the instrument.
BMI was then calculated using weight and height values.14
For this purpose, the weight in kilograms (kg) was divided by the square height in meters (m). Standards established by WHO in 200715 were used, considering the following BMI Z scores
for age: <-3: accentuated thinness; ≥-3 and <-2: thinness; ≥-2 and ≤+1: eutrophy; ≥+1 and ≤+2: overweight; ≥+2 and ≤+3: obesity; >+3: severe obesity.
Arm circumference (AC) was measured with an inelastic tape (Seca Brasil, Cotia, São Paulo, Brazil), with the teenager standing up with arms positioned along the trunk, palms facing their thighs, wearing sleeveless clothes to allow full exposure of the shoulder area. To locate the midpoint, the left elbow was flexed at 90º, the distance between the acro-mion and the olecranon being measured and the midpoint between both extremes marked. The measuring tape was positioned perpendicular to the long axis of the arm at the midpoint marked, and the circumference was measured from the nearest to 0.1 cm.16
For the hip circumference (HQ), in cm, the same mea-suring tape was used to check the perimeter of the hip in the area with the largest apparent circumference of the gluteal region.17 Waist-to-hip ratio (WHR) was calculated by
divid-ing the waist circumference (WC) (cm) by the perimeter of the hip (cm).18
Tricipital and subscapular skinfolds thickness was also checked for body fat percentage (BF%) using the equation proposed by Slaughter et al.19 and classified by Lohman.20 WC (in cm)
was obtained with the same measuring tape (Seca Brasil, Cotia, São Paulo, Brazil), from the midpoint between the last costal arch and the iliac crest.17
Finally, for neck circumference (NC, in cm), participants would stand, erect and with their head positioned in the Frankfurt horizontal plane. The upper end of the measuring tape was placed just below the laryngeal prominence and posi-tioned perpendicular to the long axis of the neck at the thyroid cartilage level, and the circumference was measured from the nearest to 0.1 cm.21
BP was measured by an indirect method, with an aus-cultatory technique and a mercury or aneroid sphygmoma-nometer, both calibrated. Patients’ preparation followed a protocol, in compliance with the 5th Brazilian Guidelines for Hypertension, 2006.22 Three measures were taken, with
a 1-minute interval between each of them, and the average value of the last two was considered the adolescent’s BP. BP values were classified as suggested by the International Diabetes Federation (IDF),23 according to which arterial hypertension
is identified by systolic blood pressure values ≥130 mmHg and diastolic blood pressure ≥85 mmHg for individuals aged 10 to 16 years or older.
By the self-evaluation technique, pubertal staging was defined based on the classification proposed by Tanner,3
which uses five levels to classify breast development (M1, M2, M3, M4, M5) for girls and the development of gen-italia (G1, G2 , G3, G4, G5) for boys, being considered prepubertal adolescents those who report being in M1 and G1, pubertal from M2 to M4 or G2 to G4, and post-pu-bertal M5 and G5. At this session, after each student had their anthropometric data measured, they were taken to an isolated place of the room where the researcher explained the importance of evaluating sexual maturation and presented them boards with images of breasts/genitalia and pubic hair. This procedure was taken very carefully and strictly so as not to cause the student to be embarrassed or uncomfort-able and end up pinpointing any stage indistinctly. For data analysis, we decided to use development of organs for both gender, since pubic hairiness on its own can be influenced by ethnic characteristics.
Upon statistical analysis, the results were described in absolute numbers and proportions for categorical data, and in mean and standard deviation (SD) for numerical data. In order to verify data distribution, the Kolmogorov Smirnov test was applied. Comparison of numerical vari-ables between genders was performed with the Mann-Whitney test, and the Kruskal-Wallis test was applied to compare three or more groups. The McNemar-Bowker, Friedman and Wilcoxon tests were used to compare the variables obtained in the three evaluation sessions. For com-paring the longitudinal measures from the three evalua-tions carried out in each year between groups, the analy-sis of variance for repeated measures (ANOVA) was used, followed by Tukey’s post-hoc test.
curve). The total area under the ROC curve between waist circumference and overweight/obesity prevention was iden-tified. The greater the area under the ROC curve, the greater the discriminatory power and the 95% confidence interval (95%CI). Sensitivity and specificity of waist circumference cut-off points were also calculated.
To identify the association between WC and indepen-dent variables, a univariate logistic regression analysis was performed. Binary regression was used to estimate odds ratio (OR) for the risk of altered waist circumference as a result.
All calculations were performed in the Statistical Package for Social Sciences (SPSS) version 20.0 (IBM, New York, New York, USA), and the significance level was set at p<0.05.
RESULTS
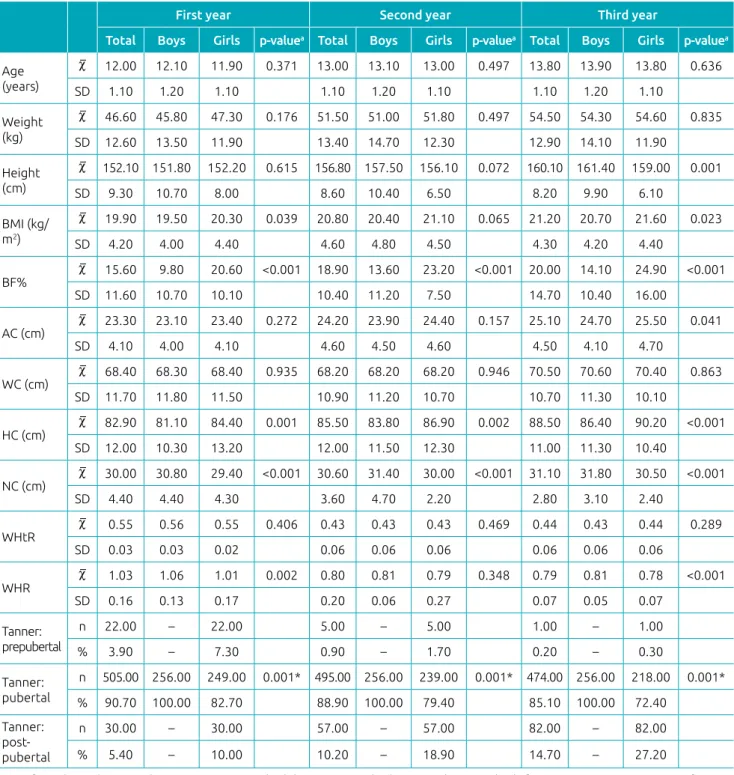
During the study period, BMI, BF%, HC and NC were statistically different in both genders. Mean BMI, HC, and BF% values were higher in girls, and NC was higher in boys. In the last year of study, BF% was perceived higher in girls, while the mean progressive increase in height was higher in boys over the three years. Across three years of research, pubertal staging progressed for subjects of both genders. In the first year, most of participants were in the pubertal stage, while in the last year they were found to be in post-pubertal phase, with only one girl in the pre-puber-tal phase (Table 1).
A significant correlation was found between WC and the other variables, except for WHR in girls. A strong positive correlation between WC and body mass, BMI, HC, AC, NC and waist-to-height ratio (WHtR) in both sexes (Table 2).
When analyzing the cut-off points for WC in girls, there were not enough individuals in the prepubertal stage in the second and third years of study to build the ROC curve. The cut-off points for WC for girls with better performance, that is, area under the ROC curve with high sensitivity and specificity to identify overweight, were 71.65 cm for prepu-bertal subjects, 67.9 cm for puprepu-bertal subjects, and 70.25 cm for post-pubertal subjects. For pubertal boys, the cut-off was 66.45 cm (Table 3).
In Table 4, the adjusted logistic regression analysis shows that age, body mass, stature, BMI, BF%, AC and HC were consid-ered predictors of altconsid-ered WC. The association between altconsid-ered WS and BMI (OR=2.29, 95%CI 1.99–2.62; p≤0.001), NC (OR=3.09, 95%CI 1.65–2.82; p≤0.001), and AC (OR=2.11, 95%CI; 1.87–2.39, p≤0.001).
DISCUSSION
The most important finding of our research is the estab-lishment of cut-off points to identify overweight accord-ing to pubertal stagaccord-ing, since chronological age may not represent a safe parameter for nutritional evaluation and characterization of the nutritional status of adolescents at this stage of development. Associating pubertal staging with the cut-off point of a simple anthropometric mea-sure to identify the risk of overweight allows the health professional a better understanding and more assertive clinical management.24
As pubertal staging progresses, one notes the appearance of typical characteristics in body composition, according to gen-der. Upon temporal evaluation, the highest BF% was found in girls in the last year of study. This difference in body compo-sition, in addition to higher BMI and HC, can be considered a result of pubertal events, with greater acquisition of muscle mass in males and greater fat deposition in the hip region and BF% in females, which give them gender-like forms. In this period of adolescence, nutritional status may strongly influence pubertal development, with emphasis to body fat deposition and distribution.25
An epidemiological study reported the role of adipose tissue in triggering and maintaining reproductive activity.25
Adrenal and ovarian androgen production are elevated when there is obesity. The aromatization of androgens, which con-verts them into estrogens, occurs in adipose tissue for both gender and is strongly related to body weight.26 A recent study
on the impact of excess body fat on bone remodeling of ado-lescents showed that body fat promotes a negative impact on bone mass, as well as bone aging and pubertal events’ accel-eration in both genders.11
Research has shown that abdominal obesity, even with-out other risk factors associated, is strongly related to the development of metabolic syndrome in young popula-tions. Thus, WC can be considered an efficient indicator of abdominal obesity and, consequently, of cardiovascular risk among children and adolescents.6,27,28 In a recent study
with obese adolescents, a positive correlation between WC and BMI was reported in both genders, which corrobo-rates our results.6
Supporting our findings, Mazicioglu et al.29 also
WC in males was higher and there was a relation between very high WC and increased NC.21 Hence, WC alterations
reflected the pattern of fat distribution and changes in risk factors for cardiovascular diseases in males. Some authors have identified a strong association between WC and car-diovascular events.29,30
WC has been used as a reliable instrument to evalu-ate central obesity in clinical practice, because it is sim-ple to measure, is low-cost, and has excellent correlation with abdominal imaging tests and association with cardio-vascular disease risk.30 Important to note that computed
tomography (CT) scan and magnetic resonance imaging
Table 1 Descriptive analysis of anthropometric variables (mean and standard deviation) of adolescents according to gender, during the study.
First year Second year Third year
Total Boys Girls p‑valuea Total Boys Girls p‑valuea Total Boys Girls p‑valuea
Age (years)
12.00 12.10 11.90 0.371 13.00 13.10 13.00 0.497 13.80 13.90 13.80 0.636
SD 1.10 1.20 1.10 1.10 1.20 1.10 1.10 1.20 1.10
Weight (kg)
46.60 45.80 47.30 0.176 51.50 51.00 51.80 0.497 54.50 54.30 54.60 0.835
SD 12.60 13.50 11.90 13.40 14.70 12.30 12.90 14.10 11.90
Height (cm)
152.10 151.80 152.20 0.615 156.80 157.50 156.10 0.072 160.10 161.40 159.00 0.001
SD 9.30 10.70 8.00 8.60 10.40 6.50 8.20 9.90 6.10
BMI (kg/ m2)
19.90 19.50 20.30 0.039 20.80 20.40 21.10 0.065 21.20 20.70 21.60 0.023
SD 4.20 4.00 4.40 4.60 4.80 4.50 4.30 4.20 4.40
BF% 15.60 9.80 20.60 <0.001 18.90 13.60 23.20 <0.001 20.00 14.10 24.90 <0.001
SD 11.60 10.70 10.10 10.40 11.20 7.50 14.70 10.40 16.00
AC (cm) 23.30 23.10 23.40 0.272 24.20 23.90 24.40 0.157 25.10 24.70 25.50 0.041
SD 4.10 4.00 4.10 4.60 4.50 4.60 4.50 4.10 4.70
WC (cm) 68.40 68.30 68.40 0.935 68.20 68.20 68.20 0.946 70.50 70.60 70.40 0.863
SD 11.70 11.80 11.50 10.90 11.20 10.70 10.70 11.30 10.10
HC (cm) 82.90 81.10 84.40 0.001 85.50 83.80 86.90 0.002 88.50 86.40 90.20 <0.001
SD 12.00 10.30 13.20 12.00 11.50 12.30 11.00 11.30 10.40
NC (cm) 30.00 30.80 29.40 <0.001 30.60 31.40 30.00 <0.001 31.10 31.80 30.50 <0.001
SD 4.40 4.40 4.30 3.60 4.70 2.20 2.80 3.10 2.40
WHtR 0.55 0.56 0.55 0.406 0.43 0.43 0.43 0.469 0.44 0.43 0.44 0.289
SD 0.03 0.03 0.02 0.06 0.06 0.06 0.06 0.06 0.06
WHR 1.03 1.06 1.01 0.002 0.80 0.81 0.79 0.348 0.79 0.81 0.78 <0.001
SD 0.16 0.13 0.17 0.20 0.06 0.27 0.07 0.05 0.07
Tanner: prepubertal
n 22.00 – 22.00 5.00 – 5.00 1.00 – 1.00
% 3.90 – 7.30 0.90 – 1.70 0.20 – 0.30
Tanner: pubertal
n 505.00 256.00 249.00 0.001* 495.00 256.00 239.00 0.001* 474.00 256.00 218.00 0.001*
% 90.70 100.00 82.70 88.90 100.00 79.40 85.10 100.00 72.40
Tanner: post‑ pubertal
n 30.00 – 30.00 57.00 – 57.00 82.00 – 82.00
% 5.40 – 10.00 10.20 – 18.90 14.70 – 27.20
at-test for independent samples: *p<0.05; SD: standard deviation; BMI: body mass index; BF%: body fat percentage; AC: arm circumference;
Total Boys Girls
ra p‑value ra p‑value ra p‑value
Age (years) 0.20 <0.001 0.17 0.006 0.23 <0.001
Weight (kg) 0.84 <0.001 0.86 <0.001 0.83 <0.001
Height (cm) 0.35 <0.001 0.39 <0.001 0.28 <0.001
BMI (kg/m2) 0.85 <0.001 0.88 <0.001 0.84 <0.001
Body fat percentage 0.51 <0.001 0.58 <0.001 0.61 <0.001
Neck circumference (cm) 0.99 <0.001 0.99 <0.001 0.99 <0.001
Hip circumference (cm) 0.82 <0.001 0.87 <0.001 0.79 <0.001
Arm circumference (cm) 0.79 <0.001 0.83 <0.001 0.76 <0.001
WHtR 0.74 <0.001 0.71 0.001 0.78 <0.001
WHR -0.09 0.031 -0.26 <0.001 -0.02 0.195
Systolic blood pressure (mmHg) 0.26 <0.001 0.27 <0.001 0.26 <0.001
Diastolic blood pressure (mmHg) 0.26 <0.001 0.21 0.001 0.33 <0.001
Table 2 Correlation between waist circumference, anthropometric variables and blood pressure levels in adolescents, according to gender.
aPearson’s correlation, performed according to variables’ mean values for all three years of study; BMI: body mass index: WHtR:
waist-to-height ratio; WHR: waist-to-hip ratio.
Area under the
ROC curve 95%CI Cut-off point S E
First year
Boys
Prepubertal – – – – –
Pubertal 0.91 0.87–0.94 66.65 0.89 0.74
Post-pubertal – – – – –
Girls
Prepubertal 0.98 0.95–1.00 71.65 1 0.95
Pubertal 0.87 0.82–0.92 69.15 0.82 0.83
Post-pubertal 0.91 0.80–1.00 70.50 0.72 0.88
Second year
Boys
Prepubertal – – – – –
Pubertal 0.9 0.85–0.94 68.75 0.82 0.86
Post-pubertal – – – – –
Girls
Prepubertal – – – – –
Pubertal 0.89 0.85–0.93 67.90 0.81 0.82
Post-pubertal 0.91 0.84–0.98 68.25 0.78 0.83
Third year Boys
Prepubertal – – – – –
Pubertal 0.91 0.87–0.94 69.90 0.82 0.83
Post-pubertal – – – – –
Girls
Prepubertal – – – – –
Pubertal 0.84 0.78–0.90 70.05 0.71 0.72
Post-pubertal 0.92 0.86–0.97 70.25 0.82 0.84
Table 3 Results of waist circumference cut-off points in identifying overweight/obesity, according to pubertal staging and gender, over the three years of study.
Waist circumference*
OR (95%CI) p‑value
Gender 0.570
Female 1.00
Male 0.90 (0.65–1.26)
Age (years) 1.34 (1.15–1.56) <0.001
Weight (kg) 1.27 (1.22–1.32) <0.001
Height (cm) 1.08 (1.06–1.11) <0.001
BMI (kg/m2) 2.29 (1.99–2.62) <0.001
Body fat percentage 1.13 (1.10–1.16) <0.001
Neck circumference
(cm) 3.09 (1.65–2.82) <0.001
Hip circumference
(cm) 2.11 (1.87–2.39) <0.001
Arm circumference
(cm) 1.29 (1.23–1.34) <0.001
Waist‑to‑hip ratio 0.05 (0.05–0.59) 0.017
Systolic blood
pressure (mmHg)#
Normal –
Hypertension 1 –
Diastolic blood
pressure (mmHg) 0.231
Normal 1
Hypertension 1 1.21 (0.87–1.98)
Table 4 Association between waist circumference cut-off point for identification of overweight and independent variables by logistic regression model.
*Adjusted for year of study; OR: odds ratio; 95%CI: 95% confidence
interval; BMI: body mass index; #insufficient number of subjects with
hypertension, with no possibility of logistic regression for this variable.
(MRI) are considered gold standard to assess body fat dis-tribution. Dual X-ray absorptiometry (DEXA), in turn, measures total body fat with high accuracy and low radi-ation, but does not distinguish intra-abdominal from subcutaneous fat.30
IDF23 proposes WC as a diagnostic data for adolescents,
since it has been referred to as an important predictor of metabolic syndrome and cardiovascular disease risk.26,27
However, WC cut-off points adopted by this guideline for individuals older than 16 years are >90 cm for male adoles-cents and >80 cm for female adolesadoles-cents. These cutoff values
were based on a South Asian population and, for children under 16 years of age, cut-off points are age-specific and gender-specific only.23
The cut-off points found over the three years of our study for post-pubertal girls were lower than those adopted by IDF. Thus, it can be inferred that cut-off points not taking into account pubertal staging and ethnicity may underestimate a possible nutritional and cardiometabolic risk. It is therefore believed that the cut-off points iden-tified by the present research can be more suitable to our population, since they were obtained based on puber-tal development staging and established on a sample of Brazilian individuals.
An international study conducted with children and adolescents reported WC reference values similar to those obtained in our study.8 In contrast, two other investigations
had cut-off points subtly lower for girls compared to our findings for this gender.31,32 National studies conducted with
adolescents have also reported WC cut-off points similar to ours.10,33 Thus, together, these results suggest WC to be an
important anthropometric indicator of overweight, but this measure should be evaluated as linked to the pubertal devel-opment phases of subjects, and also considering the ethnicity of the studied population.
Some limitations should be taken into account when inter-preting results, including the larger number of girls compared to boys in the sample. When categorizing individuals accord-ing to pubertal stagaccord-ing, we noticed an insufficient number of individuals in the prepubertal stage, making it impossible to build the WC ROC curves.
However, it should be noted that the longitudinal design of this study made it possible to follow the evolution of anthro-pometric data and pubertal staging changes, resulting in the establishment of cut-off points based on pubertal develop-ment, which promotes major changes in body composition during adolescence, and thus allowing a more accurate and reliable tool to identify overweight in the Brazilian adoles-cent population.
Conclusion is that WC cut-off points applied to anthro-pometric evaluation of adolescents are an excellent screening tool for early identification of overweight and obesity, helping to target food reeducation and increased physical activity pro-grams as means of preventing comorbidities.
Funding
This study did not receive funding.
Conflict of interests
REFERENCES
1. World Health Organization. Young people’s healthy – a challenge for society. Report of a WHO Study group on young people and health for all. Technical Report Series 731. Geneva: WHO; 1986.
2. Mosca LN. Densidade mineral óssea de adolescentes sobrepesos, obesos e superobesos: o impacto do excesso de gordura corporal sobre a massa óssea [master´s thesis]. Botucatu (SP): UNESP; 2013.
3. Tanner JM. Growth at adolescence; with a general c o n s i d e r a t i o n o f t h e e f f e c t s o f h e r e d i t a r y a n d environmental factors upon growth and maturation from birth to maturity. 2nd ed. Oxford: Blackwell Scientific Publications; 1962.
4. Saito MI, Silva LE, Leal MM. Adolescência: prevenção e risco. 2a ed. São Paulo: Atheneu; 2007.
5. Associação Brasileira para o Estudo da Obesidade e Síndrome Metabólica. Diretrizes Brasileiras de Obesidade. 4a ed. São Paulo: ABESO; 2016.
6. Clemente AP, Netto BD, Carvalho-Ferreira JP, Campos RM, Piano Ganen A, Tock L, et al. Waist circumference as a marker for screening nonalcoholic fatty liver disease in obese adolescents. Rev Paul Pediatr. 2016;9:47-55. 7. Freedmann DS, Serdula MK, Srinivasan SR, Berenson
GS. Relation of circumferences and skinfold thicknesses to lipid and insulin concentrations in children and adolescents: the Bogalusa Heart Study. Am J Clin Nutr. 1999;10:308-17.
8. McCarthy HD, Jarret KV, Crawley HF. The development of waist circumference percentiles in British children aged 5.0–16.9 y. Eur J Clin Nutr. 2001;55:902-7.
9. Jollife CJ, Janssen I. Development of age-specific adolescent metabolic syndrome criteria that are linked to the Adult Treatment Panel III and International Diabetes Federation Criteria. J Am Coll Cardiol. 2007;8:891-8.
10. Passos MAZ. Evolução da estatura de adolescentes e sua relação com a maturação sexual e indicadores nutricionais: um estudo longitudinal [PhD thesis]. São Paulo (SP): Unifesp; 2014.
11. Mosca LN. O impacto do excesso de gordura corporal sobre a remodelação óssea de adolescentes [PhD thesis]. Botucatu: Universidade Estadual Paulista “Júlio de Mesquita Filho”, 2016.
12. Leonibus CD, Marcovecchio ML, Chiarelli F. Update on statural growth and pubertal development in obese children. Pediatr Rep. 2012;4e35:119-26.
13. Ministério da Saúde. Resolução nº 196. Diretrizes e normas regulamentadoras sobre pesquisas envolvendo seres humanos. Brasília: Conselho Nacional de Saúde; 1996. 14. Jelliffe D. Evoluccion del estado de nutrition de la comunidad.
Genebra: Organizacion mundial de la salud; 1968.
15. World Health Organization [homepage on the Internet]. Growth reference data for 5-19 years. WHO Reference 2007. [cited 2017 April 8]. Available from: http://www.who. int/growthref/en/
16. Frisancho AR. Tríceps skinfold and upper arm muscle size norms for assessment of nutritional status. Am J Clin Nutr. 1974;27:1052-8.
17. Callaway CW. Circumferences. In: Lohmann TG, Roche AF, Martorell R, editors. Anthropometric Standardization Reference Manual. Illinois (USA): Human Kinetics Books; 1988.
18. Harries AD, Jones LA, Heatley RV, Newcombe RG, Rhodes J. Precision of anthropometric measurements: The value of mid-arm circumference. Clin Nutr. 1984;2:193-6. 19. Slaughter MH, Lohman TG, Baileau RA, Horswill CA,
Stillman RJ, Loan MD, et al. Skinfold equations for
estimation of body fatness in children and youth. Hum Biol. 1988;60:709-23.
20. Lohman T, Roche A, Martorell R, editors. Anthropometric standardization reference manual. Illinois (USA): Human Kinetics Books; 1988.
21. Frizon V, Boscaini C. Circunferência do pescoço, fatores de risco para doenças cardiovasculares e consumo alimentar. Rev Bras Cardiol. 2013;9:426-34.
22. Sociedade Brasileira de Cardiologia [homepage on the Internet]. V Diretrizes brasileiras de hipertensão arterial. Arquivos Brasileiros de Cardiologia; 2006 [cited 2012 Apr 23]. Available from: http://publicacoes.cardiol.br/consenso/2006/ VDiretriz-HA.pdf
23. International Diabetes Federation (IDF) [homepage on the Internet]. The IDF consensus definition of the metabolic syndrome in children and adolescents; 2007 [cited 2016 Sep 17]. Available from: https://www.idf.org/e-library/ consensus-statements/61-idf-consensus-definition-ofmet‑ abolic‑syndrome‑in‑children‑and‑adolescents
24. Chipkevitch E. Clinical assessment of sexual maturation in adolescents. J Pediatr (Rio J). 2001;77 Suppl 2:s135-s42. 25. Engeli S, Bohnke J, Feldpausch M, Gorzelniak K, Heintze U,
Janke J, et al. Regulation of 11beta-HSD genes in human
adipose tissue: influence of central obesity and weight loss. Obes Res. 2004;12:9-17.
26. Lordello RA, Mancini MC, Cercato C, Halpern A. Hormonal axes in obesity: cause or effect? Arq Bras Endocrinol Metab. 2007;51:34-41.
27. Masquio DC, Piano A, Campos RM, Sanches PL, Carnier J, Corgosinho FC, et al. The role of multicomponent therapy in the metabolic syndrome, inflammation and cardiovascular risk in obese adolescents. Br J Nutr. 2015;113:1920-30. 28. Mazicioglu MM, Hatiplogu N, Ozturk A, ÇiÇek B, Ustunbas
HB, Kurtoglu S. Waist circumference and mid-upper arm circumference in evaluation of obesity in children aged between 6 and 17 years. J Clin Res Pediatr Endocrinol. 2010;7:144-50.
30. Magalhães EI, Sant`Ana LF, Priore SE, Franceschini SC. Waist circumference, waist/height ratio, and neck circumference as parameters of central obesity assessment in children. Rev Paul Pediatr. 2014;9:273-81.
31. Nawarycz LO, Krzyzaniak A, Stawinska-Witoszynska B, Krzywinska-Wiewiorowska M, Szilagyi-Pagowska I, Kowalska M, et al. Percentile distributions of waist circumference for
7-19-year-old Polish children and adolescents. Obes Rev. 2010;8:281-8.
32. Mederico M, Paoli M, Zerpa Y, Briceño Y, Gómez-Pérez R, Martínez JL, et al. Reference values of waist circumference and waist/hip ratio in children and adolescents of Mérida, Venezuela: Comparison with international references. Endocrinol Nutr. 2013;8:235-42.
33. Knabben EG, Ulbrich AZ, Constantini E, Paulitisky BL, Biesdorf M, Heck TG, et al. Reference value of waist circumference from the 85th percentile of “BMI” of adolescents. Biomotriz. 2014;17:77-93.