Abdominal Obesity and Cardiovascular Risk: Performance of
Anthropometric Indexes in Women
Rogério Tosta de Almeida
1,2, Maura Maria Guimarães de Almeida
1, Tânia Maria Araújo
1Programa de Pós-Graduação em Saúde Coletiva da Universidade Estadual de Feira de Santana, Feira de Santana, BA1, Universidade Estadual do Sudoeste da Bahia, Jequié, BA2 - Brazil
Summary
Background: Anthropometric indicators of abdominal obesity (AOB) estimate the amount of visceral fat tissue which, in turn, is associated with a higher risk of development of cardiovascular diseases. In the past decades, there has been an increase in the frequency of AOB in the brazilian female population, and this represents a major public health problem.
Objective: To evaluate the performance of different cut-off points of the conicity index (C-Index), waist-hip ratio (WHR), waist circumference (WC), and waist-to-height ratio (WHeR) in discriminating high coronary risk (HCR) in women.
Methods: Cross-sectional study conducted in Feira de Santana, State of Bahia, Brazil, with 270 female employees of a public University, with ages between 30 and 69 years. The analysis of sensitivity and specificity using the ROC curves allowed the identification and comparison of the best cut-off points to discriminate HCR, as calculated with base on the Framingham Risk Score.
Results: The cut-off points found were: WC (86 cm), WHR (0.87), C-Index (1.25) and WHeR (0.55), and the areas under the ROC curve were 0.70 (95%CI = 0.63-0.77), 0.74 (95%CI = 0.67-0.81), 0.76 (95%CI = 0.70-0.83) and 0.74 (95%CI = 0.67-0.81), respectively. The anthropometric indicators of AOB analyzed showed satisfactory and similar performances in discriminating HCR. However, the C-Index was the indicator that presented the highest discriminatory power.
Conclusion: We expect that these findings will contribute to a better quantification of AOB in the brazilian female population, providing information so that health professionals can take preventive measures regarding this multifactorial clinical condition, thus preventing the development of cardiovascular diseases. (Arq Bras Cardiol 2009;92(5):345-350)
Key words: Obesity; anthropometry; abdominal circumference; risk factors; women.
Mailing address: Rogério Tosta de Almeida •
Avenida Universitária, s/n, Campus Universitário - 44031-460 - Bairro Novo Horizonte, Feira de Santana, BA - Brazil
E-mail: [email protected]
Manuscript received May 02, 2008; revised manuscript received June 24, 2008; accepted June 24, 2008.
pattern) in women has increased due to changes related to eating habits and lifestyle that occurred in the past decades, indicating an increasingly greater exposure to cardiovascular risks. Recent studies have pointed out the increase in the frequency of abdominal obesity (AOB) in the brazilian female population5-7.
Computed tomography, magnetic resonance imaging and ultrasonography are sophisticated laboratory methods generally used for the measurement of visceral adiposity8,9. However, due to equipment costs, sophistication of the methods, and difficulties in involving the individuals assessed in measurement protocols, the use of these methods for the purpose of epidemiological studies becomes frequently unfeasible. Anthropometric methods are relatively simple, non-invasive and inexpensive, not requiring a high degree of technical ability and training, thus representing an alternative frequently used in population studies on obesity and fat distribution.
Anthropometric indicators of AOB can provide estimates of the amount of visceral adipose tissue which, in turn, is associated with metabolic changes, particularly hyperinsulinemia, glucose
Introduction
Excessive fat concentration in the abdominal region is related to several metabolic dysfunctions and is associated with a higher risk of morbidity and mortality resulting from the atherosclerotic disease and its consequences, such as coronary artery disease1,2.
Cardiovascular diseases (CVD) are the major cause of morbidity and mortality in Brazil. In 2005, 283,927 deaths from CVD occurred, corresponding to 28.2% of the overall mortality in the country3. Thus, the knowledge of the magnitude of the cardiovascular risk factors is fundamental to support a health planning able to efficiently change this reality4.
intolerance and hypertrygliceridemia10,11.
Few Brazilian studies aiming at the determination of cut-off points of anthropometric indexes for the estimate of AOB in women are available in the literature, especially regarding the conicity index (C-Index) and waist-to-height ratio (WHeR). Thus, the objective of this study was to evaluate the performance of different cut-off points of C-index, waist-hip ratio (WHR), waist circumference (WC), and waist-to-height ratio (WHeR) in discriminating a high coronary risk (HCR) in women.
Methods
This is a cross-sectional study conducted in Feira de Santana, State of Bahia, Brazil. Data from the “Risk factors for coronary artery disease in employees of a higher education institution” study12 of the Epidemiology Core (Núcleo de Epidemiologia - NEPI) of the Postgraduate Program in Collective Health of the Department of Health of Feira de Santana State University (UEFS) were used. The population of the original study comprising 554 women was selected by means of a census among technical-managerial employees and service providers of UEFS who were working during the period of data collection (July 26 to October 15, 2004) and were neither pregnant nor breast feeding. Data from 475 women (85.7%) were collected. The reasons for not participating were: 6.0% (33) could not be found, 6.1% (34) did not agree to participate in the study, 1.8% (10) were on medical leave, and 0.4% (2) died of coronary artery disease (CAD) during data collection12.
Since the Framingham Risk Score (FRS), which was the coronary risk indicator used in the present study, was constructed based on a population with ages ranging from 30 to 74 years13, we used data from participants with ages equal to or higher than 30 years who underwent all measurement protocol necessary for FRS calculation, in a total of 270 women
(74.2% of the 364 women with ages ≥ 30 years).
A procedures manual was elaborated to guide data collection, which was performed by a previously trained team.
The following variables were included in the present study: • sociodemographic variables - age (in full years), educational attainment (elementary school, high school, or higher), monthly family income (categorized in 1 to 2, 3 to 6, and > 6 minimum wages), marital status (married/stable relationship or unmarried), and skin color self-declared as white, brown, black, yellow or red, and dichotomized in black (black and brown) and non-black (other).
• in relation to cigarette smoking, the participants were divided into non-smokers, smokers (those who smoked two or more cigarettes/day for at least two months), and ex-smokers (those who had smoked cigarettes in the past, but were not smoking any longer for at least 12 consecutive months).
• anthropometry - weight, height, waist circumference and hip circumference measurements were taken in the anthropometric assessment room at the institutional Health Service. Two measurements were taken by two team members, and the arithmetic mean was used as the final measurement.
scale was used for weight measurement; a vertical wooden stadiometer was used for height measurement; a non-stretchable 0.5-cm-wide tape measure was used for waist and hip circumference measurements. Measurements were taken with the patients dressing as few clothes as possible, usually only underwear - panties and bra, or swimming suits. The anatomic reference point for waist circumference measurement was the narrowest part between the thorax and the hip. For hip measurement, the most prominent point (gluteus maximus) was considered. Readings were made to the closest centimeter.
• WHR was determined by dividing waist circumference (cm) by hip circumference (cm). C-Index, as proposed by Valdez14, was calculated using the following mathematical equation:
WHeR was determined by dividing WC (cm) by height (cm).
• Laboratory tests - Blood samples for total cholesterol, HDL-C, LDL-C, and blood glucose tests were collected after an equal to or higher than 12-hour fasting and the determinations were performed in the Clinical Laboratory and mobile units working in the Infrastructure Unit and in the Health Service of UEFS. The samples were analyzed in the Clinical Laboratory of the Biology Core of UEFS.
Systolic (SBP) and diastolic blood pressure (DBP) were measured using an OMROM model HEM 705 CP manometer, according to recommendations of the IV Brazilian Guidelines of Hypertension15. The mean of two readings was recorded.
For construction of the coronary risk indicator, we used the FRS, a model proposed by Wilson et al13, based on the Framingham Heart Study, a cohort study with a 12-year follow-up of 2,856 women and 2,489 men with ages between 30 and 74 years. The score, which can be positive (risk factor) or negative (protection factor), for the calculation of the estimate of coronary risk proposed by these authors using the Cox regression model includes age, SBP, DBP, total cholesterol, HDL-C, cigarette smoking and diabetes. After determination of the score for each variable, the scores were added up. Dichotomization of the sample into “high” or “non-high coronary risk” was made using the 80th percentile as the cut-off point, that is, for the identification of a high coronary risk, a score higher than that found for 80% of the sample participants was considered, the value corresponding to the 80th percentile was 8 points.
Data were doubly entered and analyzed, using the SPSS version 10.0 and STATA version 9.0 statistical programs.
epidemiological studies16-18. The statistical significance of each analysis was observed using the area under the ROC curve and the 95% confidence interval. Sensitivity and specificity values not lower than 60% and area under the ROC curve not lower than 50% were criteria used for the selection of the cut-off points.
The project was submitted to the Research Ethics Committee of UEFS for analysis, approval and follow-up, and was approved under protocol no. 117/2007. A written informed consent was obtained from all participants.
The present study was not supported by external financing sources.
Results
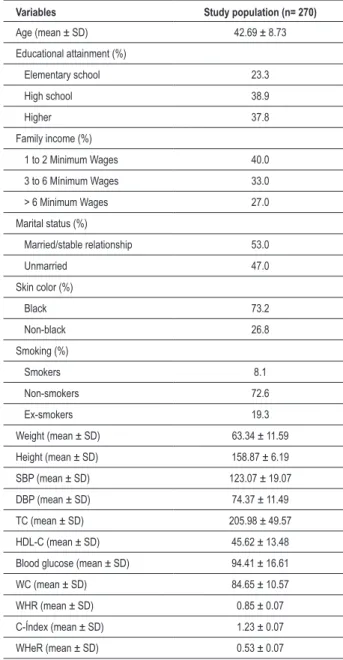
The characteristics of the study population are shown in Table 1. Higher frequencies of black (73.2%), married or with a stable relationship (53.0%) and non-smoker (72.6%) women were observed. We point out the low frequency of smokers (8.1%).
Table 2 shows the cut-off points and sensitivity and specificity values of the anthropometric indexes analyzed. All indexes showed sensitivities and specificities values close to each other and above 60%.
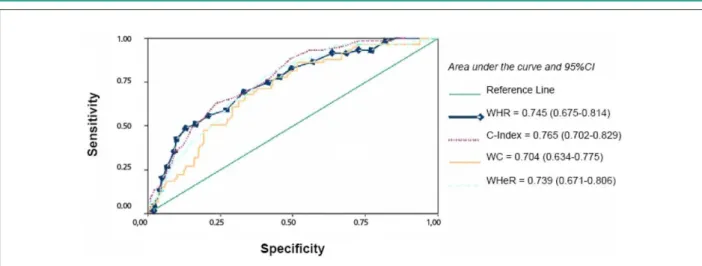
The analysis of the areas under the ROC curves showed that all indexes analyzed had a satisfactory discriminatory power to discriminate HCR (Figure 1). However, the C-Index was the index with the best performance to discriminate HCR in comparison with the others. The comparison of the areas under the ROC curves with each other showed a statistically significant difference (p=0.01) (Table 3).
Discussion
As expected, the WC cut-off point to discriminate HCR suggested by this study is different from those recommended for the Asian (values below 80cm)17,19-22 and Canadian (80cm)16 populations, and similar to those found in Mexico (85cm)23 and in Brazil by Barbosa et al (84cm)24 and by Pitanga & Lessa (83cm)18.
Despite the lack of consensus between the studies analyzed on the best WC cut-off point to identify abdominal obesity, we can observe that, except for the studies conducted in Asian populations (China, Singapore, Taiwan and Japan), the values suggested ranged from 80 and 88cm, which are very close to that found in this study (86cm).
Regarding WHR, some studies have suggested the value of 0.80 as the cut-off point to estimate AOB in women16,17,19,21,25,26. However, among the studies conducted in Brazil, the values found were 0.83 for adult women with age between 30 and 74 years18, 0.84 for women from 30 to 49 years of age, and 0.88 for those older than 50 years27. The cut-off point found in Mexico (0.85)23 was also closer to ours (0.87).
We should point out that the analysis strategies used by some authors16,17,19-21,23 were very similar, that is, each CVD risk factor was analyzed alone or in group using different
Table 1 - Characteristics of the study population
Variables Study population (n= 270)
Age (mean ± SD) 42.69 ± 8.73
Educational attainment (%)
Elementary school 23.3
High school 38.9
Higher 37.8
Family income (%)
1 to 2 Minimum Wages 40.0
3 to 6 Mínimum Wages 33.0
> 6 Minimum Wages 27.0
Marital status (%)
Married/stable relationship 53.0
Unmarried 47.0
Skin color (%)
Black 73.2
Non-black 26.8
Smoking (%)
Smokers 8.1
Non-smokers 72.6
Ex-smokers 19.3
Weight (mean ± SD) 63.34 ± 11.59
Height (mean ± SD) 158.87 ± 6.19
SBP (mean ± SD) 123.07 ± 19.07
DBP (mean ± SD) 74.37 ± 11.49
TC (mean ± SD) 205.98 ± 49.57
HDL-C (mean ± SD) 45.62 ± 13.48
Blood glucose (mean ± SD) 94.41 ± 16.61
WC (mean ± SD) 84.65 ± 10.57
WHR (mean ± SD) 0.85 ± 0.07
C-Índex (mean ± SD) 1.23 ± 0.07
WHeR (mean ± SD) 0.53 ± 0.07
Table 2 - Cut-off points, sensitivity and speciicity of WC, WHR, C-Index and WHeR to discriminate HCR in women. Feira de Santana,
BA, Brazil, 2004
Anthropometric
indexes Cut-off point Sensitivity Speciicity
WC 86 69.5% 63.5%
WHR 0.87 69.5% 66.8%
C-Index 1.25 71.2% 64.0%
WHeR 0.55 67.8% 65.9%
WC - waist circumference; WHR - waist/hip ratio; C-Index - conicity index; WHeR
Table 3 - Comparison between the areas under the ROC curves of anthropometric indicators of abdominal obesity in women. Feira de Santana, BA, Brazil, 2004
Anthropometric Indexes
Area under
the curve 95%CI p value
WC 0.704 0.634 - 0.775
WHeR 0.739 0.671 - 0.806
WHR 0.745 0.675 - 0.814
C-Index 0.765 0.702 - 0.829 0.01
WC - waist circumference; WHR - waist/hip ratio; C-Index - conicity index; WHeR
- waist-to-height ratio.
anthropometric indicators of obesity. In the present study, we chose to analyze the global cardiovascular risk using the FRS, which was the same strategy used by Pitanga & Lessa18,27.
Few studies determining the best cut-off point for the C-Index18,27 and WHeR19-21,23,28 to estimate abdominal obesity in women were found in the literature.
Unlike the result found in the present study (1.25), Pitanga & Lessa18 suggested 1.18 as the best cut-off point for the C-Index, with values of sensitivity of 73.39%, specificity of 61.15%, and area under the ROC curve of 0.75 (95%CI = 0.70-0.80). In another study27, Pitanga & Lessa found different cut-off points, depending on the age range analyzed. For women between 30 and 49 years, the best cut-off point was the same (1.18) with better sensitivity (78.57%) and specificity (65.24%) and also better area under the ROC curve (0.81; 95%CI = 0.70-0.92). Among older women (50 to 74 years), the best cut-off point suggested was 1.22, with sensitivity of 60.00%, specificity of 65.82% and area under the ROC curve of 0.65 (95%CI = 0.58-0.73). Therefore, C-Index had the highest discriminatory power of HCR for younger women.
In relation to WHeR, lower values than those found in the present study were proposed in China19 (0.50), Taiwan20 (0.45) and Singapore21 (0.48). In a recent study conducted in Brazil,
WHeR, with sensitivity of 67%, specificity of 58% and area under the ROC curve of 0.69 (95%CI = 0.64-0.75). This cut-off point was similar to that found for Mexican women, which ranged from 0.53 to 0.535 for WHeR to discriminate type-2 diabetes, hypertension and dyslipidemias23.
Criteria to define abnormal values, as well as the performance of each anthropometric index used to identify abdominal obesity have been divergent in the literature. Different ethnical components and anthropometric characteristics of each population could justify the differences found. We point out that the choice of the criterion to define cut-off points in the continuum between normal and abnormal can vary according to the nature of what is being studied and to previous knowledge on the treatments and preventive measures available. In this study, we sought the best balance between sensitivity and specificity, always prioritizing sensitivity, given that the consequences of AOB have a high individual and social burden; therefore the early diagnosis may expedite measures regarding nutritional surveillance and engagement in regular physical activities.
Recently, it was observed that age modified the discriminatory power of anthropometric indicators of obesity in identifying HCR in women27. Since age is an important risk factor for the development of CVD13,29,30, the discrimination of cut-off points by age ranges in order to identify the cardiovascular risk may be a good alternative for further investigation.
The anthropometric indicators of AOB analyzed had a similar performance in discriminating HCR.
Epidemiological data show that WHR and WC are independent predictors for several metabolic disorders. However, it is recommended that these measurements be used in combination with BMI to increase their ability to predict cardiovascular complications1,31,32.
According to Velásquez-Meléndez et al29, short stature resulting from a nutritional deficit during childhood due to poverty may be associated with the development of AOB, especially in women. If these authors’ hypothesis were confirmed, C-Index and WHeR would be the most adequate
height is included in the calculation of both.
Although WC and WHR have the advantage of being simple and low-cost measurements requiring only a tape measure, which makes them easy to be used for the diagnosis of AOB in population studies or interventions, they have the disadvantage of not considering height and weight changes.
Height, but not body weight, is considered for WHeR calculation.
C-Index seems to be a good indicator of fat distribution, especially in women, by detecting changes in body composition, and thus permitting comparisons between subjects who present different body weight and height measurements. However, it requires a scale and an anthropometer, and for this reason its use can sometimes be unfeasible.
Since many different anthropometric indexes are available to estimate obesity, the choice of one of them is based on criteria considering factors such as the population studied, gender, age and, mainly, the evidences based on population researches or clinical interventions. In addition, of course, to the availability and feasibility of instruments to take the measurements required.
In view of our findings, we conclude that all anthropometric indexes analyzed had a satisfactory performance in discriminating HCR in women, and, considering the area under the ROC curve, the C-Index was the parameter with the highest discriminatory power, followed by WHR, WHeR,
and WC. Statistically significant differences were observed when the areas under the ROC curves were compared with each other (p=0.01). We expect that these findings will contribute to explain the AOB phenomenon in the brazilian female population by providing information, so that health professionals can take preventive measures regarding this multifactorial clinical condition, thus preventing the development of cardiovascular diseases.
Acknowledgements
We thank Diva Eleonora R. Lima for providing the data, and Prof. Dr. Nelson Oliveira for the support with statistical data.
Potential Conflict of Interest
No potential conflict of interest relevant to this article was reported.
Sources of Funding
There were no external funding sources for this study.
Study Association
This article is part of the Dissertation of Master submitted by Rogério Tosta de Almeida, from Universidade Estadual de Feira de Santana (UEFS).
References
1. Silva JLT, Barbosa DS, Oliveira JA, Guedes DP. Distribuição centrípeta da gordura corporal, sobrepeso e aptidão cardiorrespiratória: associação com sensibilidade insulínica e alterações metabólicas. Arq Bras Endocrinol Metab. 2006; 50 (6): 1034-40.
2. Sociedade Brasileira de Cardiologia. IV Diretriz Brasileira sobre Dislipidemias e Prevenção da Aterosclerose: Departamento de Aterosclerose da Sociedade Brasileira de Cardiologia. Arq Bras Cardiol. 2007; 88 (supl): S2-19.
3. Brasil. Ministério da Saúde [homepage na internet]. Datasus. Informações de saúde. Estatísticas Vitais - Mortalidade e Nascidos Vivos de 2005. [citado 2007 jul 14]. Disponível: http://w3.datasus.gov.br/datasus/datasus.php
4. Jardim PCBV, Gondim MRP, Monego ET, Moreira HG, Vitorino PVO, Souza WKSB, et al. Hipertensão arterial e alguns fatores de risco em uma capital brasileira. Arq Bras Cardiol. 2007; 88 (4): 452-7.
5. Castanheira M, Olinto MTA, Gigante DP. Associação de variáveis sociodemográficas e comportamentais com a gordura abdominal em adultos: estudo de base populacional no Sul do Brasil. Cad Saúde Pública. 2003; 19 (supl.1): 55-65.
6. Martins IS, Marinho SP. O potencial diagnóstico dos indicadores da obesidade centralizada. Rev Saúde Publ. 2003; 37 (6): 760-7.
7. Olinto MTA, Nacul LC, Dias-da-Costa JS, Gigante DP, Menezes AMB, Macedo S. Níveis de intervenção para obesidade abdominal: prevalência e fatores associados. Cad Saúde Pública. 2006; 22 (6): 1207-15.
8. Radominski RB, Vezozzo DP, Cerri GG, Halpern A. O uso da ultra-sonografia na avaliação da distribuição de gordura abdominal. Arq Bras Endocrinol Metab. 2000; 44 (1): 5-12.
9. Leite CC, Matsuda D, Wajchenberg BL, Cerri GG, Halpern A. Correlação da medida de espessura intra-abdominal medida pela ultra-sonografia
com os fatores de risco cardiovascular. Arq Bras Endocrinol Metab. 2000; 44 (1): 49-56.
10. Hermsdorff HHM, Monteiro JBR. Gordura visceral, subcutânea ou intramuscular: onde está o problema?. Arq Bras Endocrinol Metab. 2004; 48 (6): 803-11.
11. Silva JLT, Guedes DP, Barbosa DS, Oliveira JA, Guedes JERP. Obesidade centrípeta e disfunções metabólicas: patogenia, mensuração e papel profilático do exercício físico. Semina: Ciências Biológicas e da Saúde. 2002; 23: 49-66.
12. Lima DER. Fatores de risco para doença arterial coronariana em funcionárias de uma instituição de ensino superior [Dissertação]. Feira de Santana (BA): Universidade Estadual de Feira de Santana; 2004.
13. Wilson PWF, D’Agostino RB, Levy D, Belanger AM, Silbershatz H, Kannel WB. Prediction of coronary heart disease using risk factor categories. Circulation. 1998; 97: 1837-47.
14. Valdez, R. A simple model-based index of abdominal adiposity. J Clin Epidemiol. 1991; 44 (9): 955-6.
15. Sociedade Brasileira de Hipertensão Arterial, Sociedade Brasileira de Cardiologia, Sociedade Brasileira de Nefrologia. IV Diretrizes brasileiras de hipertensão arterial. Arq Bras Cardiol. 2004; 82 (supl.4): 7-14.
16. Dobbelsteyn CJ, Joffres MR, MacLean DR, Flowerdew G. A comparative evaluation of waist circumference, waist-to-hip ratio and body mass index as indicators of cardiovascular risk factors. The Canadian Heart Health Surveys. Int J Obes. 2001; 25 (5): 652-61.
18. Pitanga FJG, Lessa I. Indicadores antropométricos de obesidade como instrumento de triagem para risco coronariano elevado em adultos na cidade de Salvador (Bahia). Arq Bras Cardiol. 2005; 85 (1): 26-31.
19. Ko GTC, Chan JCN, Cockram CS, Woo J. Prediction of hypertension, diabetes, dyslipidaemia or albuminuria using simple anthropometric indexes in Hong Kong Chinese. Int J Obes. 1999; 23 (11): 1136-42.
20. Lin WY, Lee LT, Chen CY, Lo H, Hsia HH, Liu IL, et al. Optimal cut-off values for obesity: using simple anthropometric indices to predict cardiovascular risk factors in Taiwan. Int J Obes Relat Metab Disord. 2002; 26 (9): 1232-8.
21. Pua YH, Ong PH. Anthropometric indices as screening tools for cardiovascular risk factors in Singaporean women. Asia Pac J Clin Nutr. 2005; 14 (1): 74-9.
22. Hara K, Matsushita Y, Horikoshi M, Yoshiike N, Yokoyama T, Tanaka H, et al. A proposal for the cutoff point of waist circumference for the diagnosis of metabolic syndrome in the japanese population. Diabetes Care. 2006; 29 (5): 1123-4.
23. Berber A, Gómez-Santos R, Fanghänel G, Sánchez-Reyes L. Anthropometric indexes in the prediction of type 2 diabetes mellitus, hypertension and dyslipidaemia in a Mexican population. Int J Obes. 2001; 25 (12): 1794-9.
24. Barbosa PJB, Lessa I, Almeida Filho N, Magalhães LBNC, Araújo J. Critério de obesidade central em população brasileira: impacto sobre a síndrome metabólica. Arq Bras Cardiol. 2006; 87 (4): 407-14.
25. Lean ME, Han TS, Morrison CE. Waist circumference as a measure for indicating need for weight management. BMJ. 1995; 311: 158-61.
26. Han TS, Van Leer EM, Seidell JC, Lean MEJ. Waist circumference action levels in the identification of cardiovascular risk factors: prevalence study in a random simple. BMJ. 1995; 311: 1401-5.
27. Pitanga FJG, Lessa I. Indicadores antropométricos de obesidade como dicriminadores de risco coronariano elevado em mulheres. Rev bras cineantropom desempenho hum. 2006; 8 (1): 14-21.
28. Pitanga FJG, Lessa I. Razão cintura-estatura como discriminador do risco coronariano de adultos. Rev Assoc Med Bras. 2006; 52 (3): 157-61.
29. Velásquez-Meléndez G, Martins IS, Cervato AM, Fornés NS, Marucci MFN, Coelho LT. Relationship between stature, overweight and central obesity in the adult population in São Paulo, Brazil. Int J Obes. 1999; 23: 639-44.
30. Pimenta L. Doenças cardiovasculares na mulher: fatos e mitos. Rev SOCERJ. 2001; 14 (4): 287-92.
31. Pereira RA, Sichieri R, Marins VMR. Razão cintura/quadril como preditor de hipertensão arterial. Cad Saúde Pública. 1999; 15 (2): 333-44.