Universidade de Lisboa
Faculdade de Ciˆencias
Departamento de Inform´
atica
Cell biology informatics
Two bioinformatic tools for the study of evolutionary cell
biology
por
Filipe Bernardes da Silva Tavares Cadete
Mestrado em Tecnologias de Informa¸c˜
ao aplicadas `
as
Ciˆencias Biol´
ogicas e M´edicas
Universidade de Lisboa
Faculdade de Ciˆencias
Departamento de Inform´
atica
Cell biology informatics
Two bioinformatic tools for the study of evolutionary cell
biology
projecto realizado no
Instituto Gulbenkian de Ciˆ
encia
por
Filipe Bernardes da Silva Tavares Cadete
Projecto orientado pelo Prof. Dr. Andr´e Os´orio e Cruz de Azerˆedo Falc˜ao e co-orientado pelo Dr. Jos´e B´artholo Pereira Leal
Mestrado em Tecnologias de Informa¸c˜
ao aplicadas `
as
Ciˆencias Biol´
ogicas e M´edicas
Resumo
A capacidade de processar e relacionar vastas quantidades e v´arios tipos de dados ´e uma das vantagens que as tecnologias de informa¸c˜ao e comunica¸c˜ao (TIC) trazem `
a biologia. Esta capacidade torna-se ainda mais importante quando est´a em causa o estudo da evolu¸c˜ao de sistemas intra-celulares complexos, j´a que este s´o se torna poss´ıvel ao contextualizar correctamente informa¸c˜ao de diversos tipos (molecular, morfol´ogica e taxon´omica, por exemplo). Neste projecto aplicaram-se TIC na con-stru¸c˜ao de recursos que possibilitam o estudo da evolu¸c˜ao de duas caracter´ısticas de Eucariotas: o sistema de transporte vesicular e centr´ıolos.
No ambiente compartimentalizado que ´e uma c´elula eucariota, o sistema de trans-porte vesicular permite a movimenta¸c˜ao de diferentes cargas de um compartimento para outro, incluindo do interior para o exterior da c´elula e vice-versa. Este sistema est´a presente, de forma mais ou menos complexa, em todos os eucariotas, pelo que se assume que tamb´em esteve presente no ´ultimo ancestral que estes tˆem em comum. Desde ent˜ao adaptou-se aos diferentes estilos de vida e necessidades do eucariotas actuais.
Para o estudo da evolu¸c˜ao do sistema de transporte vesicular ´e necess´ario con-hecer os perfis filogen´eticos dos seus componentes, isto ´e, ´e necess´ario saber em que organismos estes componentes est˜ao presentes ou ausentes. As prote´ınas do tipo rab s˜ao reguladores centrais deste sistema. O objectivo deste trabalho ´e a identifica¸c˜ao e classifica¸c˜ao desta fam´ılia de prote´ınas num vasto n´umero de organismos que cubram, na medida do poss´ıvel, a diversidade existente em Eucariotas e a disponibiliza¸c˜ao destes resultados para a comunidade.
Para cumprir este objectivo, foram utilizadas t´ecnicas de aprendizagem au-tom´atica e de manipula¸c˜ao de sequˆencias para construir uma ferramenta de anota¸c˜ao autom´atica de rabs. Esta ferramenta, apelidada de Rabifier, actua da seguinte forma:
• selec¸c˜ao de sequˆencias candidatas atrav´es da sua semelhan¸ca com um conjunto discriminante de prote´ınas rab e n˜ao-rab. A semelhan¸ca ´e medida recorrendo ´
a ferramenta de alinhamento local BLAST;
• confirma¸c˜ao das sequˆencias candidatas atrav´es da utiliza¸c˜ao da ferramenta de detec¸c˜ao de motivos lineares MEME/MAST para identificar motivos es-pec´ıficos das rabs;
• utiliza¸c˜ao de clustering para determinar se novas subfam´ılias devem ser cri-adas;
• classifica¸c˜ao de sequˆencias candidatas numa subfam´ılia atrav´es de modelos rep-resentativos de conjuntos de sequˆencias utilizando as ferramentas Psi-BLAST e RPS-BLAST;
• marca¸c˜ao autom´atica dos resultados obtidos como sendo de confian¸ca ou n˜ao.
Seguiu-se uma verifica¸c˜ao manual das sequˆencias marcadas como n˜ao sendo de confian¸ca. No final, de um total de 3058867 sequˆencias de 182 organismos, foram identificadas mais de cinco mil sequˆencias em 182 organismos. O conjunto destes dados permitiu uma an´alise preliminar de caracter´ısticas particulares de prote´ınas rabs e a predi¸c˜ao do conjunto de rabs do ancestral comum dos eucariotas.
Os resultados obtidos foram disponibilizados no website TrafficDB
(http://www.igc.pt/trafficdb). Este foi desenvolvido utilizando um back-end escrito em Python com base na web framework Django.
A presen¸ca de citoesqueleto ´e outra caracter´ıstica que distingue eucariotas de procariotas. O citoesqueleto ´e composto por filamentos de actina, filamentos in-term´edios e microt´ubulos. Estes ´ultimos podem criar estruturas do tipo centriolar que s˜ao respons´aveis por processos essenciais ao bom funcionamento da c´elula. Por exemplo, o centrosoma actua na segrega¸c˜ao de cromossomas durante a divis˜ao celu-lar e tem no seu ˆamago um par de centr´ıolos. Outras estruturas deste tipo incluem flagelos e c´ılios, que nucleiam protus˜oes da membrana celular e permitem `a c´elula mover-se ou sentir o ambiente envolvente.
Estruturas centriolares aparecem em todos os principais grupos de eucariotas. Assim, como o sistema de transporte vesicular, postula-se que tenham origem num ancestral comum a todos os eucariotas. Mais uma vez, o estudo da evolu¸c˜ao de uma estrutura ancestral poder´a conduzir a uma melhor compreens˜ao dos sistemas biol´ogicos actuais. H´a descri¸c˜oes de varia¸c˜oes do esquema de organiza¸c˜ao destas estruturas, mas esta variabilidade, essencial para um estudo aprofundado da sua evolu¸c˜ao, n˜ao se encontra catalogado nem centralizado.
O objectivo deste trabalho ´e a cria¸c˜ao de uma interface web, chamada Centri-oleDB, para a anota¸c˜ao de imagens de microscopia electr´onica de estruturas cen-triolares. Esta anota¸c˜ao ´e feita manualmente utilizando um dicion´ario controlado desenvolvido por especialistas no estudo destas estruturas.
Para al´em de possibilitar a anota¸c˜ao de imagens, a CentrioleDB tamb´em permite a visualiza¸c˜ao de imagens j´a anotadas num contexto taxon´omico e molecular. Um utilizador pode rapidamente descobrir em que organismos ´e que uma determinada estrutura aparece, que prote´ınas foram experimentalmente mapeadas nessa estrutura e quais os seus ort´ologos. Esta ´e a primeira fase de um projecto de colabora¸c˜ao
com grupos ligados `a comunidade centriolar. `A medida que os dados de anota¸c˜ao ficam mais completos, poderemos comparar perfis de estruturas e mol´eculas e fazer previs˜oes sobre que mol´eculas tˆem fun¸c˜oes relacionadas com estas estruturas.
A implementa¸c˜ao da CentrioleDB foi feita utilizando uma base de dados rela-cional e a web framework Django. Foi necess´ario desenvolver:
• uma estrutura de base de dados que aceite facilmente mudan¸cas e acrescen-tos ao dicion´ario controlado de anota¸c˜ao, uma vez que este encontra-se em permanente desenvolvimento e actualiza¸c˜ao por peritos na ´area.
• um backend que lida com o upload de ficheiros de imagens e mant´em a liga¸c˜ao entre estas e as respectivas anota¸c˜oes.
• uma interface que permita a anota¸c˜ao e a visualiza¸c˜ao de informa¸c˜ao de uma forma intuitiva para o utilizador.
Neste momento a CentrioleDB encontra-se em funcionamento em
http://www.igc.pt/centrioledb e dispon´ıvel a um grupo restrito de utilizadores por raz˜oes de copyright.
As duas ferramentas aqui descritas tˆem em comum o facto de propiciarem `as respectivas comunidades um local dedicado ao estudo da evolu¸c˜ao dos respectivos sistemas. A integra¸c˜ao de informa¸c˜ao relevante com taxonomia contextualiaza-a de uma forma que facilita uma vis˜ao global e abrangente da evolu¸c˜ao destes sistemas essenciais a todos os eucariotas.
PALAVRAS-CHAVE:
Evolu¸c˜ao em eucariotas; anota¸c˜ao autom´atica de prote´ınas; prote´ınas rab; manipula¸c˜ao de sequˆencias; anota¸c˜ao manual de imagens; centr´ıolos; desenvolvimento de interfaces web de bases de dados.
Abstract
The ability to associate and process a vast amount and various types of data is an advantage that information and communication technologies bring to biology. However, most bioinformatics either focus solely on evolution, and we call it phylo-genetics, or ignores the evolutionary history of its object of study. In this project these technologies were used to build resources to facilitate the study of the evolu-tion of two Eukaryote defining characteristics, the vesicular trafficking system and centrioles, by integrating familiar or hitherto unexplored types of data (sequences and electron microscopy images, respectively) with taxonomic information so as to give the data a context from which evolutionary studies of complex systems can be achieved.
To study the evolution of the vesicular trafficking system it’s necessary to know the phylogenetic profiles of it’s components, which is to say the organisms in which the components are present or absent. Rab proteins are central regulators of this system. One of the objectives of this work is the identification and classification of this protein family in a vast number of organisms that cover, as far as possible, the diversity in Eukaryotes and to make these results available to community. To this end, machine learning and sequence manipulation techniques were used, leading to the identification of more than five thousand sequences in 182 species. The identified sequences are available on the TrafficDB website (http://www.igc.pt/trafficdb).
The work developed to facilitate the study of centrioles consisted mainly on the development of an online interface for the annotation and storage of electron mi-croscopy images and of a controlled vocabulary to facilitate this annotation. This interface, CentrioleDB, has the final objective of cataloguing the different morpholo-gies that centriolar structures can have. It was implemented using a relational database and the Django web framework. At this moment it is functioning at http://www.igc.pt/centrioledb and available to a restricted set of users due to copy-right reasons.
The two works developed here use different techniques to obtain their data. The one dealing with rab proteins is based on automatic sequence annotation while the one dealing with centrioles is based on tools for the manual annotation on images. Where they cross is in their final purpose, the study of evolution of complex systems, and in the way the data is presented to the public, always with an eye on evolution, using taxonomy as its proxy.
KEYWORDS:
Evolution in eukaryotes; automatic annotation of proteins; rab proteins; sequence manipulation; manual annotation of images; centrioles; development of web interfaces for databases.
Acknowledgements
This work and the time during which it was done wouldn’t have been the same without the participation, input and friendship of other people. For that reason, I wish to thank:
my thesis co-advisor, Dr. Jos´e B´artholo Pereira-Leal, for his guidance during the entire project and for creating a very positive work environment at the Com-putational Genomics Laboratory;
Dr. Andr´e Os´orio e Cruz de Azerˆedo Falc˜ao, for his role as thesis advisor;
my colleagues at the Computational Genomics Laboratory, who make it a very pleasant place to work, with special thanks to Paulo Almeida and Renato Alves for making sure everything runs smoothly;
Dr. M´onica Bettencourt-Dias and the Cell Cycle Regulation Laboratory for their enthusiasm and knowledge about CentrioleDB and for their company at the institute;
Joana Pinto and Neuza Matias for their patience and for painstakingly pointing out the bugs in the image annotation interface;
the Gulbenkian Institute for Science for providing the conditions necessary for this work and Funda¸c˜ao para a Ciˆencia e Tecnologia (FCT) and Fam´ılia Tavares Cadete (FTC) for funding;
my colleagues and friends, past and present, at the Faculty of Sciences of the University of Lisbon for their company, help and friendship during the past five years;
Barbara Vreede, for her friendship and copious amounts of stimulating caffeine and conversation, but not for introducing me to SET;
my parents and siblings, for their continuous support and love.
Contents
List of Figures xv
List of Tables xvii
1 Introduction 1
1.1 Bioinformatics in cell biology . . . 1
1.2 Protein trafficking pathways . . . 1
1.2.1 Biological details . . . 2
1.2.2 Objectives and techniques used . . . 3
1.3 Microtubule-derived organelles . . . 4
1.3.1 Biological details . . . 4
1.3.2 Objectives and techniques used . . . 5
1.4 Thesis structure . . . 5
2 Rab proteins 7 2.1 The problem: how to classify? . . . 7
2.2 The rab protein sequence and subfamilies . . . 8
2.2.1 As a whole . . . 8
2.2.2 Characteristic motifs . . . 8
2.2.3 What we don’t know . . . 9
2.2.4 Goal . . . 9
2.3 The Rabifier . . . 9
2.3.1 Building a reference set . . . 10
2.3.2 Finding putative sequences . . . 10
2.3.3 Confirming these putative sequences . . . 12
2.3.4 Creating new subfamilies . . . 13
2.3.5 Description . . . 13
2.3.6 Assigning sequence to a family . . . 14
2.4 Confirming the results of the Rabifier . . . 15
2.4.1 Subfamily alignments . . . 15
2.4.2 Automatic Hyp family assignment . . . 16
2.4.3 Unclassified sequence assignment . . . 17
2.5 Result analysis from rab protein classification . . . 18
2.5.1 Ancestral rab subfamilies . . . 18
2.5.2 Consensus sequences and motif conservation . . . 21
2.5.3 Rab functional group expansions . . . 22
2.5.4 Origin of taxon-specific rabs . . . 23
2.6 TrafficDB . . . 26 2.6.1 Database schema . . . 26 2.6.2 Website implementation . . . 26 2.7 Future of Rabifier . . . 27 3 CentrioleDB 29 3.1 Purpose . . . 29 3.2 Database schema . . . 30
3.2.1 Image and protein annotation . . . 30
3.2.2 Taxonomic information . . . 32
3.3 Development of the controlled vocabulary . . . 32
3.4 Website implementation . . . 34
3.4.1 From user to database . . . 34
3.4.2 Interaction scenarios . . . 35
3.5 Current status . . . 41
4 Conclusions 43
Bibliography 49
List of Figures
2.1 Representation of the rab3 tridimensional structure from Pereira-Leal and Seabra, 2000 [26]. RabF motifs are depicted in red, RabSF re-gions in yellow, and the conserved nucleotide binding motifs in green. The alpha-helixes and beta-sheets were the conserved regions and motifs are inserted are also identified. . . 8 2.2 Flowchart describing identification of putative rab sequence. . . 11 2.3 A) Flowchart of the F motif-based sequence confirmation; B) ROC
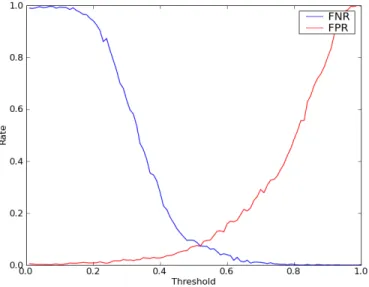
curve for the validation of this approach. Each dot represents the av-erage of a cross-validation. The different colours indicate the thresh-old level used. As can be seen, a perfect true positive rate is achieved with two motifs detected as the threshold. . . 12 2.4 Flowchart of the method used to create new subfamilies. . . 13 2.5 False positive and negative rates for correct sequence flagging plotted
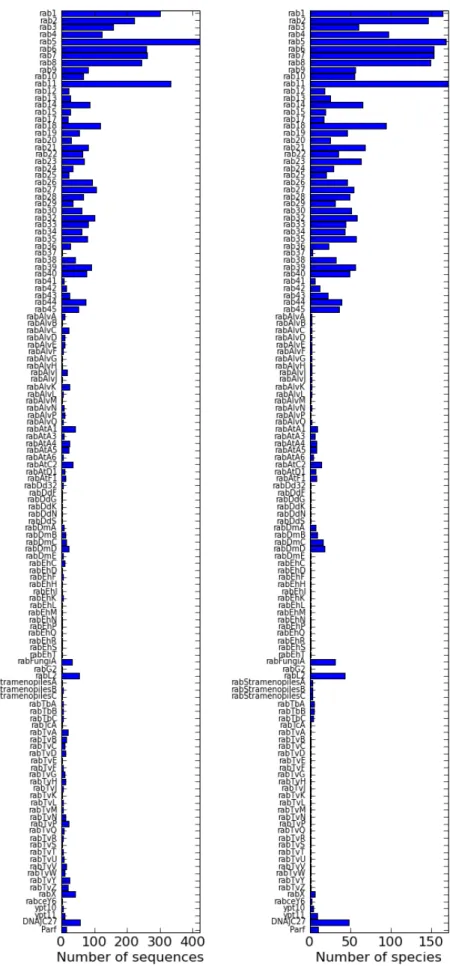
as a function of the threshold used. Note that 0.65, the value chosen as the definitive threshold, has a very low false negative rate. . . 16 2.6 a) Number of sequences in each annotated rab subfamily. b) Number
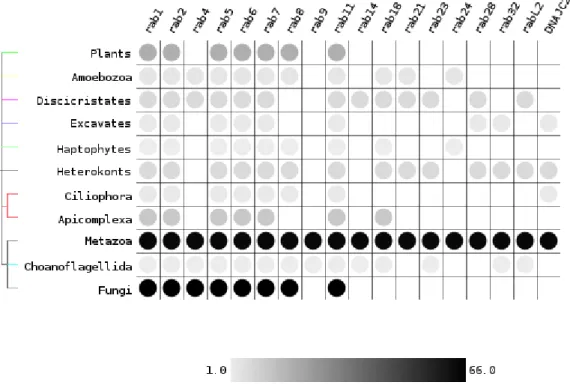
of species in which each subfamily appears. . . 19 2.7 Presence of subfamilies in major Eukaryotic groups as obtained by
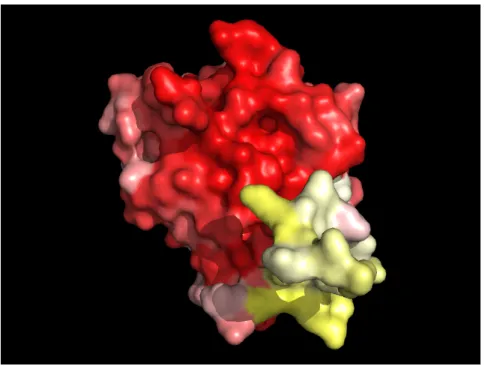
the Rabifier. Only subfamilies that appear in more than one group are shown. The greyscale indicates the number of species available each taxa. . . 20 2.8 Rab1 subfamily sequence conservation mapped on the surface of a
human rab1 protein tri-dimensional structure. White denotes lack of conservation, red denotes high conservation. Note the poorly con-served C-terminal hypervariable domain. . . 21 2.9 Consensus sequence alignemnt. Residues appearing in more than 50%
of the sequences are in uppercase. Sequence features are coloured: nucleotide-binding regions are green, RabF motifs are red and RabSF regions are blue. . . 22 2.10 Alignment of rab1 sequences from each of the major taxa. The RabSF
regions are highlighted. . . 23
2.11 Heat-map depicting the number of sequences in each functional group and major taxa as a z-score. Green indicates values above the mean, red values below it. . . 24 2.12 Neighbour-Joining tree of the subfamily consensus sequences. The
coloured branches represent functional groups. The subfamilies from the five species with a large number of new subfamilies (those starting with rabTv, rabDd, rabEh and rabAlv) did not appear to arise from any of the functional groups. . . 25 2.13 Detail of the subfamily view in TrafficDb. . . 27 3.1 Database schema for CentrioleDB. The Django generated tables for
user authentication are not shown. . . 31 3.2 Representation of part of the centriole controlled vocabulary. Each
node represents a term and an edge means that a term belongs to a group. For example, ’transition zone’ belongs to the ’structure’ group and the terms characterising a transition zone belong to the ’transition zone’ group. . . 33 3.3 Diagram of the inner working of a Django-based back-end. The
end-user is represented in blue, Django classes or functions are represented in green and the MySQL database is represented in orange. . . 34 3.4 Detail of the image submission form. Note the expanding basal body
annotations in (b). . . 36 3.5 The Browse view. The presence matrix is interactive and dynamically
generated. . . 37 3.6 An example of the results in a search for images. Note the URL
describing the user location. . . 38 3.7 The detailed description of a particular image. The vocabulary is the
same that is used when submitting the images. . . 39 3.8 The general search view, where the user can search for images or for
proteins. . . 40 3.9 An example of the information stored in the database about a
par-ticular protein. . . 41
List of Tables
2.1 Validation for new family assignment . . . 14
Chapter 1
Introduction
1.1
Bioinformatics in cell biology
Biology has greatly benefited from informatics, especially in today’s age of whole genome sequencing. The trove of data that modern sequencing and high-throughput techniques generate could not be analysed or stored without the input from the bioinformatics community. Furthermore, bioinformatics has provided valuable con-text through ontologies and integrated databases like UniProt or Ensembl. Apart from molecular biology, computer science has contributed to microscopy through image analysis and to evolutionary biology through computational and statistical methods to determine phylogenies.
However, to study evolutionary cell biology, that is, how complex systems evolved in a cellular context, what is needed is the integration of some or all of the above-mentioned types of data, molecules, images and evolution, specific to the system under study.
In this work, I develop two tools to allow the study of the evolution of two dif-ferent systems in Eukaryotes: protein trafficking and microtubule-based organelles. Each tool has different requirements and so different informatics techniques were used in their construction.
1.2
Protein trafficking pathways
One of the distinguishing features between Eukaryotes and Prokaryotes is the pres-ence of membrane bound organelles in the former. With them cells are able to com-partmentalise, specialise and optimise the functions of the different compartments. However, they had to evolve components to coordinate the transport between them. This transport takes the form of membrane vesicles that bud from the origin mem-brane and are transported to the target memmem-brane, where they fuse with it, releasing their cargo.
Chapter 1. Introduction 2
1.2.1
Biological details
The last Eukaryotic common ancestor (LECA) is thought to have already had a com-plex trafficking system, the main components of which form those of the trafficking system of today’s Eukaryotes [14]. These components include, among other, vesicle coat proteins, SNAREs and, playing an important regulatory role, rab proteins [35]. In 1987 the first rab, the ras-like protein SEC4, was identified in yeast and shown to play a role in the late stages of the secretory pathway [33]. In 1989, the ras-like protein 3 was identified in the rat brain [7]. We know it by its more common name, rab3. Since then, the total number of rab proteins has risen to 11 in yeast and to over 60 in humans. This variation is observed just in Opisthokonta; if we include other Eukaryote major taxa, we can reach hundreds of rabs in the same organism, as is the case of the unicellular excavate Trichomonas vaginalis [8].
The role played by the rab proteins in vesicular trafficking is that of regulators and coordinators [35]. Their molecular function, however, is analogous to a switch: when activated (bound to GTP) rab proteins interact with and recruit effectors who will in turn perform the functions necessary for vesicle budding, transport and fusion. The switch aspect of rabs is intimately related to their tridimensional structure. The Switch regions of these proteins change conformation depending on whether they are bound to GTP or GDP. In the GTP-bound state, the surfaces exposed have the capability of interacting with the effectors [29]. Another characteristic of rabs is an unstructured and variable C-terminus domain, at the end of which are normally prenylated cisteines. These post-translational modifications anchor the proteins to membranes.
Rabs are themselves regulated by various proteins. Guanoside exchange factors (GEFs) exchange GDP bound to rabs by GTP, thereby allowing them to recruit effectors. GTPase-activating proteins (GAPs), on the other hand, stimulate the hydrolysis of the GTP molecule, thus inactivating the rab [35]. Some rab effectors are able to recruit GEFs to their vicinity, preventing the untimely deactivation of the rab to which they were bound [16]. Rab escort proteins (REP) are responsible for presenting newly-synthethised rabs to the enzimes that add the prenyl groups. After the post-translational modification, GDP-bound rabs are recognized by GDP dissociation inhibitors (GDIs). GDIs have the capability of removing rabs from the membranes. Thus, by forming complexes with rabs in their inactivated forms at the target membranes, GDIs bring them into the cytosol and near the origin membranes, where GDI displacement factors (GDFs), break the complex and reattach the prenyl groups to the membrane [28].
Rab effectors do not bind all rab proteins. Instead each rab subfamily has its set of effectors. This, combined with specific cellular localisation, allows each rab subfamily to regulate specific steps in the trafficking pathways. For example, rab3,
Chapter 1. Introduction 3
the first rab to be identified in mammals, regulates the secretory pathway in neurons. Other rabs are present in all cells, but still have a specific localisation and function, like rab5, which localises to the plasma membrane and regulates the formation of early endosomes, or rab1, which localises to the endoplasmatic reticulum and regulates the transport from it to the Golgi apparatus. This specificity in function and localisation make the rab proteins good candidates for organelle markers. After all, if a specific organelle is missing in a species, it is likely that the rab that controls the traffic to or from that organelle will be missing as well.
The evolution of protein trafficking components, including rabs, is thought to have happened through duplication of ancestral sequences, leading to paralogues that diverged and specialised in new functions [14].
Given their presence in LECA, their important role in a defining Eukaryotic process and their ability to mark the presence or absence of organelles or transport-related processes, knowledge on the evolution of rabs may shed light into the rela-tionships between the various Eukaryotic groups. However, we first need to identify the phylogenetic profile of different rabs in a broad selection of organisms. Un-til now, most of the organisms with well-characterized rabs are either Metazoa or Fungi. There are some others in further away branches of the evolutionary tree, but they are few and far between. A systematic identification and classification of rab proteins in as many species as possible would create an invaluable resource to the protein trafficking community.
1.2.2
Objectives and techniques used
In this work, I attempt to systematically identify and classify the rab proteins of near two-hundred species. To this end I developed a workflow, nicknamed the Rabifier, to automatically identify and predict rab proteins when given the protein sequences present in a genome. I also used a combination of automatic and manual verifications to validate the predictions of the Rabifier and built a web-based interface to share my results with the community.
When possible, the Rabifier uses already developed tools. Specifically: 1. BLAST was used to measure sequence similarity [2];
2. BLAST variants Psi-BLAST and RPS-BLAST [3] were used to, respectively, build and search position-specific score matrixes (PSSM) describing a set of sequences;
3. the expectation-maximisation algorithm MEME/MAST was used to detect sequence motifs [4];
Chapter 1. Introduction 4
4. ClustalW [9] was used to do multiple sequence alignments and Neighbour-Joining phylogenetic trees.
The workflow implementation was done using Python and its BioPython pack-ages [11]. The results were stored in a relational MySQL database. The different steps of the Rabifier workflow were validated by leave-one-out and cross-validation approaches.
TrafficDB, the website that houses the final Rabifier results and which will serve as the basis for a community resource housing information about every component of the protein trafficking pathways, was implemented using the Python-based Django web framework for the back-end and a MySQL relational database for data storage.
1.3
Microtubule-derived organelles
In addition to the membrane-bound organelles, the Eukaryotes are also distinguished from the Prokaryotes by their complex cytoskeleton. It is composed by actin fila-ments, intermediate filaments and microtubules.
Microtubules are cylindrical arrangements of tubulin. They can serve as rails for vesicle trafficking or organise themselves into bigger structures that have essential and varied functions inside the cell. These microtubule-derived organelles are pos-tulated to have a common origin, but the study of its evolution is dependent of a prior assessment of the various morphologies underlying its functions.
1.3.1
Biological details
Ever since Antonie van Leeuwenhoek and Robert Hooke observed the first cells with a microscope in the seventeenth century, images and the information contained therein has been a part of cell biology. The advent of new microscopy techniques only highlighted the great morphological diversity among living organisms. However, the focus of molecular biology on model organisms, although providing in-depth information about a few tips of the evolutionary tree, did not help us understand how conserved are our findings when moving across species.
Centriolar-like structures are microtubule-based Eukaryotic organelles that act in cell division, chromosome separation, cell motility, cell sensing and transport inside the cell (acting as microtubule organising centers) in their various guises as centrosomes, axonemes and flagella. In some form or other, these structures are found in all crown Eukaryotic groups. While not all branches have them, like higher plants and yeasts, this fact is better explained by secondary loss than by the same structure arising independently several times in evolution.
The overall structure if these organelles is conserved, consisting of a cylindri-cal arrangement of microtubules, but there is plenty of variation inside this main
Chapter 1. Introduction 5
organisation. The fold-symmetry can change from species to species, for example. The axoneme of a paramecium has nine symmetric microtubules, while some wasps have hundreds. Some cells have only one cillium, others have many. Structures as-sociated with the cylindrical organelle can vary between species or within different centriolar-structures in the same species.
The molecular biogenesis of this organelle is still under study, but several pro-teins are know to be involved, including SP2/CEP192, SAK/PLK4 and SAS6 [13]. However, to fully understand the evolution of centrioles, we need to look past in-dividual molecules and into the morphological variation that is the result of the molecular activity. The data to assess this variation exists in the form of decades of exquisite and detailed electron microscopy (EM) images of centriolar-like structures. However, this data is not annotated, centralised or placed in comparison with the recent molecular-based discoveries on centriolar biogenesis.
1.3.2
Objectives and techniques used
In this work, I build CentrioleDB, a community resource to address the lack of integration of decades of electron-microscopy data with today’s molecular biology knowledge. CentrioleDB is a web-based EM picture annotation and retrieval inter-face that also supplies molecular information of interest to centriolar structures, all put in their proper taxonomic (and, by proxy, evolutionary) context.
To serve its purpose, CentrioleDB has the following requirements:
1. an evolving controlled vocabulary to properly describe microtubule-derived organelles;
2. a database schema that allows image annotation using the controlled vocabu-lary;
3. a web interface that allows users to annotate and upload electron-microscopy images from the literature;
4. said web interface must also allow users to retrieve previously uploaded images and stored molecular information.
The database was implemented with the database management system MySQL, while the website uses the Django web framework as its back-end.
1.4
Thesis structure
The work here presented can be organised along two different lines: the biological backgrounds or the informatics techniques used. Should the latter line of organisa-tion be chosen, the work is separated between a machine learning part, regarding
Chapter 1. Introduction 6
the automatic annotation of proteins, and a database and interface building part, regarding the manual image annotation and the presenting of results to the cell biol-ogy community. If structured along the biological backgrounds, the work is instead separated into a part regarding rab proteins, which includes machine learning for the automatic annotations and database and interface development for presenting these annotations, and a part regarding centrioles, which consists mainly of database and interface development for manual image annotation and retrieval.
I decided to use the biological background line of organisation to present my work, separating it in two chapters:
1. one describing the work done on rab proteins, which was the development of the Rabifier and of TrafficDB;
2. another describing the work done on centrioles, which was the development of the CentrioleDB image annotation interface.
A third chapter in the end provides the general conclusions of the work here presented and its future directions.
I feel that this structure will produce greater clarity when introducing the prob-lems that need to be solved and the results obtained. In addition, the machine learning techniques are used exclusively on the rab protein theme and, while there is some overlap with website and database development on both biological themes, most of that kind of work regards centriole image annotation. The separation on biologial contexts thus also provides, to some extent, separation on the informatics techniques used.
Chapter 2
Rab proteins
2.1
The problem: how to classify?
Each Rab subfamily has a specific location and function in the cell. Sometimes two rabs will regulate different movements between the same organelles. For example, the rab1 subfamily coordinates movements from the endoplasmatic reticulum to the Golgi, while the rab2 subfamily regulates vesicle trafficing in the opposite direction. Taking into account that a rab only acts through its effectors, its function specificity is a result of its effector binding specificity.
It should be stressed here that a subfamily is more than a arbitrary group of rab proteins. Members of a subfamily are linked by sequence similarity and function. If we annotate a protein as a rab, we are stating that it acts as a molecular switch in trafficking pathways. If we further specify that it is a rab5, we are assigning it a very specific location (at the cellular membrane) and function (regulate the movement of early endosomes) and that it interacts with the same effectors as others rab5 proteins. Function follows effector binding and effector binding is driven by the sequence. Or, conversely, we can use the sequence as a proxy for predicting to which subfamily a rab belongs and from the presence of a subfamily infer that a specific function is present in an organism.
Two main problems arise when trying to identify and classify rab proteins based on their sequence. One is that its overall similarity with other Ras superfamily proteins may result in Ras, Rho and Arf proteins being incorrectly classified as Rabs. On the other hand, if the objective is to classify proteins to the subfamily level, differences in the sequence of different subfamilies must be found that will help distinguish them.
Chapter 2. Rab proteins 8
2.2
The rab protein sequence and subfamilies
2.2.1
As a whole
As described in the introduction, the rab protein is globular in its N-terminus and unstructured in its C-terminus. The organisation of different Ras superfamily pro-teins shows that the overall sequence organisation is conserved across families, with a six-stranded beta sheet and five alpha helixes.
A comparison done in 2000 by Pereira-Leal and Seabra [26] revealed linear se-quence motifs shared across all Ras superfamily proteins and responsible for their GTPase activity. Of greater importance to rab classification, the same study de-tected five linear motifs (dubbed RabF1-5) that are conserved across the rab family and aren’t discernible in Ras, Rho or Arf proteins and identified their consensus sequences. The RabF motifs allow us to better discriminate between the rabs and the other ras superfamily members.
Figure 2.1: Representation of the rab3 tridimensional structure from Pereira-Leal and Seabra, 2000 [26]. RabF motifs are depicted in red, RabSF regions in yellow, and the conserved nucleotide binding motifs in green. The alpha-helixes and beta-sheets were the conserved regions and motifs are inserted are also identified.
2.2.2
Characteristic motifs
In adition to the RabF motifs, Pereira-Leal and Seabra also found four rab subfamily specific regions (RabSF1-4). These regions, while not lying in the Switch regions,
Chapter 2. Rab proteins 9
have been shown to act as part of the interaction surfaces, helping establish rab-effector specificity. With their subfamily specificity, the RabSF regions could help distinguish proteins from different subfamilies based on their sequences.
2.2.3
What we don’t know
Despite us knowing the constituent parts of a rab sequence, some caveats should apply when attempting to design an automatic classification workflow. One should keep in mind that the previously identified motifs relied on a set of sequences that consisted mainly of Metazoa. While previous studies have show the conservation of RabF motifs in several branches of the tree of life,[27] [1] [20] one should allow for some variation in the consensus sequences.
As regards the RabSF regions, a recent study of two rab subfamilies (rab7 and rab9) across the eukaryotic three of life showed that they are recognisable but not as conserved as one might expect [21]. A further problem in using the RabSF regions in a automated manner is the uncertainty about their precise location and the lack of known consensus sequences for each subfamily.
2.2.4
Goal
Given that identifying a subfamily in a species amounts to stating that a particular step in the trafficking pathway exists in that species, a survey of the rab subfamily profiles on the different organisms that make up the Eukaryotic tree will act as a proxy to describe the trafficking system in those organisms, and, by comparing it across organisms, to describe its evolution. To achieve this end, my goal is twofold:
1. given a genome, identify which of its proteins are rab proteins;
2. assign a rab protein a subfamily and a function based on its sequence.
2.3
The Rabifier
Armed with the knowledge of the rab sequence, I designed a workflow, named Rabi-fier, to automatically identify and classify to the subfamily level the rabs in complete Eukaryotic genomes.
My objective is to fill in the blanks in rab annotation in the Eukaryotic tree. We currently know a great deal about the rabs from Metazoa and Fungi and we have some knowledge about specific organism scattered around the tree, but for most of the sequenced species there have been no studies. A dataset that covers most of the sequenced Eukaryotic organisms should prove invaluable for future studies on the evolution of this ubiquitous protein family and of the endomembrane system.
Chapter 2. Rab proteins 10
To illustrate the scope of this endeavour, most bioinformatics projects on rab classification focus on a single organism [30] [1] [31] [20] [40]. Recently, one project tried to classify rabs in 28 fungi [25] while another covered the full Eukaryotic tree, but only for two rab subfamilies [21]. My project encompasses 182 different genomes and starts with most of the known rab subfamilies, with the possibility of identifying new ones.
Given the vast number of organisms to be classified and the small number of organisms for which we have information, it is not advisable to blindly trust the results of the workflow, even if the validation done yielded good results. Our vali-dation can only be based on the information we have available, which does not span the necessary evolutionary distance. The Rabifier was developed keeping in mind that a good proportion of its predictions would have to be manually validated.
2.3.1
Building a reference set
I do not start classifying the rabs from a blank slate. Previously annotated sequences served as the starting point from which new rabs will be annotated. This makes the Rabifier workflow an instance of supervised learning.
The reference set is comprised of previously [27] and manually compiled se-quences from human, Saccharomyces cerevisiae and Caenorhaditis elegans which are annotated as rab/ypt in Ensembl [18], SGD [10] and Wormbase [6]. In addition, sequences for Plasmodium falciparum [30], Trypanosoma brucei [1] and Arabidopsis thaliana [31] were taken from published organism-specific studies.
This reference set was assembled manually and stored in a MySQL database. The following steps were implemented in Python, using several of the BioPython packages [11], and were applied for each of the 182 genomes in a sequential manner. After a first run, the 182 genomes were run again. This is because, in addition to the manual reference set, the workflow also uses the proteins it annotates as the basis of future annotations. If I had run the genomes through the workflow only once, the first genomes would only have the manual annotations as references, compared to the last one which would have, in addition to the manual annotations, the automatic annotations of 182 genomes. It is also because of this incremental approach that several genomes were not run in parallel. The list of genomes analysed is available in the TrafficDB website.
2.3.2
Finding putative sequences
Description
The sequence database used was Superfamily [38] (as it stood on the 28th of Septem-ber, 2008). This database was chosen because it includes SCOP [12] protein domain
Chapter 2. Rab proteins 11
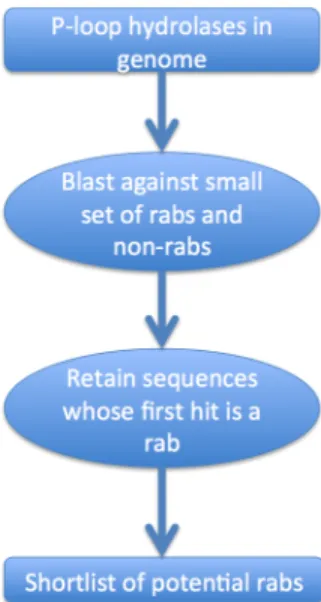
Figure 2.2: Flowchart describing identification of putative rab sequence.
assignments. Being GTPases, all rabs incorporate the SCOP domain ’P-loop taining nucleoside triphosphate hydrolases’. By selecting only the proteins that con-tain this domain, the number of sequences that must be tested is greatly reduced at no loss of coverage.
For the genome being evaluated I retrieved the sequences that contained the P-loop hydrolase domain domain and ran a BLAST process of each sequence against a discriminating set of sequences containing rabs (yeast and human) and other proteins that, while similar to rabs, belong to other families.
Validation
The discriminating set was refined by repeatedly subjecting Candida albicans and Dictyostelium discoideum genomes to the SCOP domain selection and subsequent blasting steps. The results were manually analysed by looking at the sequences and their annotations. In each iteration, clearly non-rab sequences that were retrieved were added to the the discriminating set of proteins.
The criterion reached this way to find a putative rab was that the sequence had to find as its best hit a rab with an e-value lower than 10−5. Should the best hit be a rab with a e-value above 10−5 or a protein that is not a rab, the sequence being tested is discarded. Different criteria using the top 5 or 10 hits did not yield better results than this simple approach. Through this approach, it is ensured that we select proteins that are more similar to rabs than to any other protein family.
Chapter 2. Rab proteins 12
2.3.3
Confirming these putative sequences
Description
After finding a shortlist of putative rabs, the next step was to try and confirm if they were actual rabs. As described previously, rab proteins contain F motifs that distinguish them from other Ras superfamily members. Using the MEME/MAST [4] package I am able to create a probabilistic model for each F motif using the consensus sequence and the rab manual curated reference sequences and use that model to determine if the motifs appear in the putative rab sequences.
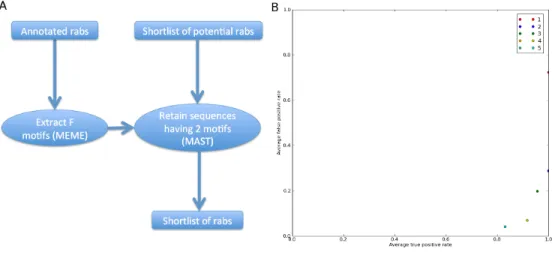
Figure 2.3: A) Flowchart of the F motif-based sequence confirmation; B) ROC curve for the validation of this approach. Each dot represents the average of a cross-validation. The different colours indicate the threshold level used. As can be seen, a perfect true positive rate is achieved with two motifs detected as the threshold.
Validation
This approach was tested using cross-validation by building the model with all the reference species minus one, and then finding the motifs in the species that was left out. In the end, sequences that got through both the first selection and the F motif filter would be compared with the manually curated sequence to determine true and false positive rates. This validation was run for five different threshold levels (for the number of motifs found in the putative sequences). After analysing the results of the cross-validation (Fig. 2.3 B), I chose to use 2 as the number of motifs a putative sequence should have in order to be considered a rab. At this threshold level, the average true positive rate is 1 and the average true negative rate is below 0,3. While it is possible to decrease the latter value at the expense of the former, one must keep in mind that we have a limited reference set. I do not chose a more stringent
Chapter 2. Rab proteins 13
threshold to allow for possible variation in some of the motifs when dealing with organisms placed in distant branches compared to our reference species.
2.3.4
Creating new subfamilies
2.3.5
Description
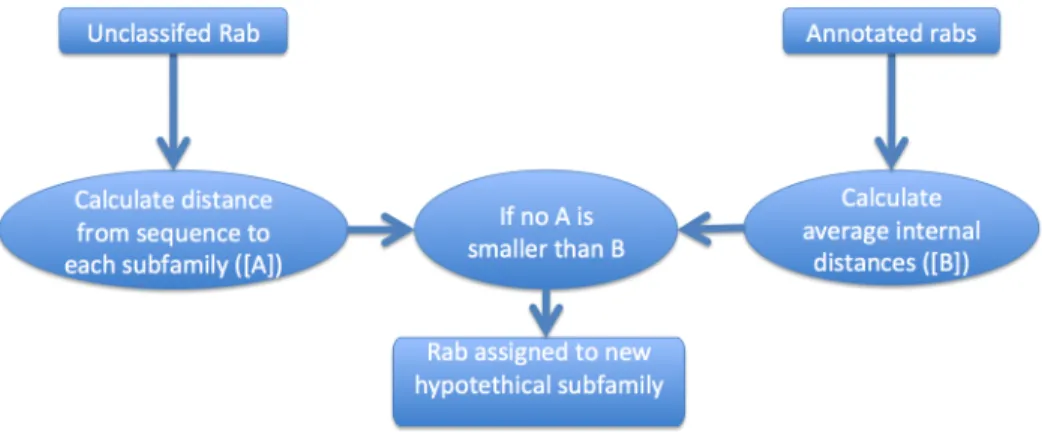
At this point in the workflow we have a list of rabs, but they aren’t assigned to any subfamily. Given the number of organisms evaluated and the number of reference organisms, it is likely that some of the rabs to be assigned belong to a subfamily for which we don’t have any references. I devised a approach based on clustering techniques to try to automate this process (Fig. 2.4).
We defined the distance da,b between two sequences a and b as 1 − (La+LNsim
b)×0.5
where Nsim is the number of similar residues that align when two sequences are
blasted against each other and La and Lb are the lengths of each of the sequences.
For a sequence being evaluated s and a rab subfamily A containing n sequences [a1, a2, . . . an] the distance Ds,A between s and A is defined as
Pn i=1ds,ai
n , which is
the average distance between the sequence and the members of a subfamily. Each subfamily A has an average internal distance IAwhich is the mean of dij, where i, j
make all the possible pairs between the set of sequences in A. Should A have only one sequence, we assume IAto be the average of I for all subfamilies with more than
one sequence.
For each sequence being evaluated s and each existing subfamily A, we check if Ds,A < IA. If that is false for all subfamilies, the sequence under evaluation is
assigned to a new subfamily. Note that in this step we are no longer comparing our sequence solely to the manually curated reference set, we are also incorporating the sequences previously annotated by Rabifier in the subfamilies when comparing the distances.
Chapter 2. Rab proteins 14
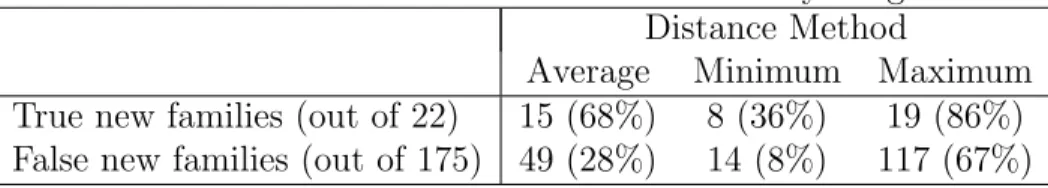
Table 2.1: Validation for new family assignment Distance Method
Average Minimum Maximum True new families (out of 22) 15 (68%) 8 (36%) 19 (86%) False new families (out of 175) 49 (28%) 14 (8%) 117 (67%)
Validation
This (admittedly convoluted) method does not guarantee good results. The different taxon-specificity of rab subfamilies means that there are different degrees of diver-gence between the members of a same subfamily. For example, members of the rab5 subfamily, present in all Eukaryotes, are not as similar to each other as members of the rab3 subfamily, which is present only in organisms with nervous systems. I tested different variations of the described method by taking each of my reference sequences in turn and comparing them with the rest of the dataset. Variation in-cluded minimum and maximum distance between a sequence and a subfamily and different thresholds. All gave unsatisfactory results.
Keeping in mind that the workflow results would be reviewed manually (espe-cially the new families), I decided to use the average distance between a sequence and a subfamily and the mean distance inside a subfamily as the threshold, since these parameters balanced the number of true and false new families (Table 2.1).
2.3.6
Assigning sequence to a family
Description
If a sequence does not qualify to start a new subfamily, it must be assigned to an existing family. I used the same technique used by the NCBI Conserved Domain Database [22]. Psi-blast [3] is an iterative version of Blast that returns a collection of related sequences. It also generates a position-specific scoring matrix (PSSM) that describes this collection. A group of PSSMs can be used to create a database that can be queried by sequences with the Reverse Psi-Blast (RPS-Blast) program, much like a Blast database, only it returns a ranked list of PSSMs from the database instead of sequences.
With Psi-blast I created PSSMs for the various subfamilies. As in the previous step, these subfamilies have not only the initial reference set, but also the sequences that the Rabifier has annotated until this point. I then use RPS-Blast to query the PSSMs with the as yet unassigned sequence.
Chapter 2. Rab proteins 15
Validation
This was validated using a leave-one-out approach where each sequence in the ref-erence set that didn’t belong to a single-sequence subfamily was queried against a PSSM database made with the other sequences. During validation, 160 out of 175 sequences were placed in the correct family.
2.4
Confirming the results of the Rabifier
Due to the number of genomes that we chose to run and the decision not to run several genomes in parallel, the Rabifier took three weeks to pass through every genome twice. The results were stored in a MySQL database between each genome pass to prevent data loss due to unforeseen circumstances.
In total, the genomes searched had 3.058.867 sequences, of which 660.193 were annotated with the SCOP domain ’P-loop containing nucleoside triphosphate hy-drolases’. After passing through the discriminating set of rabs and non-rab proteins described in section 2.3.2 and through the RabF motif-based confirmation described in section 2.3.3 the set of P-loop hydrolases dwindled to 6252 sequences identified as rabs.
Most of the sequences identified as rabs were assigned to existing subfamilies, but 653 were assigned to 45 newly created rabHyp (for hypothetical) families. These hypothetical families ranged from unique sequences to a family with 132 sequences. These results, however, were not yet in a state where they could be trusted. As explained previously, we expected the workflow to produce mistakes, which would be propagated by the inclusion of automatically annotated sequences as new references.
2.4.1
Subfamily alignments
To reduce the number of sequences that would have to be manually analysed, I attempted to automatically flag those that could be wrongly classified. To this end I took advantage of the subfamily-specific SF regions. While I didn’t know the con-sensus sequence or the precise location of these regions in the different subfamilies, they were flanked by the conserved F and GTP-binding motifs. After aligning the sequences of each subfamily (restricting for sequences which were too big and would create long stretches of gaps in the alignment), MEME/MAST was again used to find the F and GTP-binding motifs. Once found, their positions could serve as anchors to automatically extract the rough regions of the SF regions. For each sub-family, the consensus in these regions and its identity to each sequence’s SF regions was calculated. Sequences that had a SF region identity with the consensus for the subfamily under a certain threshold were flagged for manual analysis.
Chapter 2. Rab proteins 16
To determine the threshold, I once again resorted to my reference set of rab proteins. I randomly added sequences to subfamilies where they didn’t belong and tried to flag them using the described method. This was done for identity threshold levels between 0 and 1 at 0.01 intervals, with 1000 random tests per interval. For each threshold, the false positives, defined as sequences that were flagged that were in fact correct, and the false negatives, defined as sequences that were in the wrong family and should have been flagged, but weren’t, were counted. The resulting false positive and negative rates are shown in figure 2.5. After analysing these results, I chose 0.65 as the threshold for sequence flagging, as this was a value with a very low false negative rate but still had a manageable false positive rate.
Figure 2.5: False positive and negative rates for correct sequence flagging plotted as a function of the threshold used. Note that 0.65, the value chosen as the definitive threshold, has a very low false negative rate.
After running the scripts, 2471 sequences were flagged. Using the previously calculated subfamily alignments, I manually reviewed which seemed to be in the correct subfamily and which were correctly flagged. Of the flagged sequences, 1019 were removed from their Rabifier assigned subfamilies and marked as unclassified.
2.4.2
Automatic Hyp family assignment
To try to determine automatically which of the rabHyp families were real, two methods were used. The first relied on a 0.7 percent identity between two sequences criterion presented in [27] to determine if two rabs were isoforms. I calculated the percent identity between rabHyps and rabs in other subfamilies. If a rabHyp subfamily had isoforms in a normal subfamily, I would pool the two subfamilies.
Chapter 2. Rab proteins 17
For the remaining subfamilies, I tried to detect orthologues between the rabHyp subfamilies and the organisms that constitute my reference set using the bidirec-tional best hit method [24]. If orthologues were detected, the rabHyp family would be pooled with the corresponding subfamily. In some cases the orthologues were sequences that were not in my reference set as rabs, but were rabs nonetheless, like the human rab45/RASEF and rabL2. This means that the workflow could detect real subfamilies which were not in the original reference set.
2.4.3
Unclassified sequence assignment
The unclassified sequences were manually assigned to subfamilies using a combi-nation of phylogenetic trees for the rabifier results of major taxa and the refer-ences, orthology mapping using Blast bidirectional best hits and simple best hits between the unclassified sequences and the reference organisms. The trees were generated automatically by a script which used the ClustalW sequence alignment and Neighbour-Joining program. The Blast queries for the best hits, bidirectional or otherwise, were done using a Python script. On-line databases like Ensembl [18], SGD [10] and Wormbase [6] were used to view the annotations for hits that were not in the original reference set.
A note on nomenclature. The previously established standard is to use let-ters when defining organism-specific subfamilies, followed by numbers to distinguish among related subfamilies. Arabidopsis, for example, has, among others, several rabA subfamilies (named rabA1, rabA2 and so forth). However, the subfamilies defined in different taxa with the same letter may not belong to the same subfam-ily. In an attempt to use existing names without generating ambiguities, I named letter-defined families after the taxon where they were identified by preceding the letter by the species organism’s name initials. This way, the Arabidopsis rabAtA subfamilies can be distinguished from the Trichomonas rabTvA subfamilies. If the taxa where a new subfamily has been discovered is of a higher level than species, more than two letters may be used (as in rabFungiA or rabAlvA, for Alveolata). If a sequence could not be grouped with at least another one to create a subfamily, it is assigned the letter X, as in rabDmX.
Five organisms displayed a great number of unclassified rabs and were analysed more closely: Trichomonas vaginalis, Tetrahymena termophila, Paramecium tetrau-relia, Dictyostelium discoideum and Entamoeba hystolitica. For T. vaginalis [20] and E. hystolitica [32] previous studies had found and classified their rab proteins, while dictyBase [15] had classification for some of the D. discoideum rabs. In these three cases, the sequences recovered by the Rabifier were aligned with human and yeast references and the appropriate organism-specific references. When appropriate, new sequences were assigned to existing families, otherwise they were assigned to new
Chapter 2. Rab proteins 18
families. T. thermophila and P. tetraurelia, on the other hand, were not the object of previous studies. Since both are Alveolata, they were studied together. New families from these two organisms were named rabAlv, rabTt or rabPt depending on whether they contained sequences from both or only one organism.
2.5
Result analysis from rab protein classification
After automatic and manual annotation, 5258 sequences were classified as belonging to one of 147 rab subfamilies, including the non-discriminative rabX subfamily with 42 sequences. The number of sequences in a subfamily varied from two to more than four hundred (Fig. 2.6(a)). Subfamilies ranged from ubiquitous (present in all 182 analysed genomes) to species-specific (Fig. 2.6(b)).
Not all newly discovered subfamilies were exclusive to less studied taxa. Four metazoan rab subfamilies which were not included in the reference dataset were recovered. These are DNAJC27, a protein containg a rab and a DNAJ domain [23], rab45, a protein containing a rab and a EF-hand domain also known as RASEF [34], rabL2 (for rab-Like protein 2) [39] and Partner of ARF (Parf) [36]. As with rab45 and rabL2 in the rabHyp subfamilies, these findings point to the capability of the workflow to discover new bona-fide subfamilies.
2.5.1
Ancestral rab subfamilies
With the rab profiles for organisms that, with the exception of Cercozoa, span all the major Eukaryot taxa as defined by Baldauf in 2003 [5] I can try to see which subfamilies are ancestral. To account for false positive results, I only assume that a subfamily is present in a major taxon if it is present in more than one third of the taxon’s species. This is an arbitrary value, chosen to try to avoid situations where a taxa has a very small number of species and, consequently, a small number of wrongly annotated sequences would have great impact. Two groups presented great heterogeneity in the rab profiles of their species and were exploded into more specific taxa. In Opisthokonta, Metazoa shows a great variety of different subfamilies while Fungi has a very reduced set. In a similar manner, the Ciliophora showed a much greater variety of rab subfamilies when compared to the other members of Alveolata, the Apicomplexa.
As seen in figure 2.7, rab 1, 2, 5, 6, 7 and 11 are universal. Rab 4, 8, 18, 21, 23 and 28, while not universal, were present in the ancestral Eukaryote and lost in some of the major groups and this data is supported by both the Rabifier results and the reference dataset. The remaining subfamilies (14, 24, 32, rabL2 and DNAJC27) are shown by the Rabifier results, without support from the reference dataset. If it is confirmed that these subfamilies were indeed present in the last Eukaryotic common
Chapter 2. Rab proteins 19
Figure 2.6: a) Number of sequences in each annotated rab subfamily. b) Number of species in which each subfamily appears.
Chapter 2. Rab proteins 20
Figure 2.7: Presence of subfamilies in major Eukaryotic groups as obtained by the Rabifier. Only subfamilies that appear in more than one group are shown. The greyscale indicates the number of species available each taxa.
Chapter 2. Rab proteins 21
ancestor (LECA), this represents an increase in the variety of its rab repertoire [25] and, by extension, of its trafficking system’s complexity.
Figure 2.8: Rab1 subfamily sequence conservation mapped on the surface of a human rab1 protein tri-dimensional structure. White denotes lack of conservation, red denotes high conservation. Note the poorly conserved C-terminal hypervariable domain.
2.5.2
Consensus sequences and motif conservation
To evaluate the sequence conservation in a subfamily, I aligned all the sequences belonging to the same subfamily and derived a subfamily consensus sequence. The alignments were also used to map the sequence conservation onto the tri-dimensional structure of the protein. When no structure for a specific subfamily was available, the alignment was mapped to the structure of rab1. In the example provided in figure 2.8 we can clearly see the high degree of conservation (shown in red) of the effector interface and the poor conservation in the C-terminal hypervariable domain. The various conservation-structure mappings are available in TrafficDB, described in section 2.6.
The consensus sequences for the previously described ancestral rab families are aligned in figure 2.9. The nucleotide-binding and RabF motifs are well conserved in and between subfamilies, as expected. As for RabSF regions, while on a general level they were conserved inside a subfamily (with the exception of RabSF4), they are less conserved positions than in RabF motifs. The C-terminus hypervariable domain is very poorly conserved in all subfamilies, including, unexpectedly, the presumable
Chapter 2. Rab proteins 22
RabSF4 region. This seems to be in agreement with previous findings for the rab7 and rab9 functional group [21].
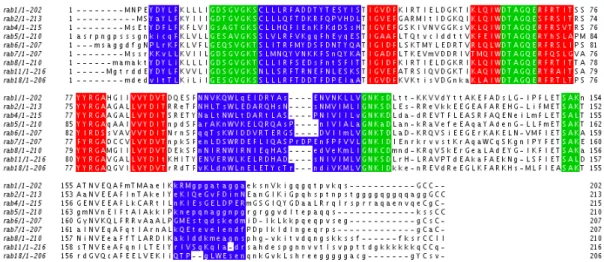
Figure 2.9: Consensus sequence alignemnt. Residues appearing in more than 50% of the sequences are in uppercase. Sequence features are coloured: nucleotide-binding regions are green, RabF motifs are red and RabSF regions are blue.
To further exemplify the conservation of the RabSF regions, figure 2.10 shows an alignment of rab1 sequences from each of the major taxa. Again sequence con-servation, albeit not absolute, is observed in the RabSF regions, with the exception of the C-terminal RabSF4.
2.5.3
Rab functional group expansions
Some rab subfamilies are clustered by function and phylogeny into eight functional groups [27]. Using a z-score, I compared the mean number of rabs that each ma-jor taxa had from a specific functional group with the average of those means over all the major taxa to determine in which, if any, taxa the functional groups had expanded (Fig. 2.11). Functional groups III (associated with secretory granules) and IV showed a great deviation from the mean in metazoa, and with good reason: they only appear in that taxon. Plants evidenced an increase in functional groups II, VII and VIII, corroborating the findings of Rutherford and Moore in 2002 [31] who presented evidence for the expansion in Arabidopsis thaliana of subfamilies as-sociated with rab11, 7 and 8 (corresponding respectively to the functional groups mentioned). Other prominent expansions are those of functional groups I and VII in Amoebozoa and of functional groups I, II, V, VI and VIII in Ciliophora. These taxa include four of the species which had a great number of new subfamilies: P. tetraurelia and T. termophila in the Ciliophora and E. histolytica and D. discoideum in Amoebozoa. However, the new families were not taken into account when
calcu-Chapter 2. Rab proteins 23
Figure 2.10: Alignment of rab1 sequences from each of the major taxa. The RabSF regions are highlighted.
lating the functional groups expansions; these are due to an increase in these species of the number of sequences of previously identified subfamilies. Three major taxa in particular presented reductions in the number of sequences across the various functional groups: Apicomplexa, Fungi and Choanoflagellida.
A more detailed study of the reasons behind the reduction in the number of sequences in these taxa may shed light on cell biology issues. For example, the reduction in Apicomplexa may be due to the fact that many of its members are intracellular parasites. Choanoflagellida is composed by unicellular organisms and is the closest taxon to Metazoa, to which Homo sapiens belongs and which doesn’t seem to have suffered any reduction in the numbers of rabs, quite the opposite. By comparing the functional groups that are reduced we can pose questions about the role of the protein trafficking system in multicellular organisms.
2.5.4
Origin of taxon-specific rabs
As mentioned when discussing the assignment of unclassified sequences, five species presented a big number of rabs that did not fit existing subfamilies. Even though these rabs were assigned to new subfamilies, they may have originated from the same ancestral one. If this is the case, it might be that certain ancestral rab subfamilies can adapt more easily to new functions. To evaluate if this is the case, I tried to determine if the taxon-specific rabs evolved from the same subfamily.
Chapter 2. Rab proteins 24
Figure 2.11: Heat-map depicting the number of sequences in each functional group and major taxa as a z-score. Green indicates values above the mean, red values below it.
Chapter 2. Rab proteins 25
tree from the alignment, I tried to use the consensus as a proxy for each subfamily and establish the origin of these taxon-specific subfamilies. The resulting tree can be seen in figure 2.12. While, with one exception, the tree of consensus sequences depicts correctly the functional groups, it fails to give any clear indication of which of these groups the new families belong to.
Figure 2.12: Neighbour-Joining tree of the subfamily consensus sequences. The coloured branches represent functional groups. The subfamilies from the five species with a large number of new subfamilies (those starting with rabTv, rabDd, rabEh and rabAlv) did not appear to arise from any of the functional groups.
I then BLASTed the consensus sequences of the new subfamilies against the con-sensus sequences of the subfamilies which are thought to be present in the LECA. Again, no clear pattern emerged. For none of the organisms did the new
subfami-Chapter 2. Rab proteins 26
lies point clearly to one of the ancestors as the more similar. Apparently, in each organism, the duplications that gave rise to the new subfamilies did not arise pre-dominantly from a single ancestral rab.
2.6
TrafficDB
The sequences classified by the Rabifier are of potential interest to the protein traf-ficking, cell and evolutionary biology communities. Therefore, I designed a website where they are made available. Here users can view them in their proper taxonomical context. In addition, users have access to the subfamily consensus sequences, se-quence conservation plots and tri-dimensional rab structures with sese-quence conserva-tion mapped onto them. The website can be accessed at http://www.igc.pt/trafficdb . While it serves its current purpose of making available the classified rab proteins, the interface is still a work in progress that will evolve as other components of the trafficking pathways are added.
2.6.1
Database schema
The requirements for the database schema of TrafficDB are the ability to store a variety of annotations for a selection of proteins and the ability to connect the proteins to taxonomic information. These two requirements are already fulfilled by the database schema underlying CentrioleDB presented in section 3.2. Therefore, I used the same database architecture on TrafficDB, omitting the picture annotation module of CentrioleDB which isn’t needed here.
2.6.2
Website implementation
Like CentrioleDB, the website was implemented using the Python-based web frame-work Django. Two main views are available for the user, the subfamily and the taxon views.
Taxon view
In the taxon view, users are prompted for a NCBI taxon ID or a taxon name. This does not have to be a species; it can be taxa closer to the root of the Eukaryotic taxonomic tree. Upon selection, users are presented with a list of the rab subfamilies that were detected in that taxon, the identifiers to the sequences in each of the subfamilies and the option to download the sequences in FASTA format.
Chapter 2. Rab proteins 27
Subfamily view
The subfamily view provides more detailed information than the taxon view (Fig. 2.13). After selecting which subfamily one wishes to analyse, the user is taken to a page where he can navigate the Eukaryotic taxonomic tree and is provided with simple statistics regarding the number of members of that subfamily present in the adjacent nodes to the one he is in. This way the user can track taxon-specific expansions. In addition to the taxonomic information, the user is also presented with the consensus sequence for the subfamily and with two visualisations of the degree of sequence con-servation. One is a plot of the conservation of the most common aminoacid-residue in each position, while the other is a picture of the tridimensional structure of a rab with each residue coloured according to its degree of conservation, as in figure 2.8.
Figure 2.13: Detail of the subfamily view in TrafficDb.
2.7
Future of Rabifier
As mentioned when describing the workings of the Rabifier, this implementation took a long time to run. Therefore, it is not appropriate to use it to classify a single newly discovered sequence or genome. Nor is it needed. The main issue that led to the necessity of this tool was the fact that the previously analysed organisms did
Chapter 2. Rab proteins 28
not cover the full taxonomic diversity of Eukaryotes. Now that more species and subfamilies have representative sequences, simpler and more automated methods based on RPS-Blast or Hidden Markov Models can be used, in a similar manner to the NCBI CDD database [22]. In time, TrafficDB will implement this new tool making it a website not only for retrieval of identified rabs but also for identification of new rabs.
Regarding the biological implications of the results presented here, they were subjected only to a superficial analysis. Much more biological knowledge awaits to be mined from it. By studying the expansion of specific subfamilies instead of functional groups or taxon-specific instead of universal subfamilies, one will gain insights into where in evolution did specific cellular processes appear.
Chapter 3
CentrioleDB
3.1
Purpose
The goal of CentrioleDB is to provide the cell biology community interested in centriolar function and biogenesis with a resource that places this structure in its evolutionary context and bridges the gap between morphological and molecular in-formation. Most databases provided to the biology community focus on molecular information: sequences, mutants, markers and so on. By adding morphological in-formation we include an hitherto unexplored type of data in the study of centriolar function and biogenesis.
This resource is not only built for the community but also, in part, by the com-munity, as it provides an image submission and annotation interface using a con-trolled vocabulary designed to properly describe electronic microscopy (EM) images of centriolar structures taken from the literature. On the molecular sector of the website, users have access to information about the orthology of proteins of interest in centriolar structures, as well as the mapping of proteins to these structures.
CentrioleDB is the basis of a collaborative project encompassing, besides the Computational Genomics Laboratory, experts in the domain of centriolar structures who contributed their knowledge to the development of the controlled vocabulary and have provided and will continue to provide annotations for morphology and sequences. These experts include the Cell Cycle Regulation Laboratory at the Gul-benkian Institute for Science, Professor Keith Gull at the University of Oxford, Michel Bornens at the Institute Curie in Paris and Juliette Azimzadeh at the Uni-versity of California, San Francisco. Their contribution, feedback and enthusiasm has been invaluable to the project.
![Figure 2.1: Representation of the rab3 tridimensional structure from Pereira-Leal and Seabra, 2000 [26]](https://thumb-eu.123doks.com/thumbv2/123dok_br/18475311.899518/30.918.192.696.501.846/figure-representation-rab-tridimensional-structure-pereira-leal-seabra.webp)