Budgeting practices: a study on Brazilian hotel companies
Práticas de orçamento: um estudo em empresas hoteleiras do Brasil
Prácticas de presupuesto: un estudio en empresas hoteleras en Brasil
Paula de Souza1
Rogério João Lunkes2
Resumo: O presente estudo tem como objetivo explorar as práticas orçamentárias em empresas hoteleiras dos
prin-cipais centros turísticos do Brasil. A justificativa se orienta na quantidade de turistas estrangeiros recebidos pelos dez principais destinos turísticos brasileiros, que atinge 95% do país. Outra motivação é a carência de pesquisas em em-presas hoteleiras nos países em desenvolvimento, devendo ser considerado também que o Brasil sediará a Copa do Mundo em 2014 e os Jogos Olímpicos em 2016, o que requer uma estrutura hoteleira adequada para receber um grande número de atletas e turistas. Assim, para atingir o objetivo deste estudo, foram enviados questionários aos hotéis associados à Associação Brasileira da Indústria de Hotéis (ABIH), recebendo retorno de 40 empresas hoteleiras. A estatística descritiva foi aplicada sobre os resultados, com a finalidade de melhorar a base das discussões. Os resul-tados apontam que a maioria dos hotéis adota o orçamento empresarial, tendo o bottom-up como processo orça-mentário predominante. A pesquisa mostra que os orçamentos são elaborados, com maior frequência, utilizando-se os resultados de anos anteriores e indicadores econômicos. Na avaliação de desempenho, são frequentemente apli-cadas a análise comparativa, a análise das causas dos desvios e as medidas de adequação. A análise das variações estão principalmente direcionadas para o controle dos custos/despesas, a identificação de problemas potenciais e o fornecimento de feedback para o próximo período.
Palavras-chave: Orçamento. Planejamento. Execução. Controle. Hotel.
Abstract: This study aims to explore the budgeting practices in the hotel companies of Brazil’s main tourist centers.
The justification is oriented by the number of foreign tourists received by the top ten Brazilian tourist destinations, which reaches 95% of the country. Another motivation is the lack of research on hotel companies in developing coun-tries, and it should also be considered that Brazil will host the World Cup in 2014 and the Olympic Games in 2016, which requires a suitable hotel structure to receive a large number of athletes and tourists. Thus, in order to achieve the purpose of this study, surveys were sent to the hotels associated with the Brazilian Association of the Hotel Indus-try (ABIH), with replies by 40 hotel companies. Descriptive statistics were applied to the results, in order to improve the basis for discussions. The results indicate that most of the hotels adopt corporate budgeting with bottom-up as main budgeting process. Research shows that budgets are developed, more frequently, using the results from previ-ous years and economic indicators. In the performance evaluation, the comparative analysis, the analysis of the caus-es of deviations and adequacy measurcaus-es are often applied. The analysis of variance is primarily directed at controlling costs/expenses, identifying potential problems and providing feedback for the next period.
Keywords: Budget. Planning. Execution. Control. Hotel.
1 Universidade Federal de Santa Catarina – UFSC Mestre em Contabilidade (PPGC/UFSC) - Contadora (CRC/SC
37.543/O-5) pauladesouza1604@gmail.com.
2 Universidade Federal de Santa Catarina – UFSC- Doutor em Engenharia de Produção pela Universidade Federal de
Santa Catarina (2003). Pós-doutor pela Universidad de Valéncia-Espanha (2011). Atualmente é docente do Programa de Pós-graduação em Contabilidade da Universidade Federal de Santa Catarina. rogerio.lunkes@ufsc.br.
380 Revista Brasileira de Pesquisa em Turismo. São Paulo, 9(3), pp. 380-399, set./dez. 2015.
Resumen: Este estudio tiene como objetivo explorar las prácticas presupuestarias en las empresas hoteleras de los
principales centros turísticos de Brasil. La razón fundamental se orienta en el número de turistas extranjeros recibidos por los diez destinos turísticos brasileños, que alcanza el 95 % del país. Otra motivación es la falta de investigación en la industria hotelera en los países en desarrollo y se debe considerar también que Brasil será sede de la Copa del Mundo en 2014 y los Juegos Olímpicos de 2016, que exige una adecuada infraestructura hotelera para recibir un gran número de atletas y turistas. Por lo tanto, para lograr el objetivo de este estudio, se enviaron cuestionarios a los hoteles asociados a la Asociación Brasileña de la Industria Hotelera (ABIH), la recepción de retorno de 40 empresas hoteleras . Estadística descriptiva se aplicaron a los resultados con el fin de mejorar la base para la discusión. Los resultados muestran que la mayor parte del negocio de hoteles adopta presupuesto con la de abajo hacia arriba como el proceso presupuestario predominante. La investigación muestra que se desarrollan los presupuestos, con más frecuencia, el uso de los resultados de años anteriores y los indicadores económicos. En la evaluación del desempeño, a menudo se aplica a un análisis comparativo, el análisis de las causas de las desviaciones y la adecuación de las medidas. El análisis de las variaciones se dirigen principalmente a controlar los costos/gastos, identificar problemas potenciales y proporcionar información para el próximo período.
Palabras clave: Presupuesto. Planificación. Ejecución. Control. Hotel.
1 INTRODUCTION
The budget is seen as the “backbone” of organizations in measuring performance (Jones, 2008a). Furthermore, it is considered one of the mechanisms most employed by managers in con-trolling costs and improving performance (Kin; Clarkson & Wallace, 2010) as well as operations management (Szychta, 2002; Abdel-Kader & Luther, 2006; Uyar, 2009; Sivabalan et al.,2009; Libby & Lindsay, 2010).
Even with great use in business, often budgeting is also criticized. Some authors argue that budget problems are related to the way it is used (Horngren; Foster & Datar, 2000), while others affirm that budgetary processes are essentially flawed (Hope; Fraser & Rosen, 2003; Hansen; Otley & Van Der Stede, 2003). For Jones (2008a), these affirmations present different aspects, but also share many of the concerns inherent to corporate budget. Nevertheless, this budget continues to be widely used in organizations (Jones, 2008a; Uyar & Bilgin, 2011, Castro et al., 2012).
If there is anything in common in these debates is the perceived need to make the most ef-fective and efficient budgeting process in organizations, seeking more benefits (Uyar & Bilgin, 2011). This gain in efficiency can be gained from changes in the forms and practices applied to planning, execution and control of the budget. Research by Umapathy (1987) and King, Clarkson & Wallace (2010) confirmed that successful companies, in fact, adopted some practices that made their budget systems more effective. Among the practices highlighted in the studies are the gen-eration of commitment, the alignment between levels of the organization, the adoption of de-tailed and comprehensive procedures in the preparation and analysis of variations, and taking cor-rective actions.
The important point is that there is a need to improve the efficiency of the budgeting pro-cess, in order to obtain more benefits (Uyar & Bilgin, 2011). Although the budget is often studied (Castro et al., 2012), due to its practical importance, it needs to be researched more widely, espe-cially in the service sector (Uyar & Bilgin, 2011).
381
Recent studies highlighted the lack of research on budgeting practices in hotel companies (Steed & Gu, 2009; Uyar & Bilgin, 2011), especially in developing countries such as Brazil. Further-more, the hotel industry is one of the most important in the service sector in many countries, in-cluding Brazil, which in 2012 received 5.67 million foreign tourists, surpassing the marks of 5.4 million in 2011 and 5 2 million in 2010, representing 5% of the national GDP. The services better evaluated by them were hospitality (97.7%), food (95.5%) and accommodation (93.2%) (Ministry of Tourism, 2013).
In this sense, in order to achieve the goal of exploring the budgeting practices in the hotel industry of the main tourist centers of Brazil, the questionnaire was based on several previous studies in the United States (Schmidgall & DeFranco, 1998; Steed & Gu, 2009) , the United States and Scandinavia (Schmidgall; Borchgrevink & Zahl-Begnum, 1996), the United Kingdom and the United States (Jones, 1998; Jones, 2008a, b), Australia (Subramaniam; McManus & Mia, 2002; Winata & Mia, 2005) China (Yuen, 2006), Greece (Pavlatos & Paggios, 2009) and Turkey (Uyar & Bilgin, 2011).
The top ten tourist destinations - Rio de Janeiro (RJ), Florianópolis (SC), São Paulo (SP), Sal-vador (BA), Foz do Iguaçu (PR), Balneario Camboriu (SC), Porto Alegre (RS), Recife ( PE), Fortaleza (CE) and Buzios (RJ) - are the subject of this study and together receive 95% of foreign tourists in the country (Ministry of Tourism, 2010). These data show the importance of such tourist centers for Brazil and, therefore, deserve to be studied.
Another motivation is the lack of research on hotel companies in developing countries, and it should also be considered that Brazil will host the World Cup in 2014 and the Olympic Games in 2016, which requires a suitable hotel structure to receive a large number of athletes and tourists.
2 LITERATURE REVIEW
2.1 Planning and Budget Preparation
The budget manual includes the guidelines, goals, targets and indicators agreed by senior management. The study by Uyar & Bilgin (2011) on hotel companies in Turkey reveals that 63% prepare budget manuals, which corroborates the research by Steed & Gu (2009), who noted the establishment of the budget guidelines by senior management in an average 4.5 points on a scale of one to five.
Among the type of indicator used, Schmidgall, Borchgrevink & Zahl-Begnum (1996) found that 58.5% and 52.5% of the hotels in Scandinavia and the United States set a financial goal. In Scandinavian hotel companies, the most important financial goal is net income for 51.5% of the hotels, the return on owner’s equity for 15.5%, the cash flow for 6.1%, and some other financial objective for 27.2%. These other financial goals include the gross operating income necessary to cover the cost of capital investment profits. In hotels in the U.S., the most important financial goal is net income for 65%, cash flow for 16.7% and some other financial goal for 11.7% of hotel
com-382
panies. Thus, it can be seen that for both groups of hotels, net income is clearly the number one priority.
The budget committee is a committee formed to guide the planning, implementation and control process, and may include owners, directors and general managers, chief financial officer, department heads, controller and so on. The results of the study by Uyar & Bilgin (2011) showed that 87% have a budget committee. The coordinator responsible for the preparation of the budget in the United States, according to Schmidgall, Borchgrevink & Zahl-Begnum (1996), is the control-ler in 67.8%, the general manager in 26.4%, assistant manager in 12.5% and others in 3.3% of cas-es. Now in Scandinavia, the main responsible is the general manager in 57.4% of the hotels, the controller in 33.3%, assistant manager in 1.9% and others in 7.4%.
Moreover, the research by Uyar & Bilgin (2011) in Turkey found that 65% of participants of the committee were general managers, 61% controllers or accounting managers, 39% managers and financial officers, 31% marketing managers, 22% personnel managers and 8% others. The av-erage number of participants is 3.09 people per committee.
The time of preparation of the budget relates to the period to draw up the budget process. In research conducted by Uyar & Bilgin (2011), most companies, about 80%, take around one to two months to prepare their annual budget. The study by Steed & Gu (2009) revealed that 15% of hotels in the United States spend less than 40 hours, 27.5% between 40 and 80 hours, 27.5% be-tween 81 to 120 hours and 30% take over 120 hours .
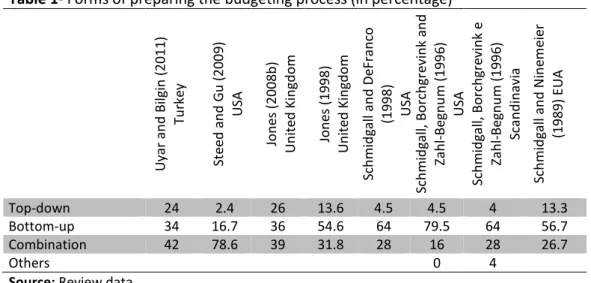
The forms of budgeting may involve mainly three types: top-down and bottom-up combi-nation. In top-down, the budget is prepared by senior management and imposed on other mem-bers of the organization. In bottom-up, the budget is prepared by the responsible centers or de-partments and submitted to senior management for approval. In combination, the budget is pre-pared through an interactive process between responsible centers and senior management. Table 1 presents the main forms of budgeting in different studies.
Table 1- Forms of preparing the budgeting process (in percentage)
Uy ar a nd B ilgi n ( 2011) Tu rk ey St ee d a nd G u ( 20 09 ) US A Jo ne s ( 2008b ) Un ite d K in gd om Jo ne s ( 1998 ) Un ite d K in gd om Sch m id ga ll a nd De Fr an co (1998) US A Sch m id ga ll, B or ch gr ev in k a nd Za hl -B egn um (199 6) US A Sch m id ga ll, B or ch gr ev in k e Za hl -B egn um (199 6) Sca nd in av ia Sch m id ga ll a nd N in em ei er (1989) E UA Top-down 24 2.4 26 13.6 4.5 4.5 4 13.3 Bottom-up 34 16.7 36 54.6 64 79.5 64 56.7 Combination 42 78.6 39 31.8 28 16 28 26.7 Others 0 4
Source: Review data
One of the most important forecasts of budgeting is the revenue. Among the main areas of
383
study are the basis for establishing revenue growth.
The study by Steed & Gu (2009) showed that in 64.3% of hotel companies, the value indi-cated by the hotel owner was the most important influence in the guidelines for increasing reve-nue. Among the bases for such an increase, stand out REVPAR or increased percentage with 54.8%, percentage of increase over the previous year with 52.4%, based on ADR and occupancy percentage with 35.7%, respectively, improving the competitive set with 31%, another factor with 6.2% or the inflation forecast with 4.8%. The study by Jones (2008a) made in the UK showed the data of the previous year (historical operating data) between the information most commonly used to set the annual budget. This study also showed a change in national economic indicators (Jones, 1998), to a greater emphasis on local and regional economic indicators.
In the study by Schmidgall, Borchgrevink & Zahl-Begnum (1996), approximately 91% of American hotels and 88.7% Scandinavian hotels use information from their operating history to project the sales estimates. For U.S. hotels, the most common factor is the local and regional eco-nomic indicators, used by 73.6%, while only 49.1% of Scandinavian hotels use this factor to fore-cast sales. Another observation is related to the use of information on planning advertising and promotions by 46.3% of U.S. hotels and only 24.5% in Scandinavia. The perceived impact on price changes corresponds to 45.1% and 54.7%, information on national economic level is used at 43.8% and 54.7%, operational changes suggested by the administrative level at 40.5% and 18.9%, the impact of expansion (new units) at 29.8% and 32.7%, and other factors at 13.2% and 15.1% of ho-tels in the United States and Scandinavia, respectively.
The budget period corresponds to the duration or cycle of the budget process. Empirical studies indicate that approximately 74.5% of hotel companies in Turkey (Uyar & Bilgin, 2011) and 98.8% of Greece (Pavlatos & Paggios, 2009) prepare the budget for one year. Similarly, 91% of UK hotels set the budget for a period of one year, 4.5% for six months and 4.5% for 12 months con-tinuously (continuous budget) (Jones, 1998). In a sequential study by Jones (2008a), the vast ma-jority of organizations use the budget for a period of 12 months, usually considering the fiscal year.
The budget may require revisions over the period due to changes in economic and envi-ronmental conditions considering the fiscal year. The hospitality industry may be particularly sen-sitive to local changes and seasonal fluctuations, for example, weather, terrorist attacks, economic crises, political instability etc.
Just over 70% of U.S. hotels are reviewing their budgets compared to 44% in Scandinavia (Schmidgall; Borchgrevink & Zahl-Begnum, 1996). The review process begins in less than three months into the fiscal year in nearly 62% of U.S. hotels and a third of Scandinavia. Three to five months for 21.4% and 45.8%, six to nine months for 9.5% and 20.8% in the United States and Scandinavia, respectively, and over nine months for 1.2% of hotels in the United States.
Next, Schmidgall & DeFranco (1998) found that in the United States, 21% conduct the budget review when needed, 40% monthly, 3% bimonthly, 16% quarterly, 12% semiannually and 4% in other periods. This corroborates in part with the study of Uyar & Bilgin (2011) in Turkey,
384
diagnosing that 48% prepare their budget quarterly and 29% every six months.
Jones (1998) found that in the UK 80% of hotel companies reviewed the budget, most monthly or quarterly, which corroborates the sequential study by Jones (2008a), which showed statistically that the hospitality industry eventually makes revisions, although this process was not performed routinely, with only 16% of organizations making revisions to their processes annually.
The results found by Schmidgall, Borchgrevink & Zahl-Begnum (1996) suggest that budgets are reviewed at a relatively high level in Scandinavia, with 28% being reviewed at the corporate level and only 3.5% in U.S. hotels. In the U.S., 68% of operating budgets were revised monthly, compared with 16% in Scandinavia. The most common response from Scandinavia was that budg-ets are revised when performance indicates a need, for 52% of hotels, and for 12% in the United States.
Schmidgall, Borchgrevink & Zahl-Begnum (1996) found that the management level respon-sible for the budget review can highlight the level of the hotel with 75.3% in the United States and 52.0% in Scandinavia. Other results showed that the corporate level corresponds to 3.5% and 28.0%, level between the corporation and the hotel 7.1% and 0%, department level (within the hotel) of 12.9% and 12%, and others 1.2% and 8% in the USA and Scandinavia, respectively.
The budget review is used to identify corrective action problems (87.2% and 54.2%), gen-eration of new projections for the year end results (73.3% and 70.8%), performance measurement (50% and 12.5%) and review of pricing plans (15.1% and 8.3%), in the United States and Scandina-via, respectively. When the budget is reviewd, all Scandinavian hotel respondents indicated that it was reviewed for the rest of the year, while 61% in the U.S.. In the U.S., 15% of the hotels review the budget only for the next month, and the remaining for another period, such as bimonthly and quarterly.
The budget report period includes the time involved in the generation of reports for moni-toring results. The study by Uyar & Bilgin (2011) indicates that 92.5% of companies generate monthly reports. The research by Schmidgall, Borchgrevink & Zahl-Begnum (1996) confirms the trend that U.S. hotel companies prepare their budget processes in 76% for five or more years. The Scandinavian hotel companies indicated that 29.6% also prepare the budget for five or more years. The most frequent response from Scandinavia was for a period of three years by 33.3% and another 22.2% for two years.
Additionally, the findings by Schmidgall, Borchgrevink & Zahl-Begnum (1996) show that for the hotels which drew up the budget process for one year, it begins two months prior to the new budget period in 5% of hotel companies in the United States, 20 % three months prior, 29.2% four months, 27.5% five months and 18.3% six or more months. In Scandinavia, 9.1% start one month earlier, 12.7% two months, 34.5% three months, 20% four months, 16.4% five months and 7.3% six or more months.
Among the items included in the budget package, capital expenditures were mentioned by 87.8% as the most used, review of the competition (82.9%), marketing plan (80.5%), full-time em-ployees and equivalents (70.7%), salaries of the administration (68.3%), salary survey (36.6%) and
385
other (17.1%) (Steed & Gu, 2009).
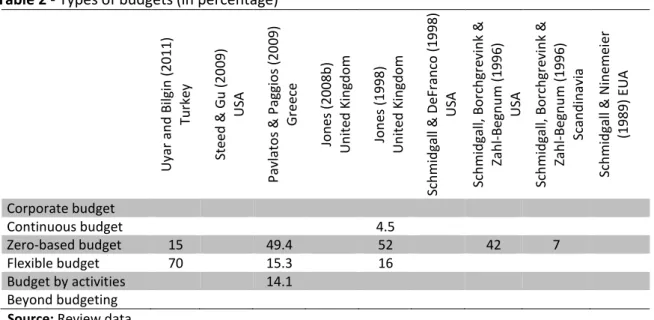
Among the types of budget, the highlights are zero-based budget, flexible budget, budget-ing by activities and beyond budgetbudget-ing. Table 2 presents the results of empirical studies in hotel businesses in different parts of the world.
Table 2 - Types of budgets (in percentage)
Uy ar a nd B ilgi n ( 2011) Tu rk ey St eed & G u ( 20 09 ) US A Pa vl at os & P aggi os (20 09) Gr eec e Jo ne s ( 2008b ) Un ite d K in gd om Jo ne s ( 1998 ) Un ite d K in gd om Sch m id ga ll & De Fr an co (19 98) US A Sch m id ga ll, B or ch gr ev in k & Za hl -B egn um (199 6) US A Sch m id ga ll, B or ch gr ev in k & Za hl -B egn um (199 6) Sca nd in av ia Sch m id ga ll & N in em ei er (1989) E UA Corporate budget Continuous budget 4.5 Zero-based budget 15 49.4 52 42 7 Flexible budget 70 15.3 16 Budget by activities 14.1 Beyond budgeting
Source: Review data
The zero-based budget is not used routinely in the UK hotel industry. Among the reasons cited it is noteworthy that the hotel business was seen as relatively static and predictable, espe-cially at the unit level (Jones, 2008a).
For the preparation, execution and control of the budget, the hotel could use Excel or their own software. In Turkey, approximately 78.5% of the companies use Microsoft Excel, 14% use an-other software and 6.5% use Microsoft Excel and anan-other software (Uyar & Bilgin, 2011). Moreo-ver, Steed & Gu (2009) describe that the technology used in the budget in the United States in-cludes spreadsheets and transmission in 71.4% of the hotels, corporate intranet in 16.7% and oth-ers in 11.9%.
Long-term planning can be prepared for different periods. Uyar & Bilgin (2011), in their study conducted in Turkey, found that 21.5% use a period of three years, 26.5% of five years and 12.5% over five years.
2.2 Budget Execution
In implementing the budgetary process, some items have a direct relationship with per-formance. Research conducted by Uyar & Bilgin (2011) questioned the following items: the budget is done in secret by top management (3.78), effective leadership is provided in the budget process (4.57), a good flow of information is available for the budget (4.54), coordination between de-partments is easily achieved (4.22), goals are determined first in the dede-partments and then
sub-386
mitted to top management (3.67), goals are determined by top management and then opinions are collected in the departments (3.35) and targets are determined rationally (4.29).
In preparing the budget process, the organization may have different purposes or specific objectives. The study by Jones (1998) conducted in the UK pointed out as specific purposes of the budget: assist in long-term planning with 68%, assist in short-term planning, with 59%, evaluate performance with 93%, coordinate operations with 52%, motivate managers with 77%, communi-cate plans to employees with 52% and assist in control with 89%. To Pavlatos & Paggios (2009), in Greece, the purposes highlighted are in control of costs with 91.8%, coordination activity of the various parts of the organization with 80% and the performance evaluation of managers appoint-ed by 64.7% hotels.
To Uyar & Bilgin (2011), among the purposes of the budget the highlights are expenditure control (4.61), profitability (4.52), assist in long-term planning (4.47), assist in short-term planning (4.34), evaluate the performance (4.29), coordinate operations (4.43), motivate employees (3.81), motivate managers (4.04), communicate plans to employees (3.61). Similarly, for UK hotels, budg-ets were seen as an operational tool to help managers control operations and keep costs low (Jones, 2008a).
Other purposes can be highlighted as future predictions, maximization of results, introduc-tion of new products and services, planning, control and valuaintroduc-tion of the result, and the creaintroduc-tion of incentives and rewards.
For budgeting, information can be used from different sources such as results from previ-ous years, statistics and indicators of the industry, market analysis, national, regional and local economic indicators and projections from previous years. To Uyar & Bilgin (2011), results from previous years (4.57), statistics and indicators of the industry (4.45), market analysis (4.39), na-tional economic indicators (4.29), local and regional economic indicators (4.19), budgeted figures for previous years (4.25) are the most used.
Schmidgall, Borchgrevink & Zahl-Begnum (1996) found in their study that the information suppliers for budgeting in the United States and Scandinavia were the accounting department, with 68.0% and 21.8%, controller with 67.2% and 60.0%, general manager with 51.6% and 29.1%, assistant manager with 14.8% and 5.5%, others with 11.5% and 12.7% share, respectively.
For the successful use of the budget, one must also consider the human aspects. Yuen (2006) researched in hotels in Macau, China, the effects related to employee satisfaction and par-ticipation in the participatory management of the budget process. Among the results of the study is the finding that the greater participation of employees increases responsibility and experiences.
The study by Steed & Gu (2009) in the United States pointed out that performance bonuses are directly linked to achievement of budget targets (4,4). Other aspects were questioned, such as whether budgetary guidelines were applied to all properties (4.4), whether the budget was used as a standard for performance evaluation (4.1), whether the budget was tied to the strategic plan (3, 7) and whether property managers sought the lowest possible goals (3.3).
The results found by Uyar & Bilgin (2011) in hotels in Turkey corroborate the American
387
findings, where the performance bonuses should be linked to the achievement of their budget goals (3.87). Moreover, managers should have clearly defined authority and responsibility for indi-vidual control of the budget to work effectively (4.58), participation is key to accept their budgets and consider them attainable (4.45), avoid the so-called “gamesmanship” in which managers try to underestimate revenues and overestimate costs (4.29), the motivation may also be in budgets that are achievable, but difficult to achieve (4.4), and participation in the budget process is critical when budgets are used as a performance measure (4.36).
2.3 Budget Control
In control of the budget process specific criteria or points may be used, such as benchmark-ing or else not usbenchmark-ing reference points. For those usbenchmark-ing reference points, this can be done in the form of monetary value, a percentage or repetition of an adverse variable.
While 91% of Turkish hotels said they use benchmarking, approximately 4% do not use ref-erence points and 5% did not answer the question. The most commonly used refref-erence was mon-etary value with 77%, followed by percentage with 69.5% and repetition of an adverse variable with 26.5% (Uyar & Bilgin, 2011).
In the United States and Scandinavia, the results, according to Schmidgall, Borchgrevink & Zahl-Begnum (1996), are compared with the original budget at 92.4% and 72%, with the actual data of the previous year at 86.4% and 60%, with the budget revised at 45.8% and 30%, based on expenditures and sales mix values at 25.4% and 46%, and other factors at 1.7% and 10% of the hotels, respectively.
In budgetary control, an important point is the role that monitoring has on the manage-ment system of the organization. To Uyar & Bilgin (2011), the majority of companies surveyed said that the budget is the key performance indicator (47%), followed by being one of the few key per-formance indicators (37.5%) and being little used as a perper-formance measure (10%).
Among other roles of the budget in control, it can be seen as the primary performance in-dicator or as one of the few key inin-dicators used. A study conducted in the UK by Jones (2008a) found that a major reason for the use of the budget is to measure the performance, since the ho-tels indicated that it was seen as the main or one of the few key performance indicators.
To perform this monitoring, different criteria can be used in performance assessment. The study by Uyar & Bilgin (2011) pointed out that the results of previous years are used in 72% of Turkish hotels, budgeted figures and industry statistics both with 53%, inter-hotel comparisons with 13% and balanced scorecard and comparisons with competitors with 16%.
The control requires as input components the appointment of those responsible for as-sessing the variances of budget reports. Uyar & Bilgin (2011) researched this point and demon-strated that the general manager with 53% and top administration with 41% were the main re-sponsible, next were the heads of departments with 28%, and the budget committees with 33%, in addition to other people responsible with 11%.
388
From the comparative analysis of what are the purposes of the analysis of budget vari-ances, hotel companies of Turkey indicated that they were: evaluate the performance of the man-ager (4.09), evaluate the predictive capability of the person responsible (4.26), control costs and expenses (4.56), timely recognition of a problem (4.55), and feedback to the budget for the next period (4.39) (Uyar & Bilgin, 2011).
U.S. respondents reported 97%, while 93% of Scandinavians use budget for control purpos-es. In the U.S., 72% of hotel managers are responsible for costs and, in Scandinavia, this number accounts to 65% (Schmidgall; Borchgrevink & Zahl-Begnum, 1996).
3 METHODOLOGY
This research focuses on the positive theory developed for budgeting in hotels, and such detailed specific subsections of the research (analysis of content, practical research and practical qualitative research) are not widely covered in this article (Jones, 2008).
The number and geographic dispersion of the hotel companies in Brazil have led to selec-tion of tourist destinaselec-tions. To this end, a survey was conducted in tourist centers, which include the major sites that attract foreign tourists.
The survey applied was developed from the fundamental characteristics identified in the literature review (Schmidgall & Ninemeier, 1987 and 1989; Schmidgall et al., 1996; Schmidgall & DeFranco, 1998; Jones, 1998, 2008a and 2008b; Subramaniam et al., 2002; Winata & Mia, 2005; Yuen, 2006 and 2007; Pavlatos & Paggios, 2009; Steed & Gu, 2009; Uyar & Bilgin, 2011).
From these characteristics the research questions were developed. The application of the survey was conducted in two stages: the first involved the characterization of the hotels located in the tourist centers, including 9 questions; the second involved 15 questions about budget plan-ning, 4 topics regarding the implementation of the budget, using the Likert scale, and 7 objective questions about the assessment and management of organizational performance.
The initial population consists of hotel companies of the tourist centers - Rio de Janeiro (RJ), Florianópolis (SC), São Paulo (SP), Salvador (BA), Foz do Iguaçu (PR), Balneario Camboriu (SC), Porto Alegre (RS), Recife (PE), Fortaleza (CE) and Buzios (RJ) - associated with the ABIH (Brazilian Association of Hotel Industry), for a total of 332 hotels.
For the application of the survey, the first contact with the hotels was made by telephone. If companies were willing to contribute to research, the survey was sent via email to those respon-sible for the process to collect the information. In this first stage, 264 hotels provided an e-mail address for sending the survey, but 23 were duplicates, and 15 refused to answer. 40 completed surveys were obtained.
4 RESULTS OF THE STUDY 4.1 Characterization of Hotels
389
To characterize Brazilian hotels, questions were asked about the category of the organiza-tion, which included the following: 5 stars, 4 stars, 3 stars, other and unrated. Furthermore, we questioned the designation used by hotels.
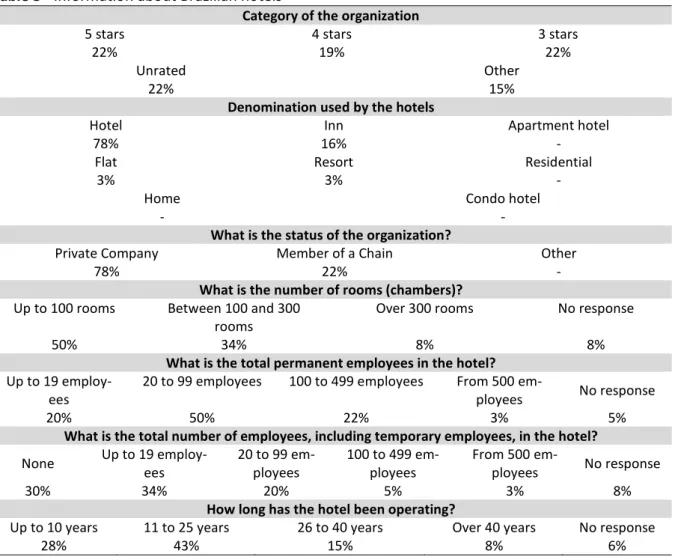
From Table 3, the existence of all categories in the sample can be seen, with low preva-lence of one specific category. This is because there are 22% with 5 stars, 3 stars and unrated. There are still 15% with other categories, such as luxury and charm.
Table 3 - Information about Brazilian hotels
Category of the organization
5 stars 4 stars 3 stars
22% 19% 22%
Unrated Other
22% 15%
Denomination used by the hotels
Hotel Inn Apartment hotel
78% 16% -
Flat Resort Residential
3% 3% -
Home Condo hotel
- -
What is the status of the organization?
Private Company Member of a Chain Other
78% 22% -
What is the number of rooms (chambers)?
Up to 100 rooms Between 100 and 300
rooms Over 300 rooms No response
50% 34% 8% 8%
What is the total permanent employees in the hotel?
Up to 19
employ-ees 20 to 99 employees 100 to 499 employees From 500 em-ployees No response
20% 50% 22% 3% 5%
What is the total number of employees, including temporary employees, in the hotel?
None Up to 19 employ-ees 20 to 99 em-ployees 100 to 499 em-ployees From 500 em-ployees No response
30% 34% 20% 5% 3% 8%
How long has the hotel been operating?
Up to 10 years 11 to 25 years 26 to 40 years Over 40 years No response
28% 43% 15% 8% 6%
Source: Prepared by the authors based on the surveys
Regarding the name used by the companies, it can be seen that over 70% of respondents use the nomenclature “hotel”. The denomination “inn” was the second most used, representing 16% of the sample. The study showed the absence of apart-hotels, residential, home and condo hotel.
It appears that most of the organizations surveyed is incorporated as a private company, comprising a percentage of 78% of the total. The hotels that belong to a chain comprise the other 22%.
390
It can be seen that hotels mostly have a capacity of hosting up to 100 rooms, 34% of them have between 100 and 300 rooms, while only 8% have more than 300 rooms.
Therefore, this information reflects the number of constant employees in each organiza-tion, with or without hiring temporary employees. Thus, it appears that due to the dominance of a small number of rooms, 34% of hotels have up to 19 temporary employees. Only 3% of the sample reported having more than 500 permanent employees.
Moreover, it can be seen that 43% of the selected hotels have between 11-25 years of ex-perience in the hotel business, while only 8% claim to have it open for operation for over 40 years. Table 4 allows to visualize the average occupancy rate of hotels in Brazil in the range from 20% to 95%, and the approximate amount of beds in each company.
Table 4 - Average occupancy rate and number of beds
Average occupancy rate of the hotels in the sample
80% to 95% 65% to 79% 55% to 64%
16% 23% 38%
45% to 54% 35% to 44% 20% to 34%
10% 10% 3%
Number of beds in Brazilian hotels
12 to 40 beds 40 to 80 beds 80 to 150 beds
9% 18% 13%
150 to 300 beds 300 to 900 beds Over 900 beds
34% 23% 3%
Source: Prepared by the authors based on the surveys
The average occupancy rates show that there is a wide variation, from 20% to 95%. Most hotels are in the average occupancy rate from 55% to 64%. Only 3% of hotel companies reported having reduced occupancy from 20% to 34%.
Most hotels (34%) reported having between 150 and 300 beds in their structure, followed by 23% hotels with 300 to 900 beds and 18% with 40 to 80 beds. There was great diversity as to the response to the amount of beds, so that all options were met, including that which indicates the amount above 900 beds, confirmed by only one hotel in the sample.
4.2 Budget Planning
The results from this item are related to the first stage of the budget process, namely, budget planning. In Table 5 are presented different questions applied to hotels related to that step. First, it is noted that 65% of the hotels in the sample said they did not use a guide for prepar-ing the budget.
As for the program used to prepare the budget process, 35% reported using only the Mi-crosoft Excel tool, another 35% use another tool besides Excel and only 5% use only the corporate internet. Similarly, in Turkey, 78% of businesses use Microsoft Excel and 6.5% use Microsoft Excel and another software (Uyar & Bilgin, 2011), while in the United States 71% use spreadsheets and transmission and 16.7% the corporate internet (Steed & Gu, 2009).
391
It appears that hotel companies do not usually create a budget committee, since 45% of the respondents have one. On the other hand, in the region of Antalya, in Turkey, the committee and budget manual are common in hotels, according to Uyar & Bilgin (2011).
Additionally, it is identified that the time spent preparing the budget is usually short, in-volving less than 40 hours in 40% of the hotels. Only 13% reported using 81-120 hours and 13% over 120 hours for preparation.
Table 5 - Characteristics of the budget process
Does the hotel use a “budget manual” for the preparation of the budget process?
Yes No
35% 65%
Which program (software) or technology is used by the hotel in the preparation of the budget process?
Microsoft Excel Corporate Internet Microsoft Excel and another software Other
35% 5% 35% 25%
Does the hotel have a budget committee?
Yes No
45% 55%
How many hours are needed to prepare and review the budget?
Less than 40
hours 41 to 80 hours 81 to 120 hours Over 120 hours No response
40% 25% 13% 13% 9%
How is the budgetary process prepared?
Bottom-up (prepared by
operational centers) Top-down (prepared by senior management) Combination/Participatory (joint development) Other sponse No
re-40% 25% 18% 5% 12%
What is the frequency of budget reports?
Monthly Semiannual Annual Other No response
58% 5% 10% 18% 9%
What method or type of budget does the hotel use?
Corporate
budget Flexible budget Continuous budg-et Zero-based budget Other No response
42% 13% 23% 3% 10% 9%
For what time horizon is the budget prepared?
1 month 3 months 6 months 1 year Other No response
8% 8% 8% 58% 8% 13%
Does the budget suffer any kind of review within this period?
Monthly Quarterly Semiannually Other No response
22% 25% 18% 20% 15%
Does the hotel make changes resulting from the volume - flexible budget?
Yes No No response
38% 53% 9%
Does the hotel prepare and practice the strategic budget?
Prepares and
imple-ments Prepares but does not imple-ment Does not prepare No response
47% 15% 25% 13%
If yes, what is the strategic planning horizon?
1 year 3 years 5 years Over 5 years Does not apply
50% 3% 3% 13% 38%
Source: Prepared by the authors based on the surveys
The budgeting process in the Brazilian hotel industry is primarily prepared in bottom-up
392
(40%), top-down (25%) and combination/participatory (18%). These results corroborate those found by Schmidgall & Ninemeier (1987) and by Schmidgall, Borchgrevink and Zahl-Begnum (1996), in the United States and in Scandinavia, respectively, where the bottom-up practice is also used by the large majority.
In contrast, Uyar & Bilgin (2011) observed differences in Turkey, as Steed and Gu (2009) obtained the same conclusion in the United States, that most hotels use the combina-tion/participatory approach.
In general, Brazilian hotels use corporate-type budget, with 42% of the sample, prepared for the period of 1 year (58%). Just as Schmidgall & DeFranco (1998) in the United States, Jones (1998) in the UK, Uyar & Bilgin (2011) in Turkey, it was also found that most hotels prepare the budget for the period of 1 year.
Also in relation to budget types, the results show low use of methods such as zero-based and flexible budgeting. Compared to studies by Jones (1998 and 2008b) conducted in hotels in the UK, where the flexible budget is little used, the zero-based budget is applied to half of the compa-nies surveyed, decreasing slightly in the second study. Likewise, Pavlatos & Paggios (2009) con-ducted studies in Greece and found that the use of zero-based budget is significant, while the ap-plication of the flexible budget and activities is quite low.
With respect to budget review, the results were distributed among the alternatives. But 25% are revised quarterly, 22% monthly and 18% every six months. Furthermore, 53% of respond-ents reported not making changes resulting from the volume, while 38% make adjustmrespond-ents due to variations in occupancy levels. Also according Uyar & Bilgin (2011) in Turkey and Jones (1998 and 2008b) in the UK, the revisions are in most cases quarterly.
As for strategic budget, it is made by 62% of the hotels, with 47% preparing and imple-menting it and 15% only preparing it. For those that prepare the budget, there was a predomi-nance of 50% for a 1 year horizon.
The research shows that the majority of the Committee is comprised of the general man-ager/director of the hotel, with 88%. But in 69% of cases the owners are present, in 56% the finan-cial manager/treasurer, as well as the accounting manager/controller in 50% as part of that Com-mittee.
We note that 47% of the hotels determine the increase in revenue based on the percent-age increase over the previous year. Furthermore, 37% reported having their guidelines based on occupancy rate and only 3% on a statistical method. Steed & Gu (2009) found that in the United States, in addition to the guidelines being based on the percentage increase over the previous year, REVPAR (percentage increase) is also used for the definition of revenue growth.
It can be noted that the most common budget package for hotels is the marketing plan (42%), followed by capital expenditures (37%) and management salaries report (37%). The other features achieved the same percentage of utilization, that is, 21% of the times present in the position. Now in the work by Steed & Gu (2009), capital expenditures (87%), assessment of com-petitors (83%) and the marketing plan (81%) were identified for hotels in the United States as the
393
most common.
4.3 Budget Execution
Among the results obtained in relation to the implementation of the budget, 61% indicate that effective leadership is provided in the budget process and there is a good flow of information, and that 50% of respondents strongly agree that coordination between departments is easily achieved, as presented in Table 6.
Table 6 - Results of budget implementation
BUDGET EXECUTION Disagree Totally Partly Disa-gree Indifferent Partly agree Totally Agree
Budget is considered a secret of
top management 18% 5% 11% 16% 37%
Effective leadership is provided in
the budget process 8% 3% 8% 8% 61%
A good flow of information is
available for the budget - 3% 3% 21% 61%
Coordination between
depart-ments is easily achieved 11% 8% 5% 13% 50%
Goals are determined first in the departments and then submitted
to senior management 42% 5% 18% 11% 11%
Goals are determined by top man-agement and then opinions are
collected in the departments 5% 16% 13% 21% 32%
Goals are the result of a structured process and aligned with the
Stra-tegic Planning 5% - 11% 24% 47%
Information used in the budget
preparation are: Always Almost al-ways Eventually Almost never Never
Results from previous years -
per-formed 50% 13% 5% 3% -
Industry statistics/indicators 24% 13% 11% 3% 16%
Market analyzes 39% 16% 5% 3% 5%
National economic indicators 45% 8% 8% 8% 3%
Figures from previous years 29% 13% 3% - 3%
Local or regional economic
indica-tors 39% 5% 13% 3% 5%
Source: Prepared by the authors based on the surveys
The research shows that for the vast majority of respondents the goals intended with budgeting are to maximize the results, plan, monitor and appraise the results and assist in short-term budget control, which corroborates with the research by Uyar & Bilgin (2011) in hotels in the Antalya region in Turkey.
With regard to the information used in the preparation of the budget, it can be observed that statistical information had a lower utilization in the hotels surveyed. Thus, research shows that budgets are more frequently prepared using the results from previous years and economic
394
indicators.
On the analysis of motivational aspects, it is observed that it is more related to authority, individual manager responsibility and participation in the development and achievement of goals planned with the budget, which reinforces the results found by Umapathy (1987), on practices that make budget systems more effective.
4.4 Budget Control
The results indicate, as shown in Table 7, that few of the hotels surveyed use th tools pro-posed by Benchmarking (8%) in the budget evaluation. The form used is 63% concentrated in ref-erence points that mostly uses the percentage. Similar to the studies by Jones (1998, 2008a, b) carried out in hotel companies in the UK, the results obtained in this study show that the role of the budget in monitoring the actual performance of the organization is the main performance in-dicator.
Table 7 - Budget Control
What criteria are used to assess significant differences between the values achieved and budgeted?
Benchmarking No reference points are used Reference points are used No response
8% 15% 63% 15%
If yes, what form(s) were used?
Monetary value Percentage Repetition of an adverse variation No response
23% 58% - 19%
What is the role of the budget in monitoring the actual performance of the organization?
Key performance indicator One of the few key indicators used in the organization Little used No response
50% 25% 15% 10%
What are the key performance measures used?
Results from
previous years Budgeted values comparisons Inter-hotel the Balanced Scorecard Indicators and goals of Comparisons with competitors Industry statis-tics Other
68% 50% 15% 10% 38% 18% 3%
Who is responsible for examining the variations?
Top management Hotel manager Heads of department Budget committee Controller Other
38% 55% 23% - 15% 8%
Source: Prepared by the authors based on the surveys
Among the key performance measures used are: the results of previous years with 68%, budgeted amounts with 50% and also the comparison with competitors with 38%. Among the re-sponse options, the Balanced Scorecard received the lowest indication (10%), which indicates pos-sibly a lack of knowledge and non-use by managers of this tool for performance evaluation.
As highlighted in the study by Schmidgall, Borchgrevink & Zahl-Begnum (1996), one of the leading practices in relation to the adoption of a budget is to analyze the variations, which will bring to the company the ability to implement corrective actions on the problems detected. For the Brazilian hotel industry, the analysis of variations is aimed potentially to the hotel manager (55%) and top management (39%).
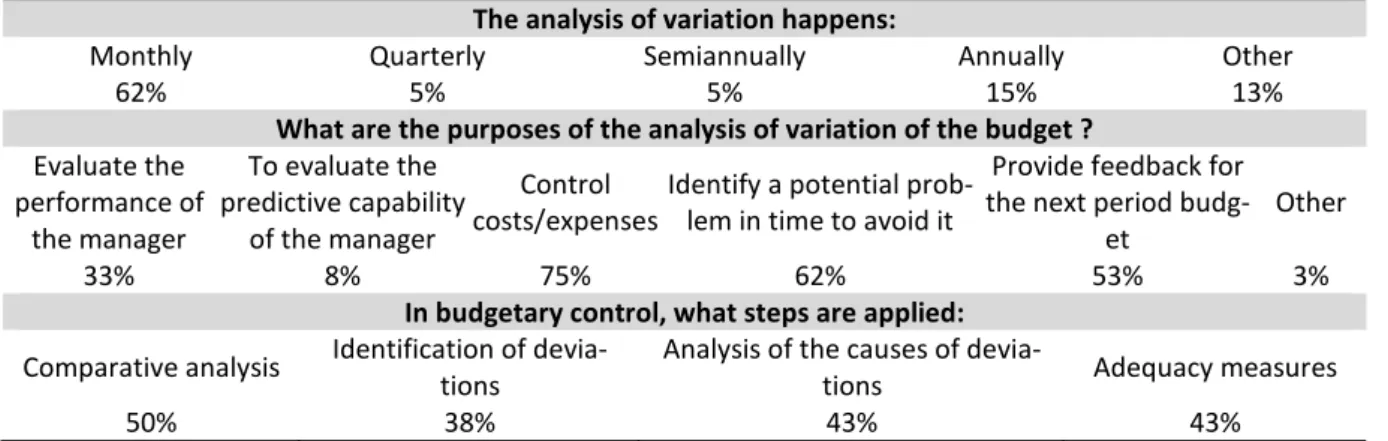
The analysis of variation is done on a monthly basis for 62% of the cases, as presented in Table 8. The goals are directed at controlling costs/expenses (74%), as proved by the research by
395
Schmidgall, Borchgrevink & Zahl-Begnum (1996) in their comparison of hotel companies in the United States and Scandinavia. Other highlights are the identification of a potential problem in time to avoid it and providing feedback to the next period budget, the percentage of agreement being 62% and 53%, respectively.
Table 8 - Analysis of variation
The analysis of variation happens:
Monthly Quarterly Semiannually Annually Other
62% 5% 5% 15% 13%
What are the purposes of the analysis of variation of the budget ?
Evaluate the performance of the manager To evaluate the predictive capability of the manager Control
costs/expenses Identify a potential prob-lem in time to avoid it
Provide feedback for the next period
budg-et Other
33% 8% 75% 62% 53% 3%
In budgetary control, what steps are applied:
Comparative analysis Identification of devia-tions Analysis of the causes of devia-tions Adequacy measures
50% 38% 43% 43%
Source: Prepared by the authors based on the surveys.
With the purpose of budgetary control, the step further applied in hotels of the research is the comparative analysis (50%). The analysis of the causes of the deviations and adequacy measures, both with 43%, also appear as steps very often applied in control.
In closing, it can be noted, as in previous studies in other countries, that in the hotels of this research the budget is widely used as one of the most important tools for managers regarding planning and control (Abdel-Kader & Luther, 2006; Uyar, 2009; Sivabalan et al., 2009; Libby & Lindsay, 2010; Ostergren & Stensaker, 2011; Uyar & Bilgin, 2011).
5 DISCUSSIONS AND CONCLUSIONS
We conclude that the goal of this Article has been reached, considering that the question-naires allowed to explore the budgeting practices in the hotel industry of Brazil’s main tourist cen-ters. It was possible to characterize these hotels as well as analyze the planning, execution and control of the budget.
It was noted that the classification adopted by most hotels is the denomination “hotel”. The “inn” was the second most commonly used nomenclature, representing 16%. Furthermore, 78% of the hotels in the sample are constituted in the form of private company.
It appears that most of the hotels has fewer than 100 rooms per unit and 20-99 employees. Predominantly, respondents reported that hotels have between 150 and 300 beds in one unit.
The budget process most widely used is the bottom-up, which is consistent with the results found by Schmidgall & Ninemeier (1987) in the United States and Schmidgall et al. (1996) in the United States and Scandinavia. In the UK, Jones (2008b) concluded that none of the approaches (bottom-up, top-down and combination/participatory) was predominant. Uyar & Bilgin (2011) and
396
Steed & Gu (2009) observed that in Turkey and the United States, respectively, most hotels use the combination/participatory approach.
Previous studies have provided evidence that the form of budgeting was changing with time, towards a greater participation of employees in the process, although this research conduct-ed in Brazil confirms that there is still a great centralization of the budget process in the top man-agement of the hotel.
It was found that it is not a common practice to create a budget Committee in Brazilian hotels (42%) nor to use a budget manual (32%). However, Uyar & Bilgin (2011) found that, in Tur-key, the committee and budget manual are common in the hotel industry.
With regard to the information used in the preparation of the budget, it can be observed that statistical information had a lower utilization in the hotels surveyed. Thus, research shows that budgets are more frequently prepared using the results from previous years and economic indicators. However, Steed & Gu (2009) realized that in U.S. hotels, the guidelines are based on REVPAR (percentage increase) and the percentage increase over the previous year.
In general, the survey results denote that the budget in hotel companies in Brazil is still un-derutilized, with partial implementation of many of its features and techniques. Still, there is a lack of some of the practices highlighted by Umapathy (1987), which according to the author are key in the implementation of the budget process and adopted by successful companies.
Regarding practical contributions of this study, several aspects that can improve the budg-eting process in the hotels surveyed were pointed out, such as the creation of a committee, great-er involvement of people and implementation of incentive systems to motivate them.
Although the flexible budget is recommended for use in this market segment, the survey showed that 42% of hotels use the corporate budget. There are discussions on this subject, but corporate budget still remains widely used in organizations (Jones, 2008a; Uyar & Bilgin, 2011), as seen in this and other similar studies.
For further research, it is suggested that budgetary practices from other countries and con-tinents are observed. Additionally, it is recommended to analyze questions about the practices of the capital budget and the environmental performance of hotel companies.
REFERENCES
Abdel-Kader, M., & Luther R. (2006). Management accounting practices in the British drink and food industry. British Food Journal. 108(5), 336-357.
Castro, J. K., Souza P., Santos, G. R., & Lunkes, R. J. (2012). Prácticas presupuestarias aplicadas a las empre-sas hoteleras de Brasil: Un studio en la ciudad de Florianópolis. Estudios y Perspectivas en Turismo. 21, 904-924.
De Waal, A., Hermkens-Janssen, M., Van De Ven, A. (2011). The evolutionary adoption
framework: Explaining the budgeting paradox. Journal of Accounting and Organizational Change. 7(4), 316-336.
397
Embratur. (2013). Instituto Brasileiro de Turismo. Retrieved on 10 november, 2014, <http://www.turismo.gov.br/turismo/o_ministerio/embratur/>.
Hope, J., Fraser, T., & Rosen, C. (2003). Trash the budget. Optimize February. 2, 24-31. Horngren, C. T., Foster, G., & Datar, K. M. (2000). Contabilidade de Custos. LTC, Rio de Janeiro.
Jones, T. A. (1998). UK hotel operators use of budgetary procedures. International Journal
of Contemporary Hospitality Management. 10(3), 96-100.
Jones, T. A. (2008a). Improving hotel budgetary practice-A positive theory model.
International Journal of Hospitality Management. 27(4), 529-540.
Jones, T. A. (2008b). Changes in hotel industry budgetary practice. International Journal
of Contemporary Hospitality Management. 20(4), 428-444.
Libby, T., & Lindsay, R. M. (2010). Beyond budgeting or budgeting reconsidered? A survey of North-American budgeting practice. Management Accounting Research 21: 56-75. King, R., Clarkson, P. M., & Wallace, S. (2010). Budgeting practices and performance in small healthcare businesses. Management Accounting Research. 21(1), 40-55.
Ministry of Tourism. (2010). Dados do turismo brasileiro. Retrieved on 20 october, 2014, <http://www.turismo.gov.br/export/sites/default/turismo/o_ministerio/publicacoes/down loads_publicacoes/Cartilha-Dados_Turismo-15x21-web.pdf>.
Ministry of Tourism. (2013). Estrangeiro que visita o Brasil deseja voltar. Retrieved on
13 november, 2014, <http://www.turismo.gov.br/turismo/noticias/todas_noticias/20130828.html>. Pavlatos, O., & Paggios, I. (2009). Management accounting practices in the Greek hospitality
industry. Managerial Auditing Journal. 24(1), 81-98.
Schmidgall, R. S., Borchgrevink, C. P., & Zahl-Begnum, O. H. (1996). Operations budgeting practices of lodging firms in the United States and Scandinavia. International Journal of
Hospitality Management. 15(2), 189-203.
Schmidgall, R. S., & Defranco, A. L. (1998). Budgeting and forecasting: Current practice in the lodging industry. Cornell Hotel and Restaurant Administration Quarterly. 39(6), 45-51. Schmidgall, R. S., & Ninemeier, J. (1987). Budgeting in hotel chains: coordination and control.
The Cornell Hotel and Restaurant Administration Quarterly. 28(1), 79-84.
Schmidgall, R. S., & Ninemeier, J. (1989). Budgeting practices in lodging and food service
chains: an analysis and comparison. International Journal of Hospitality Management. 8(1), 35-41. Sivabalan, P., Booth, P., Malmi, T., & Brown, D. A. (2009). An exploratory study of operational reasons to budget. Accounting and Finance. 49(4), 849-871.
Steed, E., & Gu Z. (2009). Hotel management company forecasting and budgeting practices:
A survey-based analysis. International Journal of Contemporary Hospitality Management. 21(6), 676-697.
398
Subramaniam, N., McManus, L., & Mia, L. (2002). Enhancing hotel manager's organizational commitment: An investigation of the impact of structure, need for achievement and participative budgeting. International Journal of Hospitality Management. 21(4), 303-320. Uyar, A. (2009). An evaluation of budgeting approaches: traditional budgeting, better budgeting, and beyond budgeting. Journal of Academic Studies. 11(42), 113-130. Uyar, A., & Bilgin, N. (2011). Budgeting practices in the Turkish hospitality industry: An exploratory survey in the Antalya region. International Journal of Hospitality
Management. 30(2), 398-408.
Winata, L., & Mia, L. (2005). Information technology and the performance effect of managers' participation in budgeting: Evidence from the hotel industry. International
Journal of Hospitality Management. 24(1), 21-39.
Yuen, D. (2006). The impact of a budgetary design system: direct and indirect models.
Managerial Auditing Journal. 21(2), 148-165.
Yuen, D. (2007). Antecedents of budgetary participation: enhancing employees’ job performance. Managerial Auditing Journal. 22(5), 533–548.
Artigo recebido em: 06/01/2014. Artigo aprovado em: 11/11/2015.
399