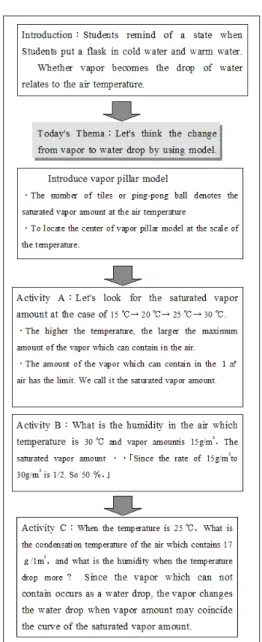
Tamura et al. (2006) reported that over half students can’t understand in a question to read quantity of saturated vapor from a table and a gra-ph and 70% student have difficulty in the humi-dity calculation. They pointed out improvement of water vapor model and lesson plan to deepen understand related to experiment results.
Miyamori et al. (2006) developed an acrylic model to express a curve of the quantity of satu-rated vapor amount (pressure) to air temperature visually. They cut an acrylic board in the form of the curve and made the acrylic pillar which beca-me independent to move to right and left behind. The students answer to questionnaire after a trial lesson showed that many students understood the relationship between the water wapor amount in the air and the air temperature. But they mentioned the improvement of the model was needed such as the change the colors of the glass marble to make it easy to image and the size-up of the acrylic model to improve vapor image. Because the model is used by moving pillar from side to side, we name it a vapor pillar model in this paper.
Terræ
Didatica
1 Introduction
Mechanism of fog and cloud formation was studied in the weather unit in the junior high school of Japan. Students pay their attention to the clouding of a window glass and study a con-densation mechanism that water vapor saturates and changes to a drop of water when it gets cold. The question about cloud formation related to the change of state of water is the worst in science questions of the junior high school, judging from the national scholastic ability, learning situation investigation in Japan in 2015. The correct answer rate is extremely low of 14.5%. The same result can be seen in the report of the National Institute for Educational policy research (2004).
Kodaka (2007) reported that many teachers had difficulty in teaching the unit of “the change of the water vapor change in the air” and felt low degree of understanding of the student. The reasons were as follows; water vapor is invisible; good method of modelling about state change of water vapor is not developed; the reading of saturated vapor amount / pressure curve graph is difficult.
ARTIGO
Abstract: The teaching material about the state change from the water vapor to the water drop caused by the shift of air temperature is presented. The ping-pong balls and tiles as a model of water vapor/drop are put into the transparent box and sheet which denote the conceptual model to understand the characteristic of saturated water vapor. When the transparent pillar shifts to the left, same ping-pong balls and tiles drop down with sound and bouncing motion on the desk. The trial lesson by using this model is conducted in the public junior high school. Many students answered that this lesson was enjoyed and that students of over 60 % could choose right answers. The rate was higher than that in the previous report. The results show this teaching material is one of the effective teaching material about the state change from the water vapor to the water drop caused by the shift of air temperature.
Manuscript:
Received: Quadrennial Conference of the International Geoscience Education Organization
Accepted: 05/06/2018
Citation: Sakakibara Y., Kodaka M., Fujioka T. . 2018.
Development of teaching material about the state change of vapor to water drop caused by cooling. Terræ
Didatica, 14(3):487-492. URL: http://www.ige.unicamp.
br/terraedidatica/.
Keywords: Vapor, Humidity, Meteorological Education,
Model, Junior High School.
Thematic line: Teaching of Geosciences and Natural
Sciences for School-Level Education and Teacher Training
Development of teaching material about the state change
of vapor to water drop caused by cooling
Y. Sakakibara, M. kodaka, T. Fujioka
FacutyoF Education, ShinShu univErSity 380-8544 naganocity, nagano, Japanogawa Junior high School 381-3302 ogawa villagE, nagano, Japan
FucultyoF Education, Shiga univErSity, 522-8522 BanBa hikonE, Shiga, JapanE-mailS: [email protected], [email protected], [email protected]
saturated. This temperature is called ‘dew point’. Furthermore, when the box moves to the left (tem-perature drops), a ping-pong ball falls down from the box (Condensation breaks out).
3 A trial lesson
3.1 The objectives of a trial lesson
Students remind of the phenomenon of clou-ded the surface of glass that in putting a flask in hot and cold water in previous lesson. Students can explain the relationship between a change of the temperature and the change from vapor to water, and the humidity at that time by using the vapor pillar models.
3.2 The classroom and students
Trial lessons are conducted for 8th grade stu-dents in public junior high school in Nagano, Japan in November, 2006. The unit of lesson is “weather and the change”. Number of students is 243 in 7 class.
Therefore this study developed the double size model of Miyamori et al. (2006) for presenta-tion and a smaller size model for group learning. We took trial lessons by using two types of vapor models with ping-pong balls and tiles. The purpo-se of this study is to evaluate the trial lesson with vapor pillar models.
2 Vapor Model
s
2.1 Vapor model for presentation
The vapor model is 4cm in thickness, 44cm in width, 34cm in height. We used orange color ping--pong balls as a vapor model. The chart which the relations of temperature and the saturated vapor amount was drawn, was pasted on a black panel of the A2 size. Three size styrene foam boards (4 cm x 2 cm x 9cm, 4 cm x 2 cm x 30cm, 4 cm x 2 cm x 44cm) were pasted along the vertical axis and horizontal axis (Fig.1).
The chart of relations of temperature and the saturated vapor amount was reproduced into transparent(TP) sheets. The upperpart on the curve of vapor saturated amount in the TP seat is removed and the rest part is pasted on styrene boards. Ping-pong balls are put into a box of 4 cm x 4 cm x 26cm without the cover. We put a box at the position on a horizontal axis corresponded to temperature. Ping-pong balls will go out when pillar moves to the left (temperature drops).
2.2 Vapor model for group learning
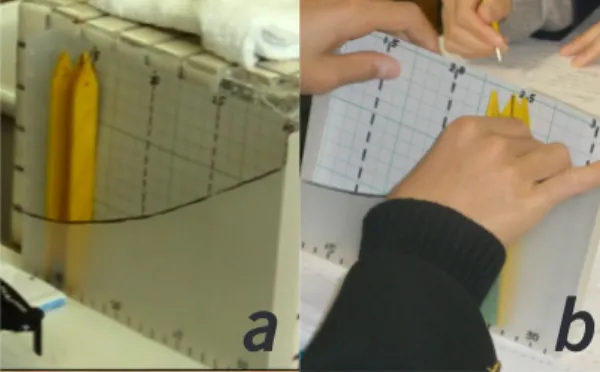
The vapor model for group learning is shown in Fig.2a. This model is made of the boxes which cut a side of a clear box to a curve of the saturated vapor amount. The graph paper of 1 cm mesh is inserted in the box and the scale is marked. A box without a cap is put into in a clear box (Fig. 2b). The tile (thickness 9 mm) is used as a vapor model in the vapor model for group learning.
2.3 How to use vapor model
The usage of both vapor models is basically same. Vapor model differs in vapor models. The ping-pong ball or tiles are used as vapor model.
The ping-pong ball are put into the box. When the box moved to the left, the top ping-pong ball located at the height of the curve of vapor saturat-ed amount (center model in the Fig.1). This air is
Figure 1. Image of Vapor Model
Figure 2. Vapor Model for Group Leraning: a (upper)
Appearance of model; b (lower) Students used
the model
3.3 The method of evaluation
A purpose of the survey is to examine the effecti-veness of the vapor pillar model to the relationship of temperature and the saturated vapor amount. After the lesson, questionnaire sheet about the teaching materials and the weather is distributed to students (Tab.1). Stu-dents choose four phrases of criteria for efficiency rating in Question1(Q1) and Q3. They can add other phrases to four phrases or five phrases which we estimated in preliminary investigation. We added up the frequency about four phrases of criteria. As an example, for a ques-tion whether you think the lesson fun, student choose one phrases from 4 phrase such as ‘fun’, ‘slightly fun’, ‘not slightly fun’, ‘not fun’ and added up the frequency of each phrase. Q5 is to measures the effect of the emotion aspect on the weather learning. Q6 to 11 is the contents to check the understanding of the vapor in the air.
3.4 The unit of lesson
The lesson in this study is conducted in the unit of ‘the change of the vapor in the air’. This unit is construc-ted in 5 school hours and this lesson is taken in fourth lesson (Table 2). The purpose of a previous lesson is to understand a change of saturated vapor amount to tem-perature and to explain the relation between saturated vapor amount and the temperature using a graph.
3.5 The content of today’s lesson
The worksheet used in a previous lesson was retur-ned to students.
The teacher reviewed that the part of a flask put into the hot water seem to be clear but become cloudy when
students put into a cold water (Fig. 3). Figure 3. Flow of the lesson Q1 Did this model encourage you learne a change of vapor in the air?
Q2 Please answer only person who answered A (helpful) or B (helpful a little) in Q1. Please mark ○ to an alphabet symbol to apply to as the reason. (multiple answers allowed)
Q3 Was the lesson using this model fun?
Q4 Please answer only person who answered A (fun) or B (slightly fun) in Q1. Please mark ○ to an alphabet symbol to apply to as the reason. (multiple answers allowed)
Q5 Do you want to know the weather more compared to before the lesson ? Q6 What does the tile falled in a model denote?
Q8 There is the air of humidity 100% at temperature 15 ℃ . When the temperature drops to 10 ℃ , how does the humidity change?
Q9 When the temperature of the air of Q8 drops to 5 degrees Celsius more, how does the humidity change? Q10 A water drop occurred when the temperature of the air of Q8. when you compare with the case 1: the
tempe-rature drops from 15℃ to 5℃ and the case 2 the case the tempetempe-rature drops from 15℃ to 10℃, which is larger in the water drop amount or the same?
Q11 There are air of 1 and 2 including the vapor of the same mass in 1m3. The temperature of air1 is 10 degrees Celsius, and the temperature of air 2 is 5 degrees Celsius. Which is higher or the same?
The teacher reviewed that the vapor became the drop of water by cooling and the water became the vapor by warming and we called it a change of state. He told that let’s consider “the changes from vapor to a water drop by using models and took the vapor pillar model for presentation and show the model with ping-pong balls.
He explained that the unit of the vertical axis is the vapor amount in 1m3 and the horizontal axis
meant temperature. And he explained that the form of the acrylic sheet meant the curve of saturated vapor amount to the temperature.
He explained that one tile was equivalent to 1 gram of vapor while showing a vapor pillar model and the tile which were distributed to each group later. A student K who chose as an assis-tant afterwards putting tiles in the pillar model. Teacher ordered him to locate the pillar at the position of 15 degrees Celsius. Then student K count the number of tiles. Teacher told student K that the number is equal the weight of vapor per 1 m3. In other words nine are 9 g/m3 if they
count the number of tiles. Thus, a lesson was progressed in such an interactive form.
4 Evaluation of the lesson
Table 3 showed recognition for the learning of the student after the lesson. As a result of direct probability calculation (both sides test), there were significantly many students who answered, “the lesson using this vapor pillar model was relatively fun” (p <0.01). Table 4 showed the classification of a reason that students felt the lesson fun. The maximum choice is “Students understand well”. The 2nd maximum reason is “ Students can think by themselves”. That may be the reason the models encourage students want to know the change of vapor to water drop in discussion.
The reason Total
to understand well 100
to think by myself 79
to do activity 67
to clarify the question 48
other 2
Table 2. Outline of unit
Nº outline
1st Students understand the difference between vapor and steam by watching the boiling kettle and measure the dew point using a metal cup.
2nd Students know the foggy outbreak condition by doing the experiment of a foggy outbreak using the tepid water and cold water.
3rd Students observe the change inside the flask and measure the temperature of inside the flask by thermometer in warming and cooling the flask. Students consider the change of vapor and water drop by the model of vapor ○ and drop of water ●.
4th Students listen to the explanation of the curve indicating the saturated vapor amount and consider the change of a vapor < > water to the temperature and the humidity by using a vapor pillar model. (This Lesson) 5th Students consider a difference of the dew point by the difference in vapor amount using the vapor pillar model.
Table 3. Whether do you feel the lesson fun or not?
Table 4. Reason you feel the lesson fun
Table 5 showed whether it was useful to use the vapor pillar model for the lesson. There were signi-ficantly many students who answered, “The model was relatively helpful to understand (p<0.01). Table 6 showed the classification of the reason why the student felt the model helpful. The most reason that students selected was “to understand well”. The 2nd
reason was similar to the 1st reason. There are to be
funny and mysterious as other reasons. There are a lot of “interesting” reasons. This may be not only
Table 5. Whether do you feel the lesson helpful or not (Q1)?
showing merely model, but also operating it by themselves. Table 7 showed whether this lesson encourage students interest in weather more. The-re weThe-re significantly many students who selected “ to know more” (p <0.01). This lesson may be suggested to promote students to study weather.
We checked how students understood the phe-nomenon about the change of vapor to water drop through the lesson by using the vapor pillar model. Table 8 showed that about 70% students answer correctly. Many children may recognize a basic thought of the condensation by using the model.
Table 9 showed the students selected “increa-sed” which was a correct answer were beyond 80%. This correct answer percentage was the highest in this research. Training A is supposed to be effective. Next question is the one to ask whether the maximum of humidity has limitation. The humi-dity of saturated air is 100% even if the tempera-ture fell down. Almost 70% students select correct answer (Tab. 10).
It is the problem to confirm of previous ques-tion. When the temperature fall down furthermo-re, the two-thirds students who chose the correct answer that the humidity remained 100% (table 11). What a ratio is the almost same as a previous question is interesting. In addition, Activity C may be effective for this question.
Table 12 showed the result about the amount of the water drop when vapor condenses in coo-ling. Since the slope of the graph of the saturated vapor amount to the temperature is plus, the large temperature fall brings about more water drop if the air is saturated. Students can’t answer correctly if they do not have both a concept of saturation and the knowledge of the shape of the graph of the saturated vapor amount. Eighty % of the stu-dents chooses the correct answer in question of the saturated vapor amount change when tempe-rature rises, too. It is interesting that both values are almost same. If a key of the instruction is to understand the shape of the graph of the saturated vapor amount to the temperature, it will become Table 6. Reason you feel the lesson helpful
The reason Total
to understand well 144
to clarify the question 83
to be fun 78
to be mysterious 12
to be impressive 11
other 9
Table 7. Do you want to know the weather more? (Q5)
Table 8. What does the tile droped from box in this lesson?
Answer Rate(%)
vapor 23
water drop 71
other 6
Table 9. When temperature becomes higher, how does the saturated vapor amount change?
Answer Rate(%)
increase 84
decrease 8
no change 2
other 6
Table 10. There is the air of humidity 100% at temperature 15 ℃ . When the temperature drops to 10 ℃, how does the humidity change?
Answer Rate(%)
over 100% 12
100% 67
under 100% 12
other 6
Table 11. When the temperature of the air of Q8 drops to 5 degrees Celsius more, how does the humidity change? Answer Rate(%) over 100% 11 100% 64 under 100% 14 other 6
Table 12. A water drop occurred when the temperature of the air of Q8. when you compare with the case 1: the temperature drops from 15℃ to 5℃ and the case 2 the case the temperature drops from 15℃ to 10℃, which is larger in the water drop amount or the same?
Answer Rate(%)
1 is larger 5
2 is larger 80
the same 3
1. Many student thought the lesson to be fun. 2. More than two-thirds of students understand
the saturated vapor amount and the humidity, and the correct answer rate was higher than a previous report.
Acknowledgements
We are grateful to Mr. Kiyoshi Nakano, Mr. Yuichi, Obinata and Ms. Megumi Yumoto of Kawanakajima Junior High School in Nagano for a trial lesson.
References
Kodaka M. 2007. Research and development of the teaching
materials to enhance a learning effect in humidity learning in the junior high school. Graduate School of
Educa-tion, Shinshu Univ. 100p. (Master’s thesis). Miyamori G. et al. 2006. Idea of the instruction method
bringing up students interest in the unit of vapor in the air: measurement of the dew point using freezing
mixture and modeling of the curve of the satu-rated vapor amount, the report of teacher research fellow. Tokyo Metropolitan Personnel in service Training Center. p. 14-24.
National Institute for Educational Policy Research cur-riculum research center. 2004. Curcur-riculum fact
find-ing survey. URL: http://www.nier.go.jp/kaihatsu/
katei_h15/index.htm
Sakakibara Y. et al. 1997. Development of teaching ma-terials about the relations of the temperature and the saturated vapor amount. Earth Science
Educa-tion, 50:121-125.
Tamura et al. 2006. Proposals focused on the mistake of ability to think – through the the analysis of “Gun-ma student scholastic ability diagnosis test”. The
report of long-term training teacher in 2006, Gunma
Prefectual Education Center. URL: http://www2. gsn.ed.jp/houkoku/2006c/06c20/8-chu-rika.pdf effective if we use both the activity of this lesson
and the activity of the relation of temperature and the saturated vapor amount using a large PET bottle (Sakakibara et al. 1997).
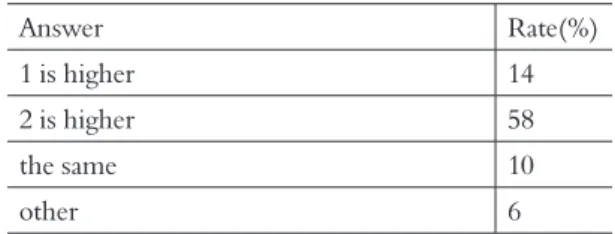
Table 13 showed the result about humidity of two air mass of different temperature and same vapor. Approximately 60% student chose the cor-rect answer.
Table 13. There are air of 1 and 2 including the vapor of the same mass in 1m3. The temperature of air 1 is 10℃, and the temperature of air 2 is 5℃. Which is higher or the same?
Answer Rate(%)
1 is higher 14
2 is higher 58
the same 10
other 6
This result exceeded the correct answer ratio of 50% in Tamura et al.( 2006). Because students are not the same student and the ways of the question are different, we cannot compare it simply. But this result suggests the possibility that it can be for an effective method on the learning of a change from steam to a water drop, and the humidity.
5 Conclusion
This study developed the teaching materials which helped students understand the changes of vapor to water drop to the temperature to a drop of water and the humidity. We take trial lessons in junior high school by using the vapor pillar model. The result shows as follows: