M
ASTER IN
F
INANCE
M
ASTERS
F
INAL
W
ORK
D
ISSERTATIOND
ETERMINANTS OFC
APITALS
TRUCTURE:
L
ARGEP
ORTUGUESEC
OMPANIES,
1984-1988
M
ARIAR
AQUELM
ARTINSG
ONÇALVESM
ASTER IN
F
INANCE
M
ASTERS
F
INAL
W
ORK
D
ISSERTATIOND
ETERMINANTS OFC
APITALS
TRUCTURE:
L
ARGEP
ORTUGUESEC
OMPANIES,
1984-1988
M
ARIAR
AQUELM
ARTINSG
ONÇALVESS
UPERVISOR:
PROFESSOR PEDRO JOSÉ MARTO NEVES
I
Acknowledgements
I would like to express my appreciation and thanks to my supervisor Professor Pedro Neves for his useful insights and knowledge.
Also, I am grateful to Ricardo, for his presence, help and for never let me give up during this time.
Finally, this thesis is dedicated to my family, who taught me to believe in myself and never give up on a challenge.
II
Abstract
This dissertation aims to verify what variables influence the decisions in the capital structure. The objective is to study a gap in a 5-year period in Portugal – 1984 to 1988. This study uses the financial reports of 50 large Portuguese manufacturing firms during this period. The variables were selected based on previous research in this area: size, profitability, level of growth, asset structure, fiscal advantages and business risk.
The empirical results showed a statistically positive significant relationship between the asset structure and leverage. On the other hand, size had a statistically negative significant relationship with leverage. All the other variables showed insignificant relationship in the debt level in a firm.
III
Table of Contents
1. Introduction……….1 2. Literature Review………...5 2.1. M&M Theory ... 5 2.2. Trade-Off Theory ... 62.3. Pecking Order Theory ... 8
2.4. Other Theories ... 9
2.5. Portuguese Case ... 10
3. Methods and Data………15
3.1. Data ... 15
3.2. Dependent Variables ... 15
3.3. Independent Variables ... 16
3.4. Hypothesis ... 17
3.5. The Model ... 20
4. Analysis and Discussion of Empirical Results……….22
4.1. Descriptive Statistics and Correlation Analysis ... 22
4.2. Results ... 23
Conclusions………...26
References………27
IV
List of Tables
Table 1 - Dependent variable and correspondent indicators………15
Table 2 - Independent Variables and correspondent indicators………...16
Table 3 - Descriptive statistics of all variables……….30
Table 4 - Correlations between all variables………31
Table 5 - Model with Dependent Variable Y1………..32
Table 6 - Model with Dependent Variable Y2………..33
Table 7 - Model with Dependent Variable Y3………..34
DETERMINANTS OF CAPITAL STRUCTURE: LARGE PORTUGUESE COMPANIES, 1984-1988 M.GONÇALVES
1
1. Introduction
The main objective for corporations is to obtain a profit. However, this process entails many risks and is dependent on the action of internal and external factors, which impact companies and their stakeholders.
Companies have the option of raising equity, debt and/or other outstanding securities, to increase funding. Each of these funding options comes with its own set of consequences.
Moreover, if a company decides to increase its debt, this action will increase its risk of default; on the other hand, if the company decides to raise its equity, it will be less vulnerable to default. As a result, it allows a larger range of investors’ access to its operations and capital. The balance between these choices will lead to a greater value in the market (Rogão, 2006).
The decision between equity and debt is influenced by both socio-economic factors of its country as well as the specific aspects of the firm. Indeed, there are many options and stages for the capital structure of a company.
For start-up companies, the owner’s equity is the main source of financing for the company. As the firm grows, a start-up tends to increase its debt in order to fullfil the needs of the current operations. As it evolves and becomes a larger company, it is most likely that an initial public offer (IPO) will happen to raise external capital.
The structure of companies’ capital is an area of great discussion in academic financial literature. Almost 50 years after the M&M Theory (Modigliani & Miller, 1958), the debate is centered in the influence of tax and some costs related with bankruptcy and financial distress.
DETERMINANTS OF CAPITAL STRUCTURE: LARGE PORTUGUESE COMPANIES, 1984-1988 M.GONÇALVES
2
Nevertheless, empirical research indicates that the choice in the capital structure depends on current resources and future objectives regarding the firm value and performance. In order to do so, managers can follow two options: exclusively equity or simultaneously equity and debt. The first option is designated as unlevered equity, since there is no existence of debt. In the second option, managers can raise simultaneously equity and debt – outstanding debt, designated by levered equity. This option holds a bigger risk, due to more external control and there is priority in repayment to debt holders and then equity holders.
In a perfect world, capital structure decisions are not relevant for the firm’s value (Modigliani & Miller, 1958). However there are market imperfections and the allocation in the capital of a firm is a relevant choice.
One of the market imperfections that affect the decision on the type of funds of a company is the amount of taxes paid. Companies pay taxes after the deduction of interest in their profits, and interest expenses, generated by debt, will reduce the corporate taxes paid by a firm. Hence, this is a incentive to increase their interest expenses since debt will be a gain to investors. As a result, this supplementary amount of taxes that the company has to pay – interest tax shield – depends on the percentage of leverage of the firm. In line with this result, it is important to note that this amount of taxes applies only to companies that generate profit.
Other market imperfections discussed amongst researchers is the cost of financial distress. Direct cost with bankruptcy – legal and accounting expenses – loss of customers, suppliers, employees and other costs relating to creditors
DETERMINANTS OF CAPITAL STRUCTURE: LARGE PORTUGUESE COMPANIES, 1984-1988 M.GONÇALVES
3
are called costs with financial distress. An imbalance between debt and equity can lead to bankruptcy of the company and involve major insolvency costs as the refered supra.
The final market imperfection refered in Modigliani & Miller (1958) is agency costs. There are two sides to this issue. High levels of debt lead managers and equity holders to take more risk and undervalue investments. On the other hand, more cashflows and lower needs in outstanding debt motivate some unnecessary expenses and less discipline in the investment decisions.
Taking into consideration all the benefits and costs associated with outstanding debt, firms have to determine the optimal level of debt in order to maximize their value.
Empirical studies regarding the capital structure of Portuguese companies has only been done for the period after 1990, leaving a large gap of time to be studied: specifically, the 1980’s.
The latter half of the 1980’s presents unique characteristics: the great growth of the Portuguese economy and capital markets, which could provide relevant data to the study of the capital structure of Portuguese corporations.
This work aims to study the determinants of the level of debt found on 50 large manufacturing companies in Portugal, from 1984 to 1988.
Furthermore, one analyzes the impact of some variables in the definition of the capital structure, and will seek to relate them with foundational corporate finance theories: Trade-Off and Pecking Order Theory.
Concerning the Trade-Off Theory, there are advantages to the company acquiring debt such as tax benefits. Nonetheless, they will increase their debt
DETERMINANTS OF CAPITAL STRUCTURE: LARGE PORTUGUESE COMPANIES, 1984-1988 M.GONÇALVES
4
level until EBIT is enough to face the interest expenses, otherwise it will destroy value. Indeed, in order to optimize its overall value, the company will focus on this Trade-Off when choosing how much debt and equity will be used for financing.
The Pecking Order Theory proposes that the costs of financing increases with asymmetric information. In line with this theory, companies prefer internal financing from shareholders and if external financing is required, debt will be preferred over equity due to the threat of external ownership.
The remainder of this study proceeds as follows. In chapter two, we will review some literature and theories in this topic, emphasizing the Portugal case. Moreover, we will describe the variables analyzed and our expectations for their influence in the capital structure. Hence, we mentioned the model and methods used in this research. Finally, in the last sections, we described the results obtained and the conclusions, comparing the expectations and the outcomes of this research.
DETERMINANTS OF CAPITAL STRUCTURE: LARGE PORTUGUESE COMPANIES, 1984-1988 M.GONÇALVES
5
2. Literature Review
Initially, this section will present a brief summary of the most important theories that identify the determinants in the choice of capital structure.
Moreover, it will go on to present some empirical work concerning the Portuguese case.
2.1. M&M Theory
In 1958, Franco Modigliani and Merton H. Miller published the M&M Theorem (Modigliani & Miller, 1958).
They considered that in a “Perfect World”, without taxes, no transaction costs and no costs associated with bankruptcy, the level of debt was irrelevant for the determination of a company’s value.
“M&M Proposition I: In a Perfect capital market, the total value of a firm is equal to the market value of the total cash flows generated by its assets and its not affected by its choice of capital struture” (Berk & Demarzo, 2013).
According to the authors, supressing market imperfections from their analysis, will not affect the firm’s choice in raise just equity or, on the other side, raise equity and outstanding debt to make face to their needs. The above conclusion follows the law of one price, where both securities and assets must have equally market values. As shown, a firm’s value is not affected by the choice in the capital structure.
DETERMINANTS OF CAPITAL STRUCTURE: LARGE PORTUGUESE COMPANIES, 1984-1988 M.GONÇALVES
6
The main contribution of this theorem for corporate finance was the relationship between the type of debt and the value of a company.
Hence, M&M used this first proposition to explain the relation between leverage and cost of capital. In addition, they concluded that the leverage return equals to a unleverage return plus a premium resulted of debt in the capital structure.
“M&M Proposition II: The cost of capital of levered equity is equal to the cost of capital of unlevered equity plus a premium that is proportional to the market value debt-equity ratio.” (Berk & Demarzo, 2013).
In opposition to the first proposition, the value of a leveraged firm comparing with an unlevered one is not equal. As shown, the cost of capital of a leveraged firm is higher than the cost of capital of a unleveraged one. Thus, the difference will be the market value of debt-equity ratio.
Nevertheless, for the two conclusions supra, the authors assume that we live in a prefect world, essencial with no taxes. Some years later, the authors did an ammendment to the above research, and included the influency of taxes in the capital structure of a firm (Modigliani & Miller, 1963).
2.2. Trade-Off Theory
The Trade-Off Theory states that there is a perfect capital structure that maximizes the value of a company. According to this theory, “the total value of a
DETERMINANTS OF CAPITAL STRUCTURE: LARGE PORTUGUESE COMPANIES, 1984-1988 M.GONÇALVES
7
of the tax savings from debt, less the present value of financial distress costs”
(Berk & Demarzo, 2013).
Mathematically, Trade-Off Theory is represented as follows: VL = VU + Present
Value (Interest Tax Shield) – Present Value (Financial Distress Costs) ± PV (Agency Costs/Benefits of Debt), where VL is the value of a company and VU
is a unlevered company.
Similar to what we refered above, companies pay corporate tax after the deduction of interest expenses in their profits, and these costs will reduce the corporate tax paid by the firm. This additional amount of taxes, which companies have to pay, is called ‘interest tax shield’ and depends on the percentage of leverage of a firm. This benefit, created by leverage, only applies to companies with profit. Therefore, companies must balance their percentage of debt in to achieve the optimal point of leverage. In cases of excessive leverage, the risk of bankruptcucy will increase and can lead to no profit in the firm.
The second factor in the formula is financial distress cost. These are direct costs related with bankruptcy – legal and accounting expenses – loss of customers, suppliers and employees. Companies with large levels of leverage can lose the capability of facing their expenses with suppliers and employees. In the case of bankruptcy, firms will face an increase in legal expenses as well as the loss of the market position and their client base.
Lastly, agency costs or benefits are related to conflits between stakeholders. When a firm is leveraged, there are conflicts of interest. In the case of different
DETERMINANTS OF CAPITAL STRUCTURE: LARGE PORTUGUESE COMPANIES, 1984-1988 M.GONÇALVES
8
investment decisions, different consequences will influence the value of debt or equity.
According to the formula, there is an incentive to the increase of debt, in order to achieve the benefits from interest tax shields.
Aligned with this theory, firms must balance on one side the benefits of tax shield and on the other the costs of financial distress, and measure the impact on corporate financing.
2.3. Pecking Order Theory
Concerning the Pecking Order theory, researchers defend that there is a tendency to prefer internal sources of funds rather than the external sources (Myers & Majluf, 1984). According to Myers and Majluf, there are three sources of funds: debt, equity and retained earnings. When retained earnings (i.e. internal cashflows generated by the firm) are not enough to support the costs, it is prefered debt instead of equity.
For an outside investor, equity is a riskier fund comparing with debt. From a insider perpective, retained earnings are a better source of funding comparing with a outside one and are used when possible. However, when the retained earnings are inadequate, debt will be used instead of equity.
This theory did not presented an optimal leverage ration, just compared three types of funds and the ideal fund for the needs of the firm.
DETERMINANTS OF CAPITAL STRUCTURE: LARGE PORTUGUESE COMPANIES, 1984-1988 M.GONÇALVES
9
2.4. Other Theories
Researchers have been developing theories in order to support the behaviour of firms regarding the capital struture decisions.
Norman Toy was one of the first authors with some evidence that the growth of a company and their debt level are related (Toy et al., 1974). Nowadays, the growth and debt are associated with the Pecking Order.
According to the financial literature, companies have five stages in life and in each stage there is a tendency to seek more debt or more equity.
The development stage is the beginning of the business lifecycle. The investor has one business idea and the main challenge is the research regarding the industry.
Start-up firms fall into the second stage of the financial evolution. These companies are constituted by owner’s equity and almost no bank debt. Moreover, there are some cases of business angels entering the capital structure of the company.
The third stage of growth is the expansion stage where the company establishes some presence in the market. In this phase, internal cash flows are not enough for the current operations so many firms tend to go to the market to raise stock. We find a tendency to seek more debt in this stage.
Concerning the fourth stage, we find more mature companies with stable growth rates. In this case, the existent cashflows come from past investment and there are no need of future investments.
In the final stage, we encounter companies in the last stage of their life where it is visible a decrease in the return on investment. Generally, firms in this stage
DETERMINANTS OF CAPITAL STRUCTURE: LARGE PORTUGUESE COMPANIES, 1984-1988 M.GONÇALVES
10
have a decreasing market presence and its market value is taken by new competitors with inovating ideias/products.
Another theory discussed among researchers is the Market Timing theory (Baker & Wurgler, 2002). This theory is related with shares issued in the market and price fluctuations. In the view of Baker and Wurgler, firms take advantages of temporary fluctuations in the cost of equity in the market. It is logical to think that managers will take advantage when the share price is below the fair one. As such, they will issue equity. In opposition, when the share price is above the fair market price, managers will repurchase shares.
Authors concluded that the firm capital struture is related wit the variation in the stock price and companies with lower leverage will raise more funds when their market value is higher.
2.5. Portuguese Case
There are several studies that analyze the determinants of the Portuguese Capital Structure as Antão and Bonfim (2008), Couto and Ferreira (2010), Rogão (2006), Serrasqueiro et al. (2011), Serrasqueiro and Rogão (2009), Vieira (2013) or Jorge and Armada (2001). However, as noted above, these studies relate to periods subsequent to 1990. Among them, the one that embarks a more close period to 1980s is Jorge and Armada ( 2001).
These authors developed a study about the debt level of large portuguese companies, from 1990 until 1995. They included some factors already discuss by other authors like Remmers (1974), Titman & Wessels (1988) or Toy et all (1974) in their work. One of the determinants discussed in this study was the
DETERMINANTS OF CAPITAL STRUCTURE: LARGE PORTUGUESE COMPANIES, 1984-1988 M.GONÇALVES
11
type of industry in which the company operates, but according to Remmers et al. (1974) this factor is not a determinant of capital structure. They considered other factors and we have some of them in consideration in this study: dimension, growth of the firm, business risk, profitability, asset structure, fiscal advantages in debt for the company.
Regarding this research, they considered the dimension a positive factor in the capital structure, big companies have more diversification in the capital structure and more access to external funds (Remmers et al., 1974). Large companies have less risk of bankruptcy and more guarantees, which leads to higher levels of trust from banks in loan operations. When compared dimension with short term debt, some researchers observed a negative relation between these factors (Rajan & Zingales, 1995). Jorge and Armada (2001) concluded that the dimension did not influence the capital structure. Due to the fact that the sample selected includes only large companies, the influence of this determinant was negligible. They determined that with a more diverse sample results for this factor would be different.
There are two generally accepted ways to measure the influece of growth factor in capital structure choice: percentage of growth of the assets or the rate of growth of profit before depreciations and provisions. Jorge and Armada concluded that there is a positive influence with the capital structure choice, regardless the way of measure used.
When a firm is in the growth stage, the internal funds and retained earnings are not enough to face their expences. Moreover, in this stage the firm do not have enough retained earnings, so a large investment in its structure is necessary to
DETERMINANTS OF CAPITAL STRUCTURE: LARGE PORTUGUESE COMPANIES, 1984-1988 M.GONÇALVES
12
increase its market position. In order to do so, they choose to used debt/external funds to face these expenses. In this line of thought, firms with a higher growth of their assets tend to have more leverage in their structure. For the profitability factor, they expected a negative relation with capital structure, according with Pecking Order and the preference in internal funds by the firm (Myers & Majluf, 1984). Therefore, they concluded that if took in consideration the profit before depreciations and provisions, in their calculations, the relation with leverage would be negative (in line with Pecking Order theory). On other hand, if they considered the operational profit, the relation with leverage would be positive. Hence, the difference between these two ways of calculating will be the extraordinary profit, and this is the factor that influences the capital structure decision.
In the business risk, they expected a negative relation with leverage, especially short term debt. Several researchs have studied the relation between this factor and leverage (Toy et al., 1974). Intuitively, higher risk leads to less trust in the entity and less hability to face costs in case of bankruptucy. They concluded that with the growth of risk in the business, the ability to meet its future costs could be compromised, leading the firm to decrease the weight of debt in the capital structure. This examination determined that these two factors have a negative relationship (i.e. more risk in the business leads to less leverage in the capital structure of the company).
Regarding the asset composition, they expected a positive relation to tangible assets and a negative association to intangible assets. This followed the ideia that tangible assets are collaterals for leverage (Titman & Wessels, 1988,
DETERMINANTS OF CAPITAL STRUCTURE: LARGE PORTUGUESE COMPANIES, 1984-1988 M.GONÇALVES
13
Rajan & Zingales, 1995). Tangible assets have a quantitive value in the market and creditors see these assets as guarantees in the credit operations. On other side, we have intangible assets where their value is specific to the firm and it is more difficult to have the same value in the market accepted by all creditors. The majority of research on these factors (Titman & Wessels, 1988, Rajan & Zingales, 1995, Jorge & Armada, 2001), concluded that there is a relationship between the tangibility of assets and the leverage of a firm. Jorge and Armada concluded that a firm with more tangible assets tends to have more debt in his structure compared with a firms with more intagible assets in his structure. Concerning the fiscal advantages of debt, they expected that if they considered the depreciation of the assets, the relationship between this factor and leverage would be positive. If in the calculation they used costs with research and development, they expected a negative relation with leverage (Titman & Wessels, 1988). Other fiscal advantage is the weight of tax shield and how debt can decrease the corporate tax in a firm. After deducting all of their costs, and presenting a profit companies have to pay corporate tax.
If they have less profit before taxes, due to a higher leverage in the company, the value of the tax shield will be lower. So, the interest expenses depend on the leverage of a firm, and more costs will reduce the corporate tax paid at the end of the business year.
This is an incentive to increase the interest expenses of a firm since debt will be a gain for investors. It is important to note that this amount of taxes applies only to companies with profit. In line with this facts, companies need to weight the balance between profit and interest expenses in order to have a positive profit
DETERMINANTS OF CAPITAL STRUCTURE: LARGE PORTUGUESE COMPANIES, 1984-1988 M.GONÇALVES
14
before taxes. In Jorge and Armada research, after they tested this factor in the model, the results were that fiscal advantages did not influenced the leverage level of a firm.
For the activity sectors, Jorge and Armada expected a significant level of relation with leverage, contrary to Remmers et al. (1974). Firms in the same activity sector face the same business risk (Ferri & Jones, 1979). As discussed above, the business risk is a determinant of the capital structure and it has a positive relation with leverage (Remmers et al., 1974). Therefore, the conclusion for the activity sector should be similar - it should be a determinant of the capital structure of a firm. The results showed that this factor was not a determinant for capital structure.
Regarding the shareholder control, they expected that this would have a higher influence on the capital structure’s decision, as management style influences the decisions in the firm and the weight of leverage in a company. Besides, the results were contrary to expectations of the authors and shareholder control was not a determining factor in the choice of capital structure.
DETERMINANTS OF CAPITAL STRUCTURE: LARGE PORTUGUESE COMPANIES, 1984-1988 M.GONÇALVES
15
3. Methods and Data
In this section we present the data and the methodology used to analyze the determinants of the capital structure of large Portuguese firms, in the second half of 1980s.
3.1. Data
The analysis was based on 50 large Portuguese manufacturing firms. First we identified the companies with assets and operating revenue of more than 6*109
PTE in 1987, having found 41 companies. To complete the sample we selected other nine companies that were listed on the stock exchange.
For these 50 companies, we collected financial information from the annual reports published in the Portuguese Official Gazette, in order to create a database composed with all the variables described below.
3.2. Dependent Variables
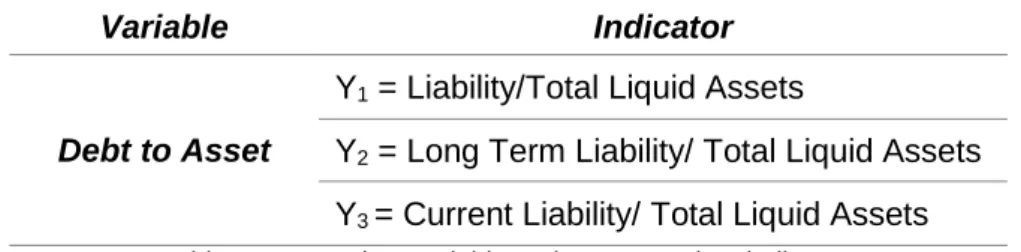
We used the debt to assets as the dependent variable. The indicators of this variable are in the table 1:
Variable Indicator
Debt to Asset
Y1 = Liability/Total Liquid Assets
Y2 = Long Term Liability/ Total Liquid Assets
Y3 = Current Liability/ Total Liquid Assets
DETERMINANTS OF CAPITAL STRUCTURE: LARGE PORTUGUESE COMPANIES, 1984-1988 M.GONÇALVES
16
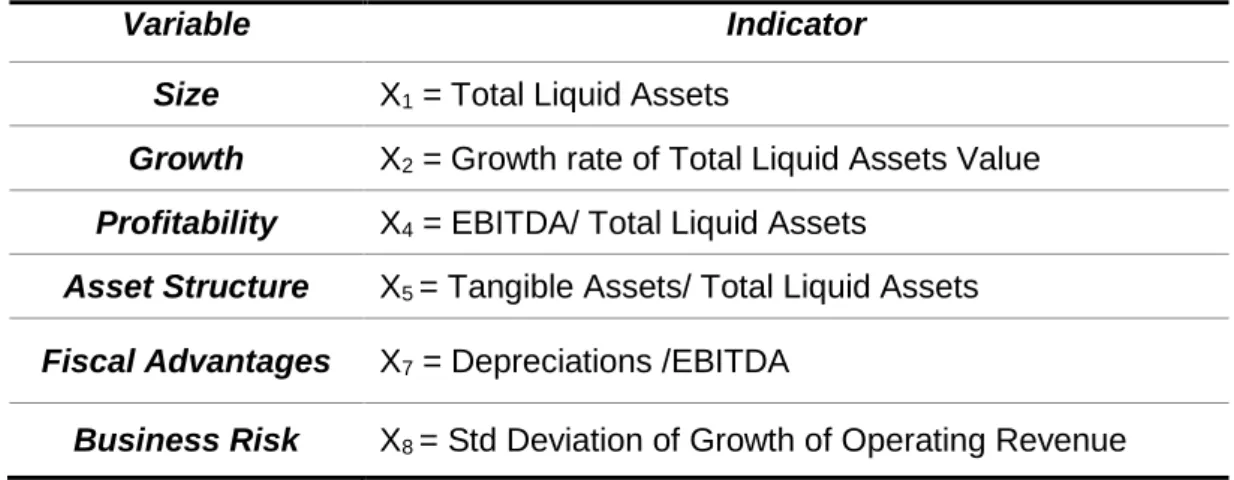
3.3. Independent Variables
Based on the methodology of Jorge and Armada (2001), we selected six independent variables: size, growth, profitability, asset structure, fiscal advantages and business risk:
Variable Indicator
Size X1 = Total Liquid Assets
Growth X2 = Growth rate of Total Liquid Assets Value Profitability X4 = EBITDA/ Total Liquid Assets
Asset Structure X5 = Tangible Assets/ Total Liquid Assets
Fiscal Advantages X7 = Depreciations /EBITDA
Business Risk X8 = Std Deviation of Growth of Operating Revenue
Table 2 - Independent Variables and correspondent indicators
Initially, for each variable we used some indicators from the evidence of Jorge and Armada (2001) research. For the size variable, Jorge and Armada used the number of workers, the volume of sales and the value of asset. We selected the value of asset, since we do not have the information about the workforce in the firm during the selected years. We used the logarithm value of this indicator for the model.
This paper uses the growth rate of assets in each year as a key indicator when discussing the growth of a firm. To measure profitability, this paper uses the ratio between earnings before interest, taxes, depreciations and amortizations (EBITDA) and the asset value.
DETERMINANTS OF CAPITAL STRUCTURE: LARGE PORTUGUESE COMPANIES, 1984-1988 M.GONÇALVES
17
For asset structure variable, we used the indicator measure with the tangible assets. In the fiscal advantages we use only one indicator, same as Jorge and Armada research, the ratio between depreciations with earnings before interest, taxes, depreciations and amortizations (EBITDA). In the research, the authors also used the ratio between R&D and net sales. Due to the limitation in the income statements, where the value of R&D was not specified, we decided to use only one indicator for this variable.
Finally, for the business risk variable, we use as indicator the standard deviation of the growth of the operating revenue.
3.4. Hypothesis
The determinants of capital structure are related, in a direct or indirect way, to operational characteristics of the firm. The hypotheses raised in this work were formulated in accordance with several of the previously discussed academic authors and their beliefs regarding each variable.
Regarding the size this factor is assumed to have a positive relation with leverage. According to Remmers (1974) larger companies are viewed in the market as being more trustful by creditors. Therefore, larger companies have more access to loans and other external funds than small business firms. There is also a tendency of these firms to diversify their capital structure. In sum, this factor will have a positive relation with the capital structure of a firm.
DETERMINANTS OF CAPITAL STRUCTURE: LARGE PORTUGUESE COMPANIES, 1984-1988 M.GONÇALVES
18
In the view of Titman and Wessels (1988), growth has a positive relation with leverage. As we present before in one of the theories, when a firm is in the expansion stage, internal cash flows are not enough for the current operations so there is a tendency to seek more debt for their capital structure.
Almost all of the research in this matter concluded that companies with higher growth tend to have more debt in their capital structure. So, this variable will have a positive relation with leverage.
Hypothesis 2: Growth has a positive relation with leverage level of a firm.
In line with Pecking Order theory firms prefere internal funds to external ones (Myers & Majluf, 1984). Therefore, a high profit company will have more retaining earnings, and it will prefer this type of funds to debt.
Having this in consideration, profitability will have a negative relation with leverage.
Hypothesis 3: Profitability has a negative relation with leverage level of a firm.
Regarding the asset composition, and in the view of Titman and Wessels (1988), there are two hypotheses and these depend on the tangibility of the assets. For tangible assets, we believe that it has a positive relation with leverage. These assets have a quantifiable value in the market and this value is accepted by all investors. So, they serve as a guarantee/collateral in credit operations. Consequently, firms with more tangible assets in their structure will
DETERMINANTS OF CAPITAL STRUCTURE: LARGE PORTUGUESE COMPANIES, 1984-1988 M.GONÇALVES
19
have more leverage. Therefore, tangible assets will have a positive relation with the value of debt in the company.
Hypothesis 4: Tangible assets have a positive relation with leverage level of a firm.
Concerning fiscal advantages, Jorge and Armada (2001) believed in a positive relation with leverage. There is an incentive to increasing debt in firms with profit. As supra, after all the deductions of costs in the profit, companies pay corporate tax. If the debt is higher, it will decrease the profit before tax. With a lower profit, the firm will pay less corporate tax. But, excessively debt will lead to loss. So, firm needs to balance this increase in debt, until it is beneficial regarding the taxes that the firm needs to pay. Therefore, fiscal advantages have a positive relation with leverage.
Hypothesis 5: Fiscal advantages have a positive relation with leverage level of a firm.
In line with Toy et al. (1974), business risk will have a negative relation with leverage in a firm. With a higher risk in the business, the firm’s ability of facing its future costs may be compromised. Hence, in the investors’ view, a firm with more risk can be less trustful to a credit operation. In line with this though, business risk will have a negative relation with leverage in the firm.
DETERMINANTS OF CAPITAL STRUCTURE: LARGE PORTUGUESE COMPANIES, 1984-1988 M.GONÇALVES
20
Hypothesis 6: Business Risk has a negative relation with leverage level of a firm.
3.5. The Model
In order to test the hypotheses raised, we used a panel data model that contains three multiple linear regressions due to the three indicators that measure the debt level:
Y1 = + β1 X1 it + β2 X2 it + β3 X3 it + β4 X4 it + β5 X5 it + β6 X6 it + ε it (1) Y2 = + β1 X1 it + β2 X2 it + β3 X3 it + β4 X4 it + β5 X5 it + β6 X6 it + ε it (2) Y3 = + β1 X1 it + β2 X2 it + β3 X3 it + β4 X4 it + β5 X5 it + β6 X6 it + ε it (3)
Regarding the above equations, we consider i = 1, 2 … 50 for the total of firms during t = 1984, 1985, 1986, 1987, 1988. As referred supra, we have three dependent variables, each one correspond to one equation, and each β is an unknown parameter, coefficient for the independent variables. The last parameters considered is the standard error ε, and it represent the difference between the actual and the estimated value for each dependent variable.
The model was estimated using the Ordinary Least Squares (OLS), Fixed Effect (FE) and Random Effect (RE) methods. The OLS considers a constant effect and an error factor, and it assumes that the independent variables are not correlated. The FE method is a statistical model where all variables are non-random values. It considers multiples - constant value for each individual -
DETERMINANTS OF CAPITAL STRUCTURE: LARGE PORTUGUESE COMPANIES, 1984-1988 M.GONÇALVES
21
Finally, the RE method assumes a non-correlation between an independent variable with the dependent ones. In opposition to FE method, there are no constant values in the model.
The main purpose of this model is to analyze each variable separately and identify the most significant for the capital structure and the relation that each factor has with the level of leverage of a firm.
DETERMINANTS OF CAPITAL STRUCTURE: LARGE PORTUGUESE COMPANIES, 1984-1988 M.GONÇALVES
22
4. Analysis and Discussion of Empirical Results
This section will present the estimation results of the empirical model. Before an overall analysis of other interesting results, one will first examine the main descriptive statistics of all variables.
4.1. Descriptive Statistics and Correlation Analysis
Table 3 presents the descriptive statistics of the variables considered in this study. We can highlight the main indicators for debt – in average the total debt represents 57% of the total assets, 17% for long term debt and 40% for short term debt.
In line with the above results, average of the short term debt is more than the double of long term debt. It could be related to the lack of dynamism of Portuguese capital markets. Moreover, the confidence of Portuguese companies in the banking system is evident in these results, showing the tradition of the loan operations as ways of financing.
In Table 4, there is a summarized table with the correlations between variables. In the dependent variables, the correlation between total liabilities and profitability is negative and statistically significant. In case of the long term debt, there is a positive and significant statistically correlation with size and asset structure, and on other hand, a negative correlation with profitability. For current debt, we can highlight a negative and significant statistically correlation with asset structure.
Concerning the correlation in the independent variables, we can highlight some statistically significant correlations. For asset value, there is a negative
DETERMINANTS OF CAPITAL STRUCTURE: LARGE PORTUGUESE COMPANIES, 1984-1988 M.GONÇALVES
23
significant statistically correlation with profitability. For profitability variable, there is a correlation with asset value, as referred above in this variable. In case of growth of asset, fiscal advantages and business risk variables, one do not observe any statistically significant correlation. Finally for asset structure, there is a positive and statistically significant correlation with asset value.
4.2. Results
One used the three methods describe in the previous section for the three dependent variables. For each case, the appropriated method will be interpreted to explain the influence of the independent variables in the debt level of a firm - the F, Breusch-Pagan and Hausman test were used.
Table 5 to 7 present the results of regressions Y1, Y2, and Y3, considering the
OLS, the FE and the RE, as well as the results of F, Breusch-Pagan and Hausman tests.
The results show that the most suitable model for regressions Y1 and Y3 was
the FE method, and RE method for regression Y2. Moreover, we will analyze
the results based on these methods.
Table 5 show the result for Y1 - ratio between value of liability and total asset –
the FE method, with an R square of 0.765, suggests that the size and asset structure factor are related to debt level of a firm, with a statistically significant. Nevertheless, the size had a negative relation with leverage of 22.5%; which is opposite to what would be the expected. The results concerning the asset structure for these estimations are in line with the previous finding, with a
DETERMINANTS OF CAPITAL STRUCTURE: LARGE PORTUGUESE COMPANIES, 1984-1988 M.GONÇALVES
24
positive relation with leverage of 26%. For the other independent variables, there is no significant statistically value.
On the table 6 are presented the results regression considered the Y2 – ration
between long-term liability and asset – with a statistically significant Breusch-Pagan test. The test suggests that the appropriated model for this regression is the Random Effects Method. The results reveal that there is a statistical significance between size and asset structure. For size the relation is minimum, a positive relation of 6.5%. On the other hand, asset structure had a positive relation with the leverage level, in a value of 40.7%. For the other independent variables, there is no significant statistically value.
For the last dependent variable Y3 – ratio between current liability and asset –
with an R square of 0.745, the appropriated method is the Fixed Effects Method. The method shows a statistical significance only with size. For this variable there is a negative relation with leverage – 27.7%, similar to the results for first dependent variable. For the other independent variables, there is no significant statistically value.
Concerning the expectations, we find a relation between size and asset structure with the debt level of a firm. In regard to the effect of size, we find a negative relation with leverage, opposite to previous findings. In the case of asset structure, we find a positive relation with long term liabilities, but a negative effect when compared with short-term debt.
For the other variables, growth, fiscal advantages and business risk, we do not find a statistical relation with the level of leverage of a firm, similar to results of Jorge and Armada (2001).
DETERMINANTS OF CAPITAL STRUCTURE: LARGE PORTUGUESE COMPANIES, 1984-1988 M.GONÇALVES
25
Related the above results with the formulated hypothesis, we conclude that only a hypothesis proved to be true, the positive relation between asset structure and the debt level of a firm. Referring the others hypothesis, we did not find any significant relation between debt level and growth, fiscal advantages or business risk, which was contrary to the expectations. Finally, for the size hypothesis, previous studies showed a positive and significant relation between this variable and debt level. In this study, the result between these two variables showed to be a significant and negative relation.
DETERMINANTS OF CAPITAL STRUCTURE: LARGE PORTUGUESE COMPANIES, 1984-1988 M.GONÇALVES
26
Conclusions
In this research, one aimed at contributing to the literature of level of leverage in capital structure and its variables, covering the five-year period between 1984 and 1988. In the first chapters, we reviewed briefly the relevant literature in the capital structure decisions. Subsequently, we formulated the hypotheses for each factor and the expected relation with leverage.
Thus, this dissertation aims to fill an existing gap in the selected years about the factors that influence the capital structure decisions for Portuguese companies. The results provided by the multiple linear regression model suggest that there are some factors with no influence in the level of leverage of a firm, referring to level of growth, fiscal advantages and business risk. Moreover, asset structure variable showed a positive relation with the leverage level. This result supports some previous empirical studies on this area (Titman & Wessels, 1988).
On the opposite side, we have dimension factor with a negative relation with leverage. This result is opposite to other previous studies in this area (Remmers et al., 1974). The same happens with profitability variable. We expected a negative relation with leverage, according to the pecking order, and the result showed a small positive relation with the debt level in a firm.
DETERMINANTS OF CAPITAL STRUCTURE: LARGE PORTUGUESE COMPANIES, 1984-1988 M.GONÇALVES
27
References
Antão, P. & Bonfim, D., 2008. Capital Structure Decisions in the Portuguese Corporate Sector. Financial Stability Report - Banco de Portugal.
Baker, M. & Wurgler, J., 2002. Market Timing and Capital Structure. The Journal of Finance, v. 57, n. 1 (February), pp. 1-32.
Berk, J. & Demarko, P., 2013. Corporate Finance. 3ª ed. s.l.:Pearson.
Couto, G. & Ferreira, S., 2010. Os determinantes da estrutura de capital de empresas do PSI 20. Revista Portuguesa e Brasileira de Gestão, v.9, pp. 26-38.
Ferri, M. & Jones, W., 1979. Determinants of financial structure: a new methodological approach. The Journal of Finance, v. 34, pp.631-644.
Jorge, S. & Armada, M. J., 2001. Factores Determinantes do Endividamento: uma Análise em Painel. Revista de Administração Contemporânea, v. 5, n. 2, pp. 9-31.
Modigliani, F. & Miller, M., 1958. The Cost of Capital, Corporation Finance and the Theory of Investment. American Economic Review, pp. 97-261.
DETERMINANTS OF CAPITAL STRUCTURE: LARGE PORTUGUESE COMPANIES, 1984-1988 M.GONÇALVES
28
Modigliani, F. & Miller, M. H., 1963. Corporate Income Taxes and the Cost of Capital: A Correction. American Economic Review, v. 53, n. 3, pp. 433-443.
Myers, S. & Majluf, N., 1984. Corporate financing and investments decisions when firms have information that investors do not have. Journal of Finance Economics, v. 39, n. 3, pp. 187-222.
Rajan, R. & Zingales, L., 1995. What do we know about capital structure? Some evidence from internacional data. The Journal of Finance, v. 50, pp. 1421-1460.
Remmers, L.,Stonehill, A., Wright, R., Beekhuisen, T., 1974. Industry and Size as Debt Ratio Determinants in Manufacturing Internationally. Financial Management. v. 3, n. 2, pp. 24-32.
Rogão, M. R., 2006. Determinantes da estrutura de capitais das empresas cotadas portuguesas: evidência empírica usando modelos de dados em painel, Beira do Interior: Covilhã: Universidade da Beira do Interior.
Serrasqueiro, Z., Nunes, P. & Silva, J., 2011. Are Capital Structure Decisions of Family-Owned SMEs Different? Empirical Evidence from Portugal. Universidade de Évora.
DETERMINANTS OF CAPITAL STRUCTURE: LARGE PORTUGUESE COMPANIES, 1984-1988 M.GONÇALVES
29
Serrasqueiro, Z. & Rogão, M., 2009. Capital structure of listed Portuguese companies: determinants of debt adjustment. Review of Accounting and Finance, v. 8, pp. 54-75.
Titman, S. & Wessels, R., 1988. The determinants of capital structure choice. The Journal of Finance, v. 43, pp. 1-19.
Toy, N., Stonehill, A., Remmers, L., Wright, R., Beekhuisen, T., 1974. A Comparative International Study of Growth, Profitability, and Risk as Determinants of Corporate Debt Ratios in the Manufacturing Sector. Journal of Financial and Quantitative Analysis, v. 9, pp 875-886.
Vieira, E., 2013. Capital Structure Determinants in the Context of Family Firms. Advance Research in Scientific Areas, v. 2 - 6, pp. 219-228.
DETERMINANTS OF CAPITAL STRUCTURE: LARGE PORTUGUESE COMPANIES, 1984-1988 M.GONÇALVES
30
Appendix
Table 3
N Minimum Maximum Mean Std. Deviation Dependent Variables Y1 250 0.04 1.18 0.57 0.21 Y2 250 0.00 0.72 0.17 0.17 Y3 250 0.04 1.06 0.40 0.20 Independent Variables X1 250 6.61 9.34 7.72 0.48 X2 250 -5.70 3.04 0.10 0.47 X3 250 -0.20 2.17 0.19 0.22 X4 250 0.00 0.87 0.36 0.18 X5 250 -5.92 5.88 0.48 0.88 X6 250 0.00 0.49 0.05 0.06 Valid N (listwise) 250
Table 3 - Descriptive statistics of all variables Source: Own research
DETERMINANTS OF CAPITAL STRUCTURE: LARGE PORTUGUESE COMPANIES, 1984-1988 M. GONÇALVES 31
Table 4
Y1 Y2 Y3 X1 X2 X3 X4 X5 X6 Pearson Correlation 1.000 0.444** 0.683** 0.104 -0.056 -0.149* 0.124 -0.100 -0.021 Sig. (2-tailed) 0.000 0.000 0.100 0.374 0.018 0.051 0.116 0.740 N 250.00 250.00 250.00 250.00 250.00 250.00 250.00 250.00 250.00 Pearson Correlation 0.444** 1.000 -0.350** 0.282** 0.016 -0.151* 0.452** -0.067 0.029 Sig. (2-tailed) 0.000 0.000 0.000 0.802 0.017 0.000 0.292 0.645 N 250.00 250.00 250.00 250.00 250.00 250.00 250.00 250.00 250.00 Pearson Correlation 0.683** -0.350** 1.000 -0.120 -0.072 -0.033 -0.238** -0.048 -0.043 Sig. (2-tailed) 0.000 0.000 0.058 0.260 0.608 0.000 0.452 0.502 N 250.00 250.00 250.00 250.00 250.00 250.00 250.00 250.00 250.00 Pearson Correlation 0.104 0.282** -0.120 1.000 0.090 -0.128* 0.169** 0.068 0.068 Sig. (2-tailed) 0.100 0.000 0.058 0.154 0.042 0.007 0.286 0.285 N 250.00 250.00 250.00 250.00 250.00 250.00 250.00 250.00 250.00 Pearson Correlation -0.056 0.016 -0.072 0.090 1.000 0.001 0.017 0.006 -0.110 Sig. (2-tailed) 0.374 0.802 0.260 0.154 0.985 0.789 0.919 0.083 N 250.00 250.00 250.00 250.00 250.00 250.00 250.00 250.00 250.00 Pearson Correlation -0.149* -0.151* -0.033 -0.128* 0.001 1.000 -0.057 -0.085 0.061 Sig. (2-tailed) 0.018 0.017 0.608 0.042 0.985 0.369 0.180 0.336 N 250.00 250.00 250.00 250.00 250.00 250.00 250.00 250.00 250.00 Pearson Correlation 0.124 0.452** -0.238** 0.169** 0.017 -0.057 1.000 0.019 -0.008 Sig. (2-tailed) 0.051 0.000 0.000 0.007 0.789 0.369 0.767 0.905 N 250.00 250.00 250.00 250.00 250.00 250.00 250.00 250.00 250.00 Pearson Correlation -0.100 -0.067 -0.048 0.068 0.006 -0.085 0.019 1.000 0.047 Sig. (2-tailed) 0.116 0.292 0.452 0.286 0.919 0.180 0.767 0.458 N 250.00 250.00 250.00 250.00 250.00 250.00 250.00 250.00 250.00 Pearson Correlation -0.021 0.029 -0.043 0.068 -0.110 0.061 -0.008 0.047 1.000 Sig. (2-tailed) 0.740 0.645 0.502 0.285 0.083 0.336 0.905 0.458 N 250.00 250.00 250.00 250.00 250.00 250.00 250.00 250.00 250.00 Dependent Variables Independent Variables X3 X4 X5 X6 Y1 Y2 Y3 X1 X2Table 4 - Correlations between all variables Source: Own research
DETERMINANTS OF CAPITAL STRUCTURE: LARGE PORTUGUESE COMPANIES, 1984-1988 M. GONÇALVES
32
Table 5
Dependent Variable: Y1
Independent Variables OLS RE FE
Constant 0.277 1.079*** 2.229***
(0.218) (0.325) (0.489)
X1 Total Liquid Assets 0.038 -0.075* -0.225***
(0.028) (0.042) (0.062)
X2 Growth rate of Total Liquid Assets Value -0.029 0.002 0.014
(0.028) (0.018) (0.018)
X3 EBITDA/ Total Liquid Assets -0.136** 0.035 -0.018
(0.061) (0.040) (0.040)
X4 Tangible Assets/ Total Liquid Assets 0.125* 0.267*** 0.260**
(0.075) (0.095) (0.120)
X5 Depreciations /EBITDA -0.028* -0.019* -0.016
(0.015) (0.010) (0.010)
X6 Std Deviation of Growth of Operating Revenue -0.060 -0.211 -0.132
(0.213) (0.144) (0.147) N Observations 250 250 250 R2 0.059 0.765 F test 11.902*** Breusch-Pagan test 197.071*** Hausman test 19.734***
Table 5 - Model with Dependent Variable Y1 Source: Own research
DETERMINANTS OF CAPITAL STRUCTURE: LARGE PORTUGUESE COMPANIES, 1984-1988 M.GONÇALVES
33
Table 6
Dependent Variable: Y2
Independent Variables OLS RE FE
Constant -0.497*** -0.474** -0.383
(0.150) (0.225) (0.377)
X1 Total Liquid Assets 0.071*** 0.065** 0.052
(0.020) (0.029) (0.048)
X2 Growth rate of Total Liquid Assets Value -0.002 -0.004 -0.003
(0.020) (0.013) (0.014)
X3 EBITDA/ Total Liquid Assets -0.084** -0.023 -0.012
(0.042) (0.030) (0.031)
X4 Tangible Assets/ Total Liquid Assets 0.385*** 0.407*** 0.414***
(0.052) (0.067) (0.093)
X5 Depreciations /EBITDA -0.019* -0.003 -0.000
(0.010) (0.008) (0.008)
X6 Std Deviation of Growth of Operating Revenue 0.080 0.044 0.045
(0.147) (0.107) (0.114) N Observations 250 250 250 R2 0.270 0.771 F test 8.659*** Breusch-Pagan test 171.703*** Hausman test 6.240
Table 6 - Model with Dependent Variable Y2 Source: Own research
DETERMINANTS OF CAPITAL STRUCTURE: LARGE PORTUGUESE COMPANIES, 1984-1988 M.GONÇALVES
34
Table 7
Dependent Variable: Y3
Independent Variables OLS RE FE
Constant 0.774*** 1.496*** 2.612***
(0.207) (0.313) (0.488)
X1 Total Liquid Assets -0.033 -0.132*** -0.277***
(0.027) (0.040) (0.062)
X2 Growth rate of Total Liquid Assets Value -0.028 0.005 0.017
(0.027) (0.078) (0.018)
X3 EBITDA/ Total Liquid Assets -0.052 -0.075 -0.006
(0.058) (0.040) (0.040)
X4 Tangible Assets/ Total Liquid Assets -0.260*** -0.145 -0.154
(0.072) (0.092) (0.120)
X5 Depreciations /EBITDA -0.010 -0.016 0.016
(0.014) (0.010) (0.010)
X6 Std Deviation of Growth of Operating Revenue -0.140 -0.257* -0177
(0.202) (0.142) (0.147) N Observations 250 250 250 R2 0.074 0.745 F test 10.388*** Breusch-Pagan test 184.683*** Hausman test 15.882**
Table 7 - Model with Dependent Variable Y3 Source: Own research
DETERMINANTS OF CAPITAL STRUCTURE: LARGE PORTUGUESE COMPANIES, 1984-1988 M.GONÇALVES
35
Table 8
List of Companies
1 ALCO - Algodoeira Comercial e Industrial,
S.A. 26 Lisnave - Estaleiros Navais de Lisboa, S.A. 2 Celulose Beira Industrial (CELBI) S.A. 27 MABOR - Manufactura Nacional de Borracha, S.A. 3 Central de Cervejas, E.P. 28 Nacional - Companhia Industrial de Transformação de Cereias, S.A. 4 Cimpor - Cimentos de Portugal, EP 29 Nestle Produtos Alimentares, S.A.
5 Cinca - Companhia Industrial de Ceramica,
S.A. 30 Oliveira & Ferreirinhas - Indústrias Metalurgicas, S.A. 6 Coelima - Indústrias Têxteis, S.A. 31 Petróleos de Portugal, EP – Petrogal
7 Companhia de Celulose do Caima, S.A. 32 Petroquímica e Gás de Portugal, EP 8 Companhia Industrial de Resinas Sintéticas
Cires, S.A. 33 Portucel - Empresa de Celulose e Papel de Portugal EP 9 Companhia Portuguesa do Cobre, S.A. 34 Produits et Engrais Chimiques du Portugal (SAPEC), S.A. 10 Construções Metalomecânicas Mague, S.A. 35 RAR - Refinarias de Açúcar Reunidas, S.A.
11 COTESI - Companhia de Têxteis
Sintécticos, S.A. 36 Renault Portuguesa - Sociedade Industrial e Comercial, S.A. 12 Covina - Companhia Vidreira Nacional, S.A. 37 Salvador Caetano, Industrias Metalurgicas e Veículos de
Transporte, S.A
13 Crisal - Cristais de Alcobaça, S.A. 38 SECIL - Companhia Geral de Cal e Cimento, S.A. 14 EFACEC, Empresa Fabril de Máquinas
Electricas, S.A. 39 Siderurgia Nacional, EP 15 F. Ramada, Aços e Industrias, S.A. 40 Siemens, S.A.
16 Fábrica Têxtil Riopele, S.A. 41 Sociedade Industrial de Vila Franca, S.A. 17 Fábricas Mendes Godinho, S.A. 42 Soja de Portugal, S.A.
18 Fábricas Triunfo, S.A. 43 Sonae - Indústria e Investimentos, S.A.
19 FINICISA - Fibras Sintéticas, SARL 44 Soporcel - Sociedade Portuguesa de Celulose, S.A. 20 Fisipe - Fibras Sintéticas de Portugal, S.A. 45 Sorefame - Sociedades reunidas de fabricações metálicas,
S.A.
21 Ford Lusitana, S.A. 46 Standard Electrica, SARL 22 Hoechist Portuguesa, S.A. 47 Tabaqueira, EP
23 Iberol - Sociedade Ibérica de Oleaginosas,
S.A. 48 Tagol - Companhia de Oleaginosas do Tejo, S.A. 24 INAPA 49 Têxtil Manuel Gonçalves, S.A.
25 Indústrias Têxteis Somelos, SARL 50 Unicer - União Cervejeira, EP
Table 8 - List of Companies Source: Own research