30
Effects of Capital Structure and Profitability on
Corporate Value with Company Size as the Moderating
Variable of Manufacturing Companies Listed on
Indonesia Stock Exchange
Ela Mahdaleta1, Iskandar Muda2, Gusnardi Muhammad Nasir3
1,2Accounting Department of Faculty of Economic and Business, University of Sumatera
Utara Medan-North Sumatera, Indonesia, E-mail: [email protected]
3Accounting Department of Faculty of Teaching and Education Bina Widya Campus,
Simpang Baru Pekanbaru, Indonesia
Abstract This study aims to determine the effect of capital structure and profitability on the corporate value by company size as the moderating variable on manufacturing companies listed on Indonesia Stock Exchange from 2012 to 2014. Variables used in this research are the Capital Structure and Profitability as independent variables, company size as moderating variable and corporate value as the dependent variable. The corporate value in this study was measured using price to book value. This study was performed on manufacturing companies listed on the Indonesia Stock Exchange. This study was conducted on 46 companies that meet the sampling criteria of 135 companies listed on the Indonesia Stock Exchange. The research data were secondary data from the financial statements of 46 companies published in the Indonesia Stock Exchange. The data processing method in this study used multiple linear regression tests and moderating test using residual test by testing classical assumption test beforehand. The results show independent variables have simultaneous significant influence on the corporate value. Meanwhile, partially, Debt to equity ratio has significant negative effect on corporate value, and Return on assets has significant positive effect on corporate value. The moderating test result shows that company size is unable to partially moderate the relationship of debt to equity ratio on the corporate value, and unable to partially moderate the relationship of return on assets on the corporate value.
Key words Capital structure, profitability, company size and corporate value
JEL Codes: D53
1. Introduction
depend on the abilities to generate cash flow, but also on company operations and financial itself (Keown, 2004). The corporate value in question is the amount of price that the investor is willing to pay in case the company is about to be put on sale. The corporate value can reflect the asset value owned by the company, and the higher the corporate value, the better the company image will be. Corporate value is commonly linked to stock price, hence the higher the stock price, the higher the corporate value and vice versa. The share price is the price occurs when the stock being traded in the market.
There are many factors affecting corporate value, including company's capital structure. Capital structure is equity and debt financing in a company that is generally calculated based on the relative size from various sources of funding. The stability of company finance and the risk of failure to settle debts depends on the financing source, the type and number of assets possessed by the company. The setting of good Capital Structure in the company can be used as a reference for the company's financial stability and avoid the risk of default (Subramanyam and Wild, 2010).
The capital structure is a comparison between long-term debt and its own capital. Meanwhile, according to Brigham and Houston (2011), the capital structure is highly important for the company as relates and affects the risks borne by the shareholders as well as the rate of return or the expected profit rate. In other words, in case the company replaces their own capital using debt, or conversely, whether the stock price will change (if the company does not alter other financial decisions such as funding decision, dividend policy, investment decision) or not. It is therefore with proper capital structure, the company's main goal to increase the shareholder value can be achieved.
The previous research undertaken by Sri Hermuningsih (2013) states that the presence of debt for the company can help control the use of excessive and free cash by the management, thus the capital structure also has significant positive effects on corporate value. Meanwhile, Sri and Ary (2013) stated the opposite. It is said that the capital structure negatively affect the corporate value as increasing debt will decrease the corporate value. The results of this research support the theory of capital structure with trade off model which points out that the increasing debt will decrease the corporate value. In the trade-off theory, the company manager will think about the trade-off theory framework between tax savings and the cost of financial difficulties in determining capital structure (Mas'ud, 2009). The description underlies the researcher to examine the relationship of capital structure on the corporate value.
assets, its relationship with sales, total assets, and own capital. The relationship between profitability and corporate value is the higher profitability of the company, the higher the efficiency of the company in utilizing the company's facilities to generate income and will create higher corporate value, and to optimize the shareholders’ wealth. Previous research by Agustina Lastri (2014) shows that the profitability positively and significantly affects corporate value. The profitability of a company can be accessed through a number of ways depending on the profits and assets or the capital to be compared one another. The profitability in this research is proxied through ROA (Return on Assets). Return on Assets is used to assess profitability via the company's assets.
After judging these two factors, the researcher is interested to add the moderating variables. The moderating variable in this study is company size. According to Riyanto (2001), what meant by company size is the size of the company, seen from equity value, the sales value or the value of total assets. Large companies are relatively more stable and better able in generating greater profits than smaller companies. The larger the company size, the easier for the company to enter capital market and obtain high credit ratings from lender; all of which greatly affects the level of profits that will be yielded by the company.
This study focuses on companies in the sector of manufacturing companies listed on Indonesia Stock Exchange. The researcher chose to investigate manufacturing companies as manufacturing industry has rapid development in Indonesia. In addition, manufacturing industry also requires large external funding as it needs substantial funds for the addition of plants and machinery. Thereby, the researcher considers that this research is suitably intended in manufacturing companies. The difference of this research with the previous one is the addition of company size variable as the moderating variable that can strengthen or weaken the relationship of independent variables on dependent variables.
2. Literature review
2.1. Corporate Value
value. The corporate value depends not only on abilities to generate cash flow, but also on the characteristics of the company's operations and finance. There are several ratio analysis approaches according to Brigham and Houston (2001), namely: Price Earning Ratio (PER), Price Book Value (PBV), Market Book Ratio (MBR), Enterprise Value (EV), and Tobin's Q’s Price Earning Ratio (PER) are the price that is willing to be paid if the company is being put on the market, i.e. the comparison between price per share and earnings per share. Market Book Ratio (MBR) is the rating between book value per share and the share market value. Enterprise value (EV) is a market capitalization calculated as market capitalization added with total liabilities, minority interest and preferred shares and later reduced with total cash and cash equivalent.
Tobin's Q is the market value of a company by comparing the market value of a company listed on financial market with a replacement value of the company’s assets. This study employs Price-to-Book value (PBV) as a measuring tool of the corporate value. PBV describes the extent to which the market appreciates the share book value of a company. PBV is the rating of stock price and book value. The book value is the ratio between share equity and the number of circulating shares (Weston and Brigham, 2006). PBV implies the extent to which a company is able to create the corporate value relative to the amount of capital invested (Utama and Santosa, 1998), hence higher PBV ratio shows that the more successful companies are in creating value for shareholders because higher PBV indicates high stock price as well. High stock price reflects high corporate value. The techniques and methods developed to measuring corporate value according to Fama and French (1998) are:
income approach with profit level ratio and profits projection capitalization method;
cash flow approach with discounted cash flow method;
dividend approach with dividend growth method;
asset approach with assets evaluation method;
stock price approach; and
Economic value added approach.
2.2. Capital Structure
Based on the description above, it can be concluded that the capital structure is proportion of usage among short-term debt, long-term debt, preferred stock and common stock for funding the company.
As according to Gittman (2003), the capital structure is a rating of long-term debt and the capital that should be maintained by the company. The company’s management seeks for funding sources besides the company's internal in the fulfillment of company’s activities. According to Hasley (2005) the financial market is a potential source for funding the company. The company considers several matters in seeking financial markets, covering the funding required, sources of funding (the owner or lender), repayment period and funding agreement structure. The influence of financial policy performed by the company surely affects the capital structure contained in the financial statement. The determination of proper capital structure can provide sufficient guarantee on the funds invested by the company, both by investors and creditors. The formulation to find DER may employ the ratio between total debt to total equity as follows (John Wild, 2005).
Debt to Equity Ratio= Total Liabilities (1)
Equity
2.3. Profitability
Profitability is the final result of numerous policies and decisions of the company’s management (Brigham and Houston, 2006). Profitability according to Halim (2007) is a measure of the extent to which the management effectiveness in managing the assets and capital owned by the company to generate profits from the activities done by the company on certain accounting period. The companies having profitability or high rate of return on investment use relatively smaller debt. Higher returns enable the company to finance the majority of their funding needs using internally generated funds. The ROA computation by Wild et al (2005) is as follows:
ROA= Net profit X 100% (2)
Total Asset
2.4. Company Size
Findings from many studies have concluded that the company size becomes an important determinant of capital structure, and many studies find that larger companies use more debt than the smaller ones (Chen and Strange, 2006). It is because the larger a company, the more stable cash flow it has, which can reduce risks of debt use (Chen and Strange, 2006). In addition, larger companies have lower default risks and bankruptcy probability than those of smaller companies (Elsas and Florysiak 2008). With regard to exposure above, the greater the company size, the larger the information available to investors in making investment decision related to company's stock (Siregar and Utama, 2005). The company size in this research is the proxy for total assets logarithm (Nuringsih 2005):
Company size: SIZEit = Ln TAit (3)
3. Methodology or research
The study type was associative causal. According to Erlina (2011), causal research is those aimed to test the hypothesis and the research to explain the phenomenon in the form of relationship between variables. The main objective of this study is to identify causal relationship among various variables.
In addition, it was included as quantitative research. Quantitative research emphasizes on the theoretical testing through the measurement of research variables using numbers and performing data analysis with statistical procedure (Erlina, 2011). This study was aimed to determine whether there was a significant difference between capital structure and profitability on corporate size with company size as moderating variable to manufacturing companies listed on Indonesia Stock Exchange (BEI) in the period 2012-2014.
3.1. Operational Definition
Dependent variables
Dependent variables become a major concern in a study. These variables are affected by independent variables. The dependent or independent variables are those affected or becoming the cause, due to cause variables or independent variables (Erlina, 2011).
corporate value is proxied through Price to Book Value (PBV). PBV ratio is calculated by dividing the market value of the stock divided by the current book value of equity.
PBV Ratio = Price per stock (4)
Book value of equity per stock
Independent variables
The independent variables are those that can affect changes in dependent variables, or those resulting in the variation of the dependent variable and have a positive or negative relationship for dependent variable (Erlina, 2011). The independent variables in this study are Capital Structure and Profitability.
Moderating variable
Moderating variables are those having strong contingent relationship on independent variables and dependent variables. The relationship between the dependent and independent variables are often affected (strengthened or weakened) by moderating variables (Erlina, 2011). Moderating variables in this study is the operating cash flow.
3.2. Population and Samples
A population is a group of entities that may be full of people, events, or objects having certain characteristics within an area and meeting certain requirements related to the research problems (Erlina, 2011). The population in this study is companies included in manufacturing companies listed on Indonesia Stock Exchange (BEI) in the period 2012-2014 amounted to 132 companies. The samples are the part of population used to estimate population characteristics. In selecting the samples, this study uses purposive sampling method. Purposive sampling method is sampling method based on a certain criteria used based on the consideration (judgment) or certain quota (Erlina, 2011). Meanwhile, the criteria established by the writer for the sample selection in in this study are:
1.Manufacturing companies listed on Indonesia Stock Exchange in the period of 2012-2014 during the study period.
2.The Companies issue audited annual financial statements during study period, namely from 2012 to 2014.
3.The companies investigated do not experience the delisting process during the study period.
Based on these criteria, the writer sets 138 company data (46x3 years) included in data of study’s samples.
4. Results
The statistical description of this study as follows:
Table 1. Descriptive Statistics
Source:Software EViews Processing Result (2016)
The Hausman test results as follows:
Table 2. Hausman Test
Source: Software Eviews Processing Result. (2016).
Based on Hausman test result in Table, it is known that probability value is 0.4827. Since the probability value (0.4827)> 0.05, thus the estimation model used is random effect model (REM).
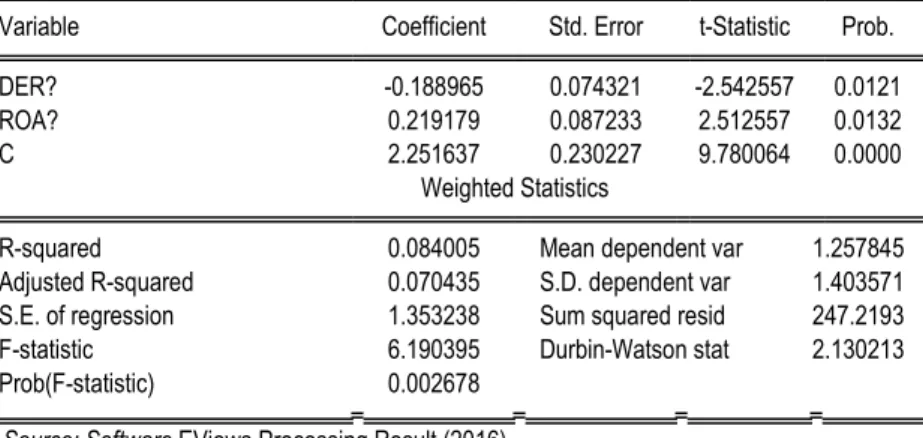
Table 3. Statistical Value of Coefficient of Determination, F Test, and t test
Dependent Variable: PBV?
Method: Pooled EGLS (Cross-section random effects) Date: 04/27/16 Time: 23:32
Sample: 2012 2014 Included observations: 3 Cross-sections included: 46
Total pool (balanced) observations: 138
PBV DER ROA Company Size
Mean 3.994891 3.198188 1.791464 28.19036
Maximum 53.58800 90.70000 86.58000 35.34000
Minimum 0.251000 0.010000 -0.044000 20.61000
Std. Dev. 8.796518 11.62286 9.044760 3.005449
Correlated Random Effects - Hausman Test Pool: DATAPANEL
Test cross-section random effects
Test Summary Chi-Sq. Statistic Chi-Sq. d.f. Prob.
Swamy and Arora estimator of component variances
Variable Coefficient Std. Error t-Statistic Prob.
DER? -0.188965 0.074321 -2.542557 0.0121
ROA? 0.219179 0.087233 2.512557 0.0132
C 2.251637 0.230227 9.780064 0.0000
Weighted Statistics
R-squared 0.084005 Mean dependent var 1.257845
Adjusted R-squared 0.070435 S.D. dependent var 1.403571
S.E. of regression 1.353238 Sum squared resid 247.2193
F-statistic 6.190395 Durbin-Watson stat 2.130213
Prob(F-statistic) 0.002678
Source:Software EViews Processing Result (2016)
Based on Table 3, it is determined that coefficient of determination (R-squared) of R2=0.084. These values can be interpreted as DER, and ROA, able to
simultaneously or jointly affect / explain PBV by 8.4%, while the remaining 91.6% is affected by other factors.
F Test
F test is aimed to test effects of independent variables, jointly or simultaneously on dependent variables. The Prob. (F-statistics) value is determined, i.e. 0.002678 <0.05, thus it can be concluded that all independent variables, namely DER and ROA simultaneously put significant effects on PBV dependent variable.
Table 4. F Test
Source:Software EViews Processing Result (2016)
The t test results as follows:
Variables Probability Value from F Test Significance
Level Interpretation
ROA and DER 0,002678 α=0,05
Effects of ROA and DER, simultaneously affect
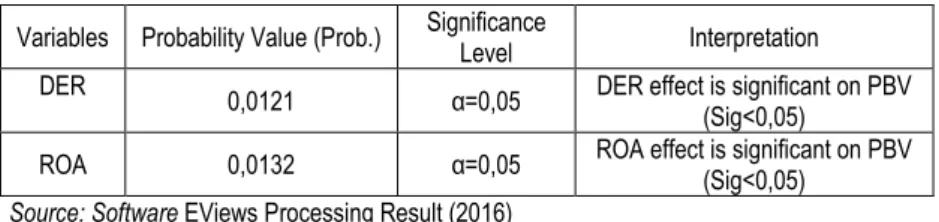
Table 5. t Test
Variables Probability Value (Prob.) Significance
Level Interpretation
DER 0,0121 α=0,05 DER effect is significant on PBV
(Sig<0,05)
ROA 0,0132 α=0,05 ROA effect is significant on PBV
(Sig<0,05)
Source:Software EViews Processing Result (2016)
H1 and H2 can be tested using individual parameter significance test (T-test). The test is conducted to partially test the significance of capital structure and profitability on companies proxied by price to book value. if sig. <0.05 value and ttabel value >
tcount, it can be said that independent variables partially have significant effect on
dependent variables. Based on Table 3, panel data regression equation is obtained as follows.
PBV = 2,251 – 0,1889DER + 0,2191ROA + e
Moderating Test
The statistical moderating test of this study as follows:
Table 6. Moderating Test
Source: SPSS Software Processing Result (2016)
A variable is said to be moderate independent variables if the coefficient regression of independent variables is negative and significant (Ghozali, 2013). Note that since PBV regression coefficient is positive (0.043) and significant (0.029 <0.05), the company size is incapable of moderating the relationship between debt to equity ratio on price to book value.
Coefficientsa
Model Unstandardized Coefficients
Standardized
Coefficients t Sig.
B Std. Error Beta
1 (Constant) 2.042 .187 10.946 .000
PBV .043 .019 .186 2.207 .029
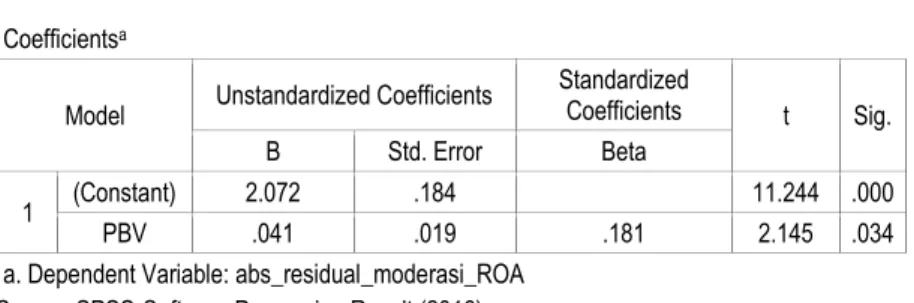
Table 7. Moderating Test II
Source: SPSS Software Processing Result (2016)
A variable is said to be moderate independent variables if the coefficient regression of independent variables is negative and significant (Ghozali, 2013: 172). Note that since regression coefficient of PBV is positive (0.041) and significant (0.034 <0.05), the company size is incapable of moderating the relationship between return on assets on price to book value.
5. Conclusions and suggestions
5.1. Conclusions
1.DER variables are known to negatively affect PBV. In other words, the higher/ increased DER, the more the tendency for decrease in PBV. DER variables are known to have a significant effect on PBV. Thus, DER variable significantly and negatively affects PBV. The result is contrary to previous study by Arindita (2015) stating that debt to equity ratio does not affect price to book value.
2.It is known that ROA variable positively affects PBV. In other words, the higher/ increased DER, the more the tendency for increase in PBV. ROA variables are known to have a significant effect on PBV. Thus, DER variable significantly and positively affects PBV. The result is in line with previous study by Arindita (2015) stating that return on assets affects price to book value.
3.DER and ROA variables have significant simultaneous effects on PBV.
4.The company size is insignificant in moderating the relationship of DER on PBV. 5.The company size variable is insignificant in moderating the relationship of ROA on PBV.
5.2. Suggestions
Based on the analysis results of this study, it is suggested for future researchers to add other variables theoretically related to PBV; the scope of the study should also be broadened, hence the research results can be more representative of the real situation.
Coefficientsa
Model Unstandardized Coefficients
Standardized
Coefficients t Sig.
B Std. Error Beta
1 (Constant) 2.072 .184 11.244 .000
PBV .041 .019 .181 2.145 .034
References
Ang, R. (1997). Book Smart: Indonesia Capital Market, Soft Media Indonesia. Jakarta.
Ari and Sri, (2013). Analysis of Financial Performance Comparison with Conventional Banking Islamic Banking, Journal of Economics and Entrepreneurship 13(1): 100-115.
Arindita, G. (2015). Analysis of Effect of Capital Structure, Profitability, Dividend Policy and Corporate Value On the Size of the Company Whosale and Retail Dibei, Thesis, University of Diponegoro, Semarang. http://eprints.undip.ac.id/ acceses on January 06, 2016.
Ayu and Ary, (2013). The influence of the capital structure, profitability, and the size of the company in the value of the company, Journal of Accounting. 4(2): 358-372. Brigham, E.F. and Houston, (2001). Fundamentals of Financial Management, Salemba Four, Jakarta.
Bringham, and Houston (2011). Fundamentals of Financial Management, Book 2 editions of 11, Salemba Four, Jakarta.
Chen, S., and Strange, R. (2005). The Determinants of Capital Structure: Evidence from Chinese Listed Companies. Economic Change and Restructring, 38(1): 11-35. Christie, Y. (2014). Analysis of Factors Affecting Capital Structure with company size as Moderating Variable On Property Company and RealEstate Dibei, Thesis, University of Diponegoro, Semarang. http://eprints.undip.ac.id/ acceses on January 06, 2016.
Daulay, P.R. (2014). Cash Flow and Profitability Effect Against Company Value in Manufacturing Companies Listed on the Stock Exchange. Thesis University of North Sumatra.
Djohanputro (2008). The corporate risk management. Indeks Publisher. Jakarta. Elsas, R., and Florysiak, D. (2008). Capital Structure Empirical Research: New Ideas, Recent Evidence, and methodological Issues. Discussion Paper at the Munich School of Management, Munich.
Erlina, (2011). Research Methodology, USU Press, Medan.
Gitman, L.J. (2003). Principles of Managerial Finance, International Edition, 10th edition, Pearson Education, Boston.
Ghozali, I. (2006). Applications Multivariate Analysis with SPSS Program, the Agency Publisher Diponegoro University, Semarang.
Handayani (2011). Factors Affecting Capital Structure on Manufacturing Company. Journal Public Sector Business and Accounting, 13 (1), 39-56.
Halim, A. (2007). Financial management business. Ghalia Indonesia Publisher. Bogor.
Hermuningsih, S. (2013). Effect of Profitability, Growth Opportunity, sruktur Against Capital Company Values In Public Company in Indonesia. Thesis University of Sarjanawiyata Park students, Yogyakarta.
Higgins, R.C. (2004). Analysis for Financial Management, 5th Edition, McGraw-Hill Book Co. Singapore.
Gujarati, D. (2003). Basic Econometrics. Translation: Sumarno Zain Translator, Erlangga Publisher. Jakarta.
Jogiyanto, S.H. (2003). Portfolio Theory and Investment Analysis, BPFE Publisher, Yogyakarta.
Keown, et al., (2004). Principles and Applications Financial Management, Index Publisher, Jakarta.
Lastri, A. (2014). "Effect of Profitability, Growth Opportunity and Capital Structure Of Company Value (Studies in Banking Companies Listed on the Stock Exchange Period 2011-2013)". Thesis University of Brawijaya, Malang.
Lubis, A.F., Akhmad A. and Firman S. (2007). Application of SPSS (Statistical Product and Service Solutions) for the preparation of Thesis, USU Press, Medan. Margaretha and Ramadan (2010). Factors Affecting the Capital Structure of Manufacturing Industry in Indonesia Stock Exchange. Journal of Business and Accounting, 2(12). 34-45.
Martono and Agus H.D. (2005). Financial Management Ekonisia Publisher, Yogyakarta.
Mas'ud M. (2009). Determinants of capital structure and its impact on the company value Journal of Management and Business; 7(1), pp. 82-99.
Munawir (1995). Financial Statement Analysis, Fourth Edition Prints Fifth, Liberty Yogyakarta, Yogyakarta.
Nachrowi (2005). Popular and Practical Approaches Econometrica for Economic and Financial Analysis, Issuing University of Indonesia, Jakarta.
Novrita, R. (2013). Profitability Effect on Firm Value with the Dividend Policy as an intervening variable in Manufacturing Companies Listed in Indonesia Stock Exchage. Thesis. University of North Sumatra.
Nuringsih, K. (2005). Analysis of Effect of Managerial Ownership, Debt Policy, ROA and size of the Company's Dividend Policy, 1995-1996 Studies. Journal of Accounting and Finance Indonesia, 2(2);103-123.
Pratomo, A. and Paidi W.H. (2010). Guidelines for Practical Use of Eviews in Econometrics, Second Edition. USU Press, Medan.
Rosalinawati, N. (2015). Effect of Capital Structure on the Performance of Listed Indonesia Stock Exchage Companies, Thesis, University of Diponegoro, Semarang. Rosita, T. (2006). Effect of Managerial Ownership, Debt Policy, profitability, company size and investment opportunities on dividend policy. Thesis University of North Sumatra.
Riyanto (2001). Fundamentals of Company Spending, Fourth Edition, Yogyakarta. Subramanyam, K.R and Wild, J.J. (2010). Analysis of the Financial Statements. The translator Suriyanti, Book 2, Salemba Four, Jakarta.
Sari, Y. (2010). The relationship between the readiness to learn and how to learn to learning outcomes Accounting class XI IPS SMAN 7 semester of academic year 2009/2010 Bandar Lampung. Thesis. University of Lampung: Bandar Lampung. Sihombing, G. (2008). So Rich and Smart Trader & Investor Shares, First Edition, Smart Indonesia, Yogyakarta.
Situmorang, M. (2010). Effect of Asset Structure, Profitability and Size of the Company's capital structure in Manufacturing Companies of Listed Indonesia Stock Exchage. Thesis. University of North Sumatra, Medan.
Tryfino (2009). How smart investing in shares, issue 1, Transmedia Library Publisher, Jakarta.