Eduardo Alexandre Pereira da Silva
Effects of radiation on the molecular
dynamics of
Universidade do Minho
Escola de Ciências
Outubro de 2017 Eduar do Silva Minho | 20 1 7 UPseudomonas aeruginosa
Ef fects of radiation on t he molecular dynamics of Pseudomonas aeruginosaEduardo Alexandre Pereira da Silva
Effects of radiation on the molecular
dynamics of
Pseudomonas aeruginosa
Universidade do Minho
Escola de Ciências
Dissertação de Mestrado em Bioquímica Aplicada
Ramo de Biotecnologia
Trabalho efetuado sob orientação do
Professor Doutor Pedro M. Santos
ii
Declaração
Nome:
Eduardo Alexandre Pereira da Silva
Endereço eletrónico: [email protected] Telefone: 968 556 813
Número de Identificação Civil:14363545
Título da Dissertação de Mestrado:
Effects of radiation on the molecular dynamics of Pseudomonas aeruginosa
Efeitos da radiação na dinâmica molecular de Pseudomonas aeruginosa
Orientador:
Professor Doutor Pedro M. Santos
Ano de conclusão: 2017
Designação do Mestrado:
Mestrado em Bioquímica Aplicada, especialização em Biotecnologia.
É AUTORIZADA A REPRODUÇÃO INTEGRAL DESTA DISSERTAÇÃO APENAS PARA EFEITOS DE INVESTIGAÇÃO, MEDIANTE DECLARAÇÃO ESCRITA DO INTERESSADO, QUE A TAL SE COMPROMETE.
Universidade do Minho, ___/___/________
iii
Agradecimentos
Em primeiro lugar gostava de agradecer ao meu orientador, Professor Pedro Santos por a oportunidade de realizar este trabalho e fazer parte do seu grupo de investigação. Agradeço também toda a orientação dada, não só pelo professor, mas também pelos restantes membros do grupo principalmente a Cristina e o Pedro! Foi um ano onde aprendi e cresci bastante e desejo sinceramente a todos o melhor para o futuro.
Á Universidade do Minho que me acolheu durante estes últimos anos e onde deixo das melhores memórias que fiz até a data. Não posso também deixar de agradecer ao departamento de Biologia, em especial ao CBMA, local onde realizei este trabalho. A toda a equipa técnica e a todas as pessoas do LBM e LGM desejo o melhor, gente impecável e acessível foi um prazer trabalhar convosco!
A todos os amigos que fiz ao longo destes anos, sem vocês definitivamente não seria quem sou hoje e nada disto teria sido possível. Devo um agradecimento especial ao Daniel Cerqueira, João Rainha, João Sequeira e Pedro Montenegro. Foi uma Saga que começou há cinco anos e espero que dure muitos mais!
A todos os membros da minha família que me apoiaram quando eu mais precisava e me impediram de ingressar por caminhos menos corretos. Agradeço especialmente ao meu irmão, Ricardo Silva, sem o qual muito definitivamente este documento não existiria. Mais do que um laço de sangue inevitável, uma amizade que escolheria todos os dias.
iv
Abstract
Effects of radiation on the molecular dynamics of Pseudomonas aeruginosa
Pseudomonas aeruginosa, an opportunistic pathogen known to cause a variety of nosocomial infections, is a rod-shaped gram-negative bacterium known for its metabolic versatility and ability to thrive in extreme conditions. This ability is due to an array of systems and molecular tools that allow it to respond to different kinds of stress by active modulation of antibiotic resistance, metabolic and secretory related systems among others. As such, P. aeruginosa can be considered an example of cellular molecular dynamism.
In this study, the effect of radiation in the form of visible light on the molecular dynamics of this organism will be studied by means of a quantitative proteomics approach using two-dimension electrophoresis. For this effect two conditions were established namely Light, where cells were grown in a constant presence/intensity of visible light, and Dark, where cells were grown in total absence of light. Posteriorly, cytosolic protein extracts were obtained, subjected to two-dimension electrophoresis and intensity of separated proteins compared using appropriate software. With the objective of identifying proteins with significant differences in expression between the two conditions, comparison of spot spatial distribution and local/global patterns of obtained gels with a collection of published two-dimension gels of organisms from the Pseudomonas genus was carried out to obtain a proteome reference map with identity attributed to several spots at an acceptable degree of confidence. A total of 56 unique spots were identified using this methodology.
Immediately at the cell harvesting stage some differences were observed, mainly more accentuated pigmentation observed in the Light condition. Regarding the proteomic analysis, a total of 31 spots, with 9 having been identified base on the proteome reference map built, were shown to have statistically significant expression changes. Furthermore, 7 of the 9 spots have been reported to be directly or indirectly involved in response to oxidative stress, which light exposition has been known to cause in some bacteria (e.g. Staphylococcus aureus, Escherichia coli, P. aeruginosa). However, the role of light in the difference of pigmentation observed is still unknown and requires further investigation. In the future, additional molecular biology approaches complemented with phenotypic studies may lead to further insight into the role of light as a regulator/stimulus in P. aeruginosa
v
Resumo
Efeitos da radiação na dinâmica molecular de Pseudomonas aeruginosa
Pseudomonas aeruginosa, um agente patogénico oportunista conhecido por causar uma variedade de infeções nosocomiais, é uma bactéria gram-negativa metabolicamente versátil com a habilidade de prosperar em condições extremas. Esta habilidade é devida a uma matriz de sistemas e ferramentas moleculares que permitem resposta a vários tipos de stress por modulação ativa de sistemas relacionados com resistência a antibióticos, metabolismo e secreção e outros. P. aeruginosa pode então ser considerada um exemplo de dinamismo molecular a nível celular.
Neste trabalho, o efeito de radiação sob a forma de luz visível na dinâmica molecular deste organismo será estudado recorrendo a uma abordagem de proteómica quantitativa usando eletroforese bidimensional. Para este efeito duas condições foram estabelecidas nomeadamente Luz, onde as células foram crescidas em presença/intensidade de luz constante, e Escuro, onde as células foram crescidas em ausência total de luz. Posteriormente extratos proteicos citosólicos foram obtidos, sujeitos a eletroforese bidimensional e a intensidade das proteínas separadas comparada entre as duas condições usando software apropriado. Com o objetivo de identificar diferenças significativas e expressão proteica entre as duas condições foi comparada a distribuição espacial de spots e padrões locais/globais dos géis obtidos contra uma coleção de géis de eletroforese bidimensional publicados de organismos do gênero Pseudomonas de forma a obter um mapa de referência do proteoma com identidade atribuída a várias spots com um grau de confiança aceitável. Um total de 56 spots únicas foram identificadas usando esta metodologia.
Já na fase de colheita celular diferenças foram observadas, principalmente pigmentação mais acentuada na condição Luz. Na analise de proteómica, um total de 31 spots mostram ter mudanças de expressão estatisticamente significativas, sendo que destas 9 foram identificadas com base no mapa de referencia do proteoma construído. Além disso, 7 das 9 spots foram reportadas como estando envolvidas direta ou indiretamente em resposta a stress oxidativo, o qual é sabido ser induzido por exposição a luz em algumas bactérias (e.g. Staphylococcus aureus, Escherichia coli, P. aeruginosa). No entanto, o papel da luz na diferença de pigmentação observada é ainda desconhecido e requer investigação mais aprofundada. No futuro, abordagens adicionais de biologia molecular complementadas com estudos fenotípicos poderão resultar em maior conhecimento sobre o papel da luz como um regulador/estímulo em P. aeruginosa.
vi
Table of contents
Declaração ... ii Agradecimentos ... iii Abstract ... iv Resumo ... vList of Abbreviations and Acronyms ... ix
List of Figures ... xi
List of Tables ... xv
Introduction ... 1
1.1-Bacteria, adaptive life forms ... 2
1.2-Pseudomonas aeruginosa, an Overview ... 4
1.2.1-The Genus Pseudomonas ... 4
1.2.2-P. aeruginosa in a clinical context ... 4
1.2.3-P. aeruginosa at a genomic level ... 5
1.2.4-Antibiotic resistance in P. aeruginosa ... 6
1.2.5-Virulence of P. aeruginosa... 8
1.2.6-Quorum sensing system (QS) and Secretion pathways of P. aeruginosa ... 10
1.2.7-P. aeruginosa, a model for studying adaptation ... 12
1.3-Light, an ever-present abiotic factor ... 13
1.3.1-Light and radiation in microbiology ... 13
1.3.2-Bacteriophytochrome receptor PaBphP, evidence of a light-regulated system ... 15
1.4-Proteomics, a brief overview ... 18
1.4.1-Systems Biology, the beginning of the age of Omics ... 18
1.4.2-Proteome and Proteomics, a brief introduction ... 19
vii
1.5.1–Basics of 2D-E technique ... 21
1.5.2–Sample collection and preparation for 2D-E ... 23
1.5.3–Analysis of 2D-E Gels ... 27
Aims ... 30
Material and Methods ... 32
3.1-List of growth media and solutions ... 33
3.2-Growth and harvest of P. aeruginosa PAO1 strain cells and supernatant in total absence (Dark) or presence of constant Light at 4000 lumens (Light) ... 34
3.3–2D-E analysis of P. aeruginosa PAO1 cytosolic proteome in Light/Dark condition ... 34
3.3.1-Preparation of cytosolic protein extract of P. aeruginosa PAO1 ... 34
3.3.2-Quantification of protein extracts by modified-Lowry method ... 34
3.3.3-Protein quantification confirmation and sample integrity verification by SDS-PAGE ... 35
3.3.4-Clean-up of protein samples by TCA/DOC + acetone precipitation ... 36
3.3.5-Isoelectric focusing of processed samples (first dimension) ... 37
3.3.6-SDS-PAGE of samples separated by IEF (second dimension) ... 38
3.3.7-Gel staining using Coomassie brilliant blue G-250... 39
3.3.8-Image acquisition and treatment using Image Master 2-D Platinum software39 3.3.9-Construction of a P. aeruginosa PAO1 proteome reference map ... 40
Results ... 42
4.1-Preparation of P. aeruginosa PAO1 cytosolic protein extracts ... 43
4.2-Optimization of protein sample clean-up by TCA/DOC precipitation + acetone wash ... 45
4.3-Analysis of the effect of Light/Dark condition on the dynamic of P. aeruginosa PAO1 cytosolic proteome by quantitative proteomics ... 47
viii
4.3.2.-Comparison of the total proteome of different Pseudomonas organisms... 49
4.3.4-Building of a P. aeruginosa PAO1 proteome reference map ... 51
4.3.5-Differential quantitative analysis of obtained 2D-E gels (Light vs Dark) ... 54
Discussion ... 57
Future perspectives ... 66
References ... 71
ix
List of Abbreviations and Acronyms
2D-E Two-dimension electrophoresis
ADI Arginine deiminase
aPDT Antimicrobial photodynamic therapy
APS Ammonium persulfate
BSA Bovine serum albumin
BV Biliverdin
CF Cystic fibrosis
CHAPS 3-[(3-cholamidopropyl) dimethylammonio] -1-propanesulfonate
CK Carbamate kinase
ddH2O Deionized water
DOC Deoxycholate
DTT Dithiothreitol
GAF cGMP phosphodiesterase/adenyl cyclase/FhlA
HK Histidine Kinase
HPLC High-performance liquid chromatography
IAA Iodoacetamide
IEF Isoelectric focusing
IPC International Pseudomonas consortium
IPG Immobilized Polyacrylamide Gel
LB Lysogeny broth
LPS Lipopolysaccharide
x
MudPIT Multidimensional Protein Identification Technology
Mw Molecular weight
OCT Ornithine transcarbamoylase
PaBphP Pseudomonas aeruginosa bacterialphytochrome receptor
PAS Per-ARNT-Sim
PATRIC Pathosystems Resource Integration Center
PCD Photosensory core domain
PHY Phytochrome
pI Isoelectric point
PPI Pixels per inch
QS Quorum Sensing
ROS Reactive oxygen species
SDS Sodium dodecyl sulfate
TCA Trichloroacetic acid
TEMED Tetramethylethylenediamine
xi
List of Figures
Figure 1-Blast-based comparison of P. aeruginosa PAO1 genome with P. aeruginosa LESB58 (red outer circle) and PA14 (green outer circle). Inner circles represent GC content (black) and GC skew (purple and green). Genome were obtained at Pseudomonas Genome Database website (http://www.pseudomonas.com) and blast-based comparison built using CG viewer (Grant JR et al. 2008). ... 5
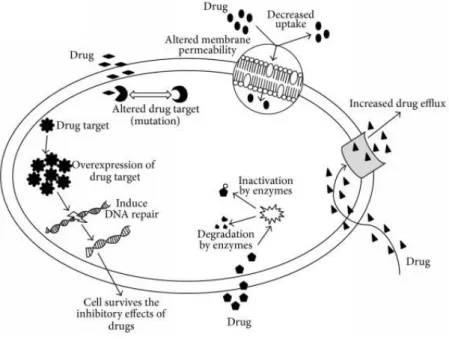
Figure 2-Schematic representation of some of the antibiotic resistance mechanisms listed previously. Cells may contain different combination of the mechanisms represented above being that resistance to certain arrays of antibiotics may result from a single or a number of combinations of these different mechanisms. Adapted from (Tanwar, Das, Fatima, & Hameed, 2014). ... 7
Figure 3-Electromagnetic spectrum highlighting the various regions that divide it and the relation between wavelength, energy, and frequency. Adapted from https://imagine.gsfc.nasa.gov/science/toolbox/emspectrum1.html. ... 13
Figure 4-Simplified scheme of the photochemical reaction that occurs in aPDT. Briefly, visible light excites a photosensitizer previously administrated. This photosensitizer will react with cellular oxygen originating cytotoxic compounds leading to cell damage and death. The arrows reflect the flow of electrons during the photochemical reactions. ... 14
Figure 5-Crystal structure of wild-type PCD. (A) Diagram of the dimeric PaBphP-PCD structure. PAS, GAF, and PHY domains of one monomer are highlighted in yellow, green, and blue, respectively. Helices in the GAF and PHY domains are identified by letters A to E. (B) The PAS, GAF, and PHY domains are integrated by interdomain interactions and converge on the chromophore binding site (cyan). Image adapted from (Yang et al., 2008). ... 16
Figure 6-Model of the full-length dimeric PaBphP bas on the PaBphP-PCD dimer structure and the sensor HK structure (PDB accessionID 2C2A) (PAS, GAF, and PHY in green; HK in blue; BV in cyan,). Adapted from (Yang et al., 2008). ... 17
Figure 7-The Central Dogma of molecular biology. Generally, the flow of information is in the direction highlighted in yellow. From DNA to RNA to protein, however some exceptions (highlighted in orange) exist in nature due to the action of special enzymes such DNA Reverse Transcriptase. The actual discovery of these “special” information flows have led to the development of popular techniques. ... 18
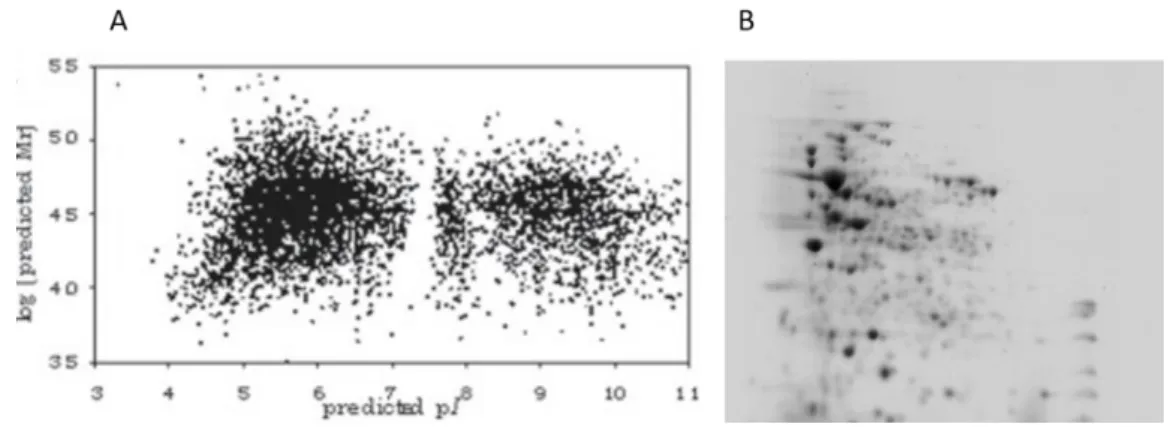
Figure 8-A –Theoretical representation of expressed proteins by P. aeruginosa PAO1 mapped by Mw vs pI. B – A representation of the P. aeruginosa PAO1 proteome obtained in this
xii
study. As can be seen there is remarkable difference between the two representations that can be attributed to various reasons. Image adapted from (Lecoutere et al., 2012) ... 20
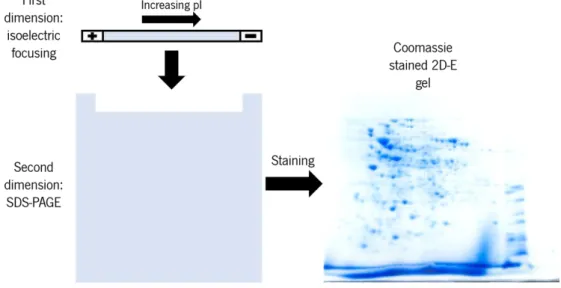
Figure 9-Representation of protein separation in 2D-E electrophoresis. Initially after IEF (first dimension) protein are separated by their pI. Following SDS-PAGE (second dimension) protein are separated by an additional factor this being Mw. Proteins are then present in the gel, under the forms of spots, bidimensionally. ... 22
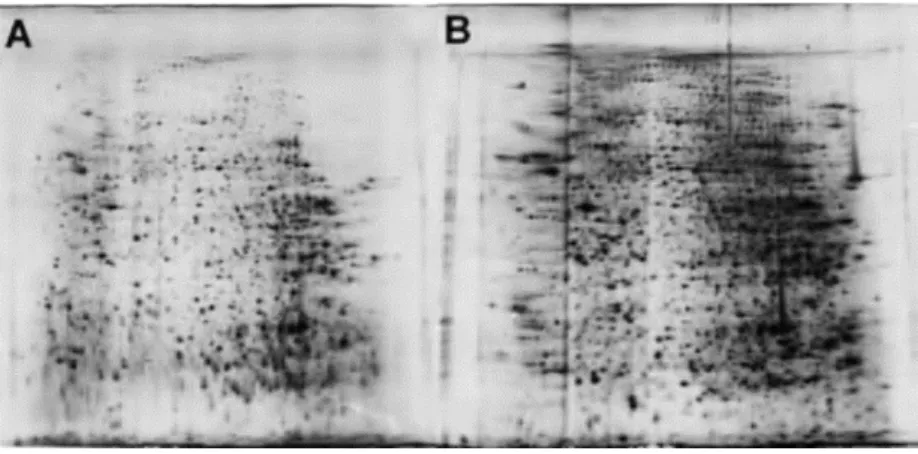
Figure 10-2D-E of rat liver extracts. In A no thiourea was used in the buffer solution, while in B thiourea was used as a buffer component at 2 Mol/L. As can be observed B contains more spots however there is heavy visible streaking and spot blurring in what corresponds to the acidic zone of the gradient. Image adapted from (R Westermeier et al., 2008) ... 24
Figure 11-2D-E of rat tongue tissue. A – Crude was used. B - Extract treated with a commercial 2D-E clean-up kit. In case A the salt content was so high that the bromophenol Blue used as dye did not begin to migrate. In case B after a clean-up treatment a well resolved 2-D spot pattern was obtained. Image adapted from (R Westermeier et al., 2008) ... 25
Figure 12-A – Horizontal streaking associated with under focusing of protein sample. B- Horizontal streaking associated with over focusing of the protein sample Image adapted from http://www.proteinsandproteomics.org/content/free/protocols_1/pro03.html. ... 26
Figure 13-A - The presence of bubbles in the contact zone between the focusing strip and the second-dimension gel may lead to vertical streaking in that zone through the whole gel. B - Horizontal streaking association with insufficient strip equilibration time prior to second dimension run. Insufficient equilibration time may lead protein aggregation or insufficient SDS-binding which results in a smear like streak. Image adapted from http://www.proteinsandproteomics.org/content/free/protocols_1/pro03.html. ... 27
Figure 14-Basic steps for 2D-E image analysis using available commercial software. ... 27 Figure 15-Example of the matching procedure carried out for spot identification using published 2D-E gels containing identified spots (A) by pattern similarity to 2D-E gels obtained during this study (B). Briefly, published 2D-E gels were screened for identified spots and posteriorly spot spatial distribution and patterns (orange, green and red rectangles) were compared to our obtained gels. When local and global pattern disposition observed in both gels (A and B) is equal spots were assumed as having the same identity. A – Partial 2D-E gel image from P. aeruginosa PAO1 cytosol adapted from Hanna et al. 2000 B – Partial 2D-E gel image from P. aeruginosa PAO1 cytosol obtained during this study (Light condition). ... 40
xiii
Figure 16-P. aeruginosa PAO1 culture grown in Light condition (A) and Dark condition (B) As can be easily verified looking at the figure, culture A presents significant Blueish-green pigmentation while culture B does not. To simplify the images only one culture of each condition is shown however this difference was verified across all cultures grown (a total of 3 for each condition). ... 43
Figure 17-SDS-PAGE of protein extracts FL, FD, EL and ED. SDS-PAGE run was performed on a 10% polyacrylamide gel at 50 volts for 20 minutes, followed by 40 minutes at 200 volts. A – F extract; B – E extract; L20 – 20 µg of Light condition protein extract; D20 – 20 µg of Dark condition protein extract... 44
Figure 18-Schematic representation of an experiment designed to test precipitation method/quantification quality. ... 45
Figure 19-SDS-PAGE gels of the various samples prepared from extract A and B. A total of 20 µg of protein was loaded into each well. A and B 100 – 20 µg of samples prepared by precipitation of 100 µg of protein and direct re-solubilization in Urea loading buffer; A and B 200,400 and 600 – 20 µg of a samples prepared according to method 1, quantified and an equivalent to 40 µg re-precipitated and resuspended in urea loading buffer. ... 46
Figure 20-SDS-PAGE gels of the various samples prepared from extract A and B. A total of 20 µg of protein was loaded into each well. A and B 600 – 20 µg of a sample prepared according to method 2 quantified and an equivalent to 40 µg re-precipitated and resuspended in urea loading buffer, ‘- second replicate, ‘’- third replicate. ... 46
Figure 21-2D-E images of Gels (7cm) obtained from the two cytosolic protein extracts (E and F) used. For each extract one gel of each condition is presented. A – E extract Gel (Light condition); B – E extract Gel (Dark condition); C – F extract Gel (Light condition); D – F extract Gel (Dark condition). As can be observed in the image the spots patterns of corresponding conditions between different protein extracts match, which corroborates the existence of differences independent of biological variation and as such a consequence of the different conditions studied. ... 47 Figure 22-2D-E images of Gels (7cm) obtained from the two cytosolic protein extracts (E and F) used after spot detection and artifact removal. For each extract one gel of each condition is presented. A – E extract Gel (Light condition); B – E extract Gel (Dark condition); C – F extract Gel (Light condition); D – F extract Gel (Dark condition). detected spots are represented by a red +. ... 48
xiv
Figure 23-Proteome comparison between P. aeruginosa and other Pseudomonas obtained by use of PATRIC Proteome comparison web service. This tool compares the proteome of target organism by uni- and bi-directional BLAST. As can be seen by analyzing the image’s color key, total Protein sequence identity percentage ranges from 70% to ≈ 99.8 to 99.9%. ... 50
Figure 24-Cytosolic proteome reference map for P. aeruginosa PAO1 built from pattern analysis of various 2D-E gels belonging to different Pseudomonas. Spot identities and other relevant data are presented in Table 11. This reference map was built using a 2D-E gel from the Light condition (Extract E) as base. ... 51
Figure 25-Mapping of unidentified spots with statistically significant fold change values, by the Kolmogorov-Smirnorv test (D value must exceed Dcritical=0.454), within the cut-off value of 1.4. A
total of 22 spots were found to fit the prerequisites. While no direct implication since these spots are not identified, they are still a testament to the dynamic change in cytosolic proteome between the two conditions. ... 55
Figure 26-Schematic representation of ADI pathway. L-Arginine by the action of the three enzyme ADI, OTC and CK will be degraded originating ATP, CO2, ammonia, and ornithine. Ornithine
will then by action of anti-porter ArcD by exchanged by a new molecule of Arginine. Image adapted from (Lolkema, 2015). ... 62
Figure 27-2D-E images of Gels (18 cm) obtained from cytosolic protein extract E. One gel of each condition is presented in this image. A – E extract Gel (Light condition) B – E extract Gel (Dark condition). By observing the images, a disparity in total protein quantity between the gels exists being that Gel B contains severely less protein amount. ... 67
Figure 28-2D-E images of Gels (18cm) obtained from cytosolic protein extract E after spot detection and artifact removal. One gel of each condition is presented. A – E extract Gel (Light condition); B – E extract Gel (Dark condition). Detected spots are represented by a red +. ... 68
Figure A1-Growth curves obtained for P. aeruginosa PAO1 represented in the form of Ln (OD 600 nm) vs Time. Two independent growth curves were obtained from independent cultures at different time frames. ... 91
Figure A2-All Dark condition 2D-E gels obtained during this study. A – Gels using E protein extract B- Gels using F protein extract. ... 91
Figure A3-All Light condition 2D-E gels obtained during this study. A – Gels using E protein extract B- Gels using F protein extract. ... 92
xv
List of Tables
Table 1-Summary of P. aeruginosa virulence factors and pathogenic function. Virulence factor are divided into cell-associated virulence factors and extracellular virulence factors as described above. Adapted from (Strateva & Mitov, 2011). ... 9
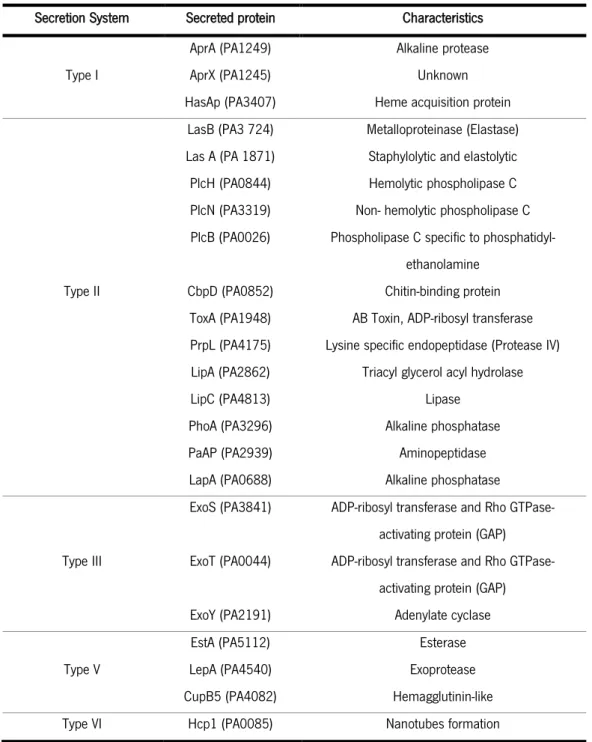
Table 2-List of secreted proteins and their correspondent secretion pathways determined experimentally (adapted from Bleves et al 2010). ... 11
Table 3-Short exemplary list of adaptation to several external factors conducted in P. aeruginosa. The title of the study, external factor used and main conclusions are presented... 12
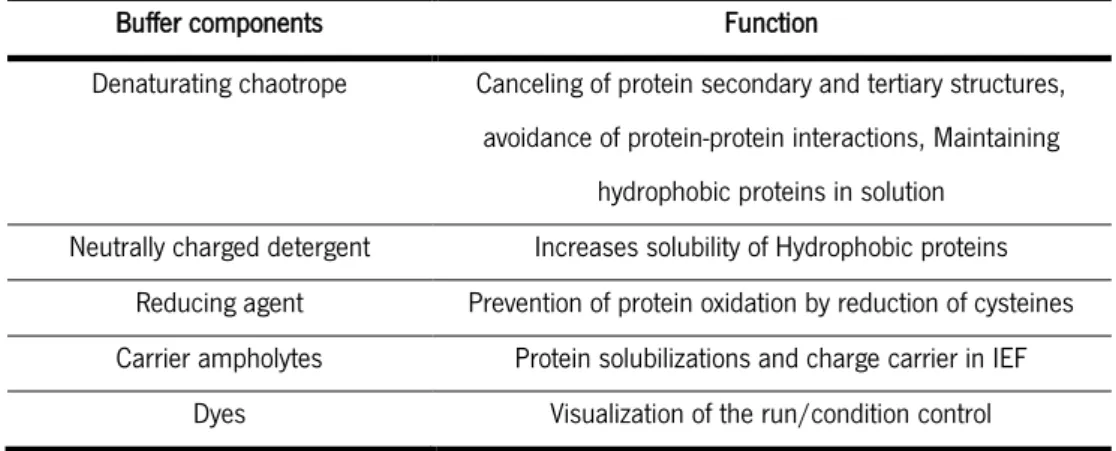
Table 4-Typical components of buffers used for IEF. Depending on the type of sample the identity of these components may vary. ... 23
Table 5-Gel components and volumes of running and stacking gels used for SDS-PAGE 36 Table 6-IEF program for 7 cm and 18 cm IPG pH 3-10 NL strips ... 38 Table 7-Protein concentrations of the processed extracts obtained by modified-Lowry quantification method. As can be observed extracts from the Light condition present higher protein concentration values. E, F, – independent P. aeruginosa PAO1 cultures, L – Condition Light, D – Condition Dark ... 43
Table 8-Table containing spot identification data of a cytosolic proteome reference map of P. aeruginosa PAO1. In this table spot number in the reference map (Spot Number), proposed identity (Identification) and corresponding references (Reference) are presented. ... 52
Table 9-Identified spots using the Protein reference map previously constructed. Only spots considered statistically significant by the Kolmogorov-Smirnorv test (D value must exceed Dcritical=0.454, for p-value < 0.05), with a fold-change value of at least 1.4 are presented in this table.
Spot number, proposed identity, intensity values in both conditions, fold change value as well as Kolmogorov-Smirnorv D value are presented. A total of 9 spots with proposed identity were found to fit the prerequisites. ... 54
Table 10-Intensity values of unidentified spots present in Light and Dark conditions. Only spots considered statistically significant by the Kolmogorov-Smirnorv test (D value must exceed Dcritical=0.454 for p-value < 0.05), with a fold-change value of at least 1.4 are presented in this table.
Spot number, identity, intensity values in both condition, fold change value as well as Kolmogorov-Smirnorv D value are presented. A total of 22 spots were found to fit the prerequisites ... 56
xvi
Table 11-List of the 9 spots with significant fold-change values identified using the previously built proteome reference map. Spot number, Proposed Identity, and Biological function are presented. ... 60
Table A1-Table containing relevant data regarding spot identification used to build a cytosolic proteome reference map of P. aeruginosa PAO1. In this Table proposed identity (Identification), organism associated with 2D-E gel used for spot identification (Organism), respective reference and finally Locus Tag associated with a specific database are presented *PGD – Pseudomonas Genome Database(Winsor et al., 2016). $ Locus Tag for protein with similar function in P. aeruginosa PAO1. ... 92
1
2
1.1-Bacteria, adaptive life forms
Bacteria constitute a domain of prokaryotic organisms. These microscopic beings come in numerous shapes and inhabit most of the globe being present in an extreme variety of habitats (Garcia-Descalzo, Alcazar, Baquero, & Cid, 2012; Persat et al., 2015; Young, 2007).Being able to live in extreme conditions bacteria can be found in places such as artic glaciers, volcanic hot springs and even environments of extreme salinity (e.g. Dead Sea), displaying proprieties that enable their survival in places seemingly inhospitable to life (Foght et al., 2004; Kimble, Mandelco, Woese, & Madigan, 1995; Tapilatu et al., 2010). Although bacteriology has been a major field of research for quite some time even now most bacteria are uncharacterized, as the vast majority has yet to be successfully cultivated in a laboratory environment (Handelsman, 2005).
Bacteria exhibit a wide variety of metabolic types from phototropic to organotrophic, being able to convert several sources/compounds into energy (Liba et al., 2006; Tonolla, Peduzzi, Demarta, Peduzzi, & Hahn, 2004; Winkler et al., 2012). The mechanisms that confer movement, the ability to function as multicellular aggregates known as biofilms, various secretion mechanisms, metabolic pathway diversity and ability to transfer genetic material among others, associated with years of evolution and several adaptation processes shaped bacteria to their current state as the most abundant life form on the planet (Bleves et al., 2010; Green & Mecsas, 2016; Jackson, Johnson, Clarke, & Arnold, 2011; Lertsethtakarn, Ottemann, & Hendrixson, 2011). Bacteria are also known to establish interactions with other organisms, mainly under the form of symbiosis (Hentschel, Steinert, & Hacker, 2000; Miller & Bassler, 2001). Symbiosis itself can be divided into: i) parasitism that results in harmful effects to the host with benefit to the parasitic organism; ii) commensalism that translates into advantages for one of the organism but with a non-harmful coexistence; or iii) mutualism that as the name indicates derives into benefit for both beings involved in the relationship (Moran, 2006). The gut microbiota, a complex community of microorganisms, that inhabit the digestive tracts of animals including insects, is a good example of both commensal and in some cases mutualist relationship (Cryan & Dinan, 2012; Kinross, von Roon, Holmes, Darzi, & Nicholson, 2008). As for parasitic interactions, bacteria that form these associations are considered pathogens (West & Buckling, 2003). Pathogenic bacteria are a major cause of human death and disease, causing infections such as tuberculosis, pneumonia, tetanus, and others (Stover et al., 2013). Pathogens can adapt to the responses of the hosts immune system avoiding eradication and thriving while causing great harm to the host organism
3
(Abramovitch & Martin, 2004; Leid, 2009). Some organisms are, in certain circumstances, inert as pathogens being even part of the normal microbiota of certain body sites in some animals while others invariably lead to disease and some require a sort of immunosuppression or fragility of the host to start an infection process(Asea, Kaur, & Chakraborti, 2010; Feazel et al., 2009). Bacterial infections are usually treated with classes of compounds known as antibiotics that work by various mechanism to either kill bacteria or prevent bacterial growth (Běhal, 2002). However, due to the adaptive capabilities displayed by some pathogenic and non-pathogenic bacteria, antibiotic resistance is becoming an ever-increasing problem(Bush et al., 2011).
In recent years, pathogenic bacteria such as gram-positive methicillin-resistant Staphylococcus aureus and Clostridium difficile, as well as gram-negative carbapenem-resistant Acinetobacter baumannii and Pseudomonas aeruginosa have been the target of extensive research due to their role in human infection and disease(Chambers & DeLeo, 2009; Davies, 2002; Deris, 2015; Longo, Leffler, & Lamont, 2015). These organisms, among others, have acquired adaptive traits that allow them to cope with the responses of the human immune system in a context of infection as well as counteract the effects of several antibiotic agents and other forms of stress, even some also be found in ecological niches colonized by these bacteria.
As a result, Pseudomonas aeruginosa has become well characterized as an opportunistic pathogen, associated with states of immunocompromise, possessing great adaptive capabilities being alongside Staphylococcus aureus one of the major leading causes of nosocomial infections(Moradali, Ghods, & Rehm, 2017).
4
1.2-
Pseudomonas aeruginosa
, an Overview
1.2.1-The Genus
Pseudomonas
The genus Pseudomonas was first described by Walter Migula, a German botanist at the end of the nineteenth century. Pseudomonads are generally aerobic, non-sporulating, chemoheterotrophic, motile, rod-shaped, gram-negative γ-proteobacteria(Peix, Ramírez-Bahena, & Velázquez, 2009). Some of species are considered as “fluorescent” (e.g. Pseudomonas aeruginosa, Pseudomonas fluorescens), due to the production of a yellow-green fluorescent pigments pyoverdines (peptidic siderophores)(Meyer, 2000). Examples of non-fluorescent species are Pseudomonas alcaligenes and Pseudomonas stutzeri. Members of this genus are known for great metabolic diversity being able to utilize various nitrogen and carbon sources, and for having an extremely large spatial distribution (Spiers, Buckling, & Rainey, 2000). In fact, they can form beneficial and/or pathogenic associations with either plants or animals, including humans. Bacteria of this genus are ubiquitous in nature because of their extraordinary metabolic and physiologic diversity (Lloyd-Jones, Laurie, & Tizzard, 2005). Hence, they are the object of several studies due to their role in animal, plant, and human disease as well their ability to adapt to their surroundings which may present great biotechnological potential.
1.2.2-
P. aeruginosa
in a clinical contextP. aeruginosa is classified as a gram-negative, rod-shaped bacterium, opportunistic pathogen belonging to the Pseudomonas genus(Palmer, Aye, & Whiteley, 2007). As a type species of the genus Pseudomonas, P. aeruginosa is present in a variety of niches from soil and water to living organisms like plants and animals (Al-Saleh & Akbar, 2015; Lutz & Lee, 2011; Walker et al., 2004). It may be found in even the harshest, most nutrient-deprived environments (e.g. medical catheters, swimming pools, hot tubes, etc.) (Lutz & Lee, 2011). In fact, colonization of respiratory assistance equipment and intravenous administration mechanisms has been verified, being one of the major causes of Hospital-acquired (nosocomial) infections (Fu et al., 2010; Sordé, Pahissa, & Rello, 2011). These may vary in nature from urinary tract and bone to skin infections being more commonly acquired by patients with a compromised immune system (Kerr & Snelling, 2009; Klockgether, Cramer, Wiehlmann, Davenport, & Tümmler, 2011; Lister, Wolter, & Hanson, 2009).Nevertheless, the most studied infections associated with P. aeruginosa are the ones associated with cystic fibrosis (CF). Being one of the most common pathogens associated with CF
5
patients, normally leading to various complications which are related to higher mortality rates. The presence of P. aeruginosa on the airway of a CF patient may lead to local chronical inflammation, with the recruitment of inflammatory defense mediators (Brugha & Davies, 2011; Murray, Egan, & Kazmierczak, 2007). This ultimately results in lung tissue scarring and impairment of lung function, in addition to the damage caused by the bacteria itself. During the process of colonization of the airways of CF patients, P. aeruginosa evolves, displaying the ability to adapt to its surrounding efficiently (Folkesson et al., 2012).
1.2.3-
P. aeruginosa
at a genomic levelPrevious research shows that P. aeruginosa possesses a characteristic set of approximately 5,000 core genes defining the species (Ozer, Allen, & Hauser, 2014). However, its genome also shows zones of gene plasticity with unique signature genes present in various isolates, strains, and variants (Figure 1), which may originate from horizontal gene transfer or other processes. These signature genes are normally consequence of adaptation to a specific environment as they are mostly involved in the metabolization of different nutrients, resistance to antibiotics and response to specific stress conditions (Klockgether et al., 2011; Mathee et al., 2008).
Figure 1-Blast-based comparison of P. aeruginosa PAO1 genome with P. aeruginosa LESB58 (red outer circle) and PA14 (green outer circle). Inner circles represent GC content (black) and GC skew (purple and green). Genome were obtained at Pseudomonas Genome Database website (http://www.pseudomonas.com) and blast-based comparison built using CG viewer (Grant JR et al. 2008).
6
It is possible to infer their identity based on certain characteristics where they tend to differ from the totality of the species DNA, such as abnormal GC content. Since P. aeruginosa genome is classified as having a high GC content (approximately 66.6%), horizontally transferred genes will tend to have a lower GC content. In addition, these variable genes tend to be closely associated with elements that facility DNA mobility(Kung, Ozer, & Hauser, 2010; Ozer et al., 2014). Furthermore, new genes are being discovered whenever an uncharacterized clonal complex is sequenced(Soares-Castro, Marques, Demyanchuk, Faustino, & Santos, 2011).
As of 2009, our group has been conducting research on the genotypic diversity of P. aeruginosa clinical isolates having formed a collaboration with Hospital de Braga allowing the assembly of a collection of a specific geographic location, namely the North of Portugal. This research is also currently integrated in the International Pseudomonas aeruginosa Consortium (IPC), whose sole Portuguese member is the supervisor of our current genotyping project. IPC aims to sequence over 1000 genomes of P. aeruginosa, from a variety of niches, and provide a broader view into the evolutionary outline of P. aeruginosa. The data obtained from this study will have great relevance in a clinical context by allowing a better understanding the origins of antibiotic resistant, virulence and adaptation mechanism in P. aeruginosa through the analysis of the abundant genomic data obtained (Freschi et al., 2015).
Due to its immense versatility P. aeruginosa possesses a fluid molecular dynamic that allows its adaptation to harsh conditions, as previously mentioned. From antibiotic resistance mechanisms to the virulence factors, a complex quorum sensing system and a complex genome, P. aeruginosa harbors several tools that allow a molecular dynamism and adaptive capabilities for which this organism is widely known(Kerr & Snelling, 2009; Williams & Cámara, 2009).
1.2.4-Antibiotic resistance in
P. aeruginosa
P. aeruginosa is known to show both acquired and innate resistance to several antibiotics agents (e.g. fluoroquinolones, aminoglycosides, cationic peptides, β-lactams) which makes it hard to handle in a clinical context (Breidenstein, de la Fuente-Núñez, & Hancock, 2011; Gooderham & Hancock, 2009; Lister et al., 2009). In fact, this resistance to antibiotic agents normally results from a mechanism or combination of mechanisms that allow the organism to surpass antibiotic stress. In addition, a combination of various mechanisms may lead to resistance to various classes
7
of antibiotic agents, giving rise to the multi-drug resistant strains (Breidenstein et al., 2011). These mechanisms include reduction of cell wall permeability to the antibiotic, expression of modifying enzymes that target and inactivate or degrade antibiotics, overexpression of efflux pump proteins that extrude the toxic compound to the exterior of the cell or even modification of the antibiotic target (e.g. via mutation)(Hancock & Speert, 2000; Lister et al., 2009) (Figure 2).
Figure 2-Schematic representation of some of the antibiotic resistance mechanisms listed previously. Cells may contain different combination of the mechanisms represented above being that resistance to certain arrays of antibiotics may result from a single or a number of combinations of these different mechanisms. Adapted from (Tanwar, Das, Fatima, & Hameed, 2014).
It should be noted that the strategies/combination of mechanisms varies from isolate to isolate, fact that only complicates adequate treatment in a clinical context (Drenkard & Ausubel, 2002; Gooderham & Hancock, 2009; Hancock & Speert, 2000).
8
1.2.5-Virulence of
P. aeruginosa
Apart from the various resistance mechanisms presented by P. aeruginosa another relevant aspect is their large array of virulence factors that provide its infectious abilities. These virulent abilities are a result of the combined action of different virulence factors resulting in a variety of phenotypes, acting as a modular virulence system (Balasubramanian, Schneper, Kumari, & Mathee, 2013; Pier, 2007).
Virulence factors are divided into cell-associated and secreted virulence factors. Cell-associated virulence factors have a more predominant role in helping the bacteria in the process of colonization by impairing the host’s immune response, facilitating cell adhesion, protecting the colonies from antibiotics and participating in the delivery of effector proteins to the host cells (Ben Haj Khalifa, Moissenet, Vu Thien, & Khedher, 2011; Shaver & Hauser, 2004). Examples of this type of virulence factors are flagella and pili which aid in the motility of the bacteria and lipopolysaccharide (LPS) which aids the process of infection by suppressing the immune response of the host(Feldman et al., 1998; King, Kocíncová, Westman, & Lam, 2009; Siryaporn, Kuchma, O’Toole, & Gitai, 2014). Normally, P. aeruginosa has one polar flagellum which confers movement via a screw like motion. Besides its role in movement, nutrient acquisition etc., it has also been reported as being of importance in the first steps of biofilm formation: On the other hand, pili are involved mostly in two forms of alternative movement to the classical swim motility, “twitching” and swarming. LPS is a main component of the outer membrane of P. aeruginosa, consisting of a hydrophobic domain, Lipid A, and polysaccharide hydrophilic tail projecting from the membrane surface. This has been shown to be essential in the virulence of P. aeruginosa (Pier, 2007).
Secreted or extracellular virulence factors are more of an enzymatic nature. Exoenzymes, are mainly cytotoxic agents acting as mediators of cell killing by various mechanisms (e.g. protein synthesis disruption, actin cytoskeleton disruption). Proteases improve P. aeruginosa ability to invade tissues, potentiate its tissue damaging abilities and interfere with host defense mechanisms. Another example is pyocyanin, a blue-green pigment responsible for inhibition of epidermal cell growth, leading to typical blue-pus wounds (Lau, Hassett, Ran, & Kong, 2004; Shaver & Hauser, 2004; Strateva & Mitov, 2011).A more detailed listing of P. aeruginosa virulence factors is presented in Table 1.
9
Table 1-Summary of P. aeruginosa virulence factors and pathogenic function. Virulence factor are divided into cell-associated virulence factors and extracellular virulence factors as described above. Adapted from (Strateva & Mitov, 2011).
Pathogenic Function Cell-associated virulence factors Extracellular virulence factors
Adhesion
Type IV pili; Carbohydrate-binding proteins (lectins); Glycocalyx;
Alginate slime (biofilm)
Adhesion facilitation Neuraminidase (sialidase) Motility/chemotaxis Flagella (swimming motility);
Retractile pili (twitching motility)
Invasion
Elastases (LasB and LasA); Alkaline protease; Haemolysins (phospholipases and rhamnolipid);
Cytotoxin (leukocidin); Pyocyanin pigment; Siderophores and siderophore uptake systems; Exotoxin
A Toxinogenesis Lipopolysaccharide (endotoxin);
LecA and LecB lectins
Type III effector cytotoxins –ExoS, ExoU, ExoT, ExoY; Enterotoxin Dissemination and antiphagocytic
surface properties
Slime layers; Glycocalix; Lipopolysaccharide Defense against serum bactericidal
reaction
Slime layers; Glycocalix;
Lipopolysaccharide Protease enzymes Defense against immune responses Slime layers; Glycocalix Protease enzymes
10
1.2.6-Quorum sensing system (QS) and Secretion pathways of
P. aeruginosa
These molecular dynamic processes and mechanics that lead to antibiotic resistance and virulence in P. aeruginosa are at least partially controlled by the QS system. This system allows these bacteria to “sense” their population density by measurement extracellular quantities of various self-generated molecules. In P. aeruginosa three of these systems have been described. Two N-acyl homoserine lactone dependent system, the las and rhl systems, and a 2-alkyl-4-quinolone dependent system (Pesci, Pearson, Seed, & Iglewski, 1997; Schuster & Greenberg, 2006; Smith & Iglewski, 2003). The formation of biofilm, which consists of groups of bacteria attached to surfaces and fixated by a matrix of polysaccharide nature that appears to have an important role in antibiotic resistance is known to be regulated by these systems. It also plays a heavy role in the regulation of the secretion system of P.aeruginosa and general stress related responses (De Kievit, 2009; Shrout et al., 2006).
As one can infer, the ability to secrete, especially proteins, to the extracellular environment is imperative for the survival of P. aeruginosa. Furthermore, as highlighted before its infectious capabilities are dependent in secreted virulence factors. Due to its complex secretion arsenal P. aeruginosa can secrete a wide variety of exoproteins these for the most part either toxins or hydrolytic enzymes (Bleves et al., 2010).
P. aeruginosa possesses 5 of the 6 secretion systems reported to exist in gram-negative bacteria lacking only the type IV secretion system. These systems can be generally classified in terms of proteins transport as either Sec-independent or Sec/Tat-dependent. The Sec protein is as dependent translocase known to participate in type II and type III secretion while Tat, an ATP-independent translocase, has been documented to only require a pH gradient for translocation, and is also involved in type II secretion. These translocases first transport the secretion targets to the periplasms before each cross the outer membrane action of the respective secretion machinery. It should be noted that the Sec translocase is involved in the transport of unfolded proteins while Tat is involved in the transport of folded ones. In contrast to type II and type V secretion pathways, types I, III and VI directly take their secretion targets form the cytosol to the outer membrane (Bleves et al., 2010; Hachani et al., 2011; Hauser, 2009). Table 2 contains a list of proteins whose secretion pathways have been experimentally determined.
11
Table 2-List of secreted proteins and their correspondent secretion pathways determined experimentally (adapted from Bleves et al 2010).
Secretion System Secreted protein Characteristics
Type I
AprA (PA1249) Alkaline protease AprX (PA1245) Unknown HasAp (PA3407) Heme acquisition protein
Type II
LasB (PA3 724) Metalloproteinase (Elastase) Las A (PA 1871) Staphylolytic and elastolytic PlcH (PA0844) Hemolytic phospholipase C PlcN (PA3319) Non- hemolytic phospholipase C PlcB (PA0026) Phospholipase C specific to
phosphatidyl-ethanolamine CbpD (PA0852) Chitin-binding protein
ToxA (PA1948) AB Toxin, ADP-ribosyl transferase PrpL (PA4175) Lysine specific endopeptidase (Protease IV) LipA (PA2862) Triacyl glycerol acyl hydrolase LipC (PA4813) Lipase
PhoA (PA3296) Alkaline phosphatase PaAP (PA2939) Aminopeptidase LapA (PA0688) Alkaline phosphatase
Type III
ExoS (PA3841) ADP-ribosyl transferase and Rho GTPase-activating protein (GAP) ExoT (PA0044) ADP-ribosyl transferase and Rho
GTPase-activating protein (GAP) ExoY (PA2191) Adenylate cyclase Type V
EstA (PA5112) Esterase LepA (PA4540) Exoprotease CupB5 (PA4082) Hemagglutinin-like Type VI Hcp1 (PA0085) Nanotubes formation
12
1.2.7-
P. aeruginosa,
a model for studying adaptationThe mechanism and systems described so far lead to an inherent complexity and flexibility which justify P. aeruginosa ability to thrive in various hazardous conditions presenting itself as an adaptive and molecularly dynamic organism. In this context both the genome, at a baser level, and the proteome, at a more practical one, are the key to this ability (Nigaud et al., 2010; Sriramulu, Nimtz, & Romling, 2005). Furthermore, previous reports show that when in conditions of thermal stress the proteomic profile of this organism changes dynamically with added production of 17 new proteins (Allan, Linseman, MacDonald, Lam, & Kropinski, 1988). Further examples of studies of P. aeruginosa adaptation to abiotic factors are listed in the Table 3.
Table 3-Short exemplary list of adaptation to several external factors conducted in P. aeruginosa. The title of the study, external factor used and main conclusions are presented.
External factor Study title Main Conclusion Reference
Divalent metal ion deficiency (e.g. Mg2+)
Magnesium limitation is an environmental trigger of the Pseudomonas aeruginosa biofilm
lifestyle
Low magnesium represses transcription of repS promoting
biofilm formation
(Mulcahy & Lewenza,
2011) Adaptation of aerobically growing
Pseudomonas aeruginosa to copper starvation
P. aeruginosa relies on CioAB enzyme to cope with severe
copper deprivation (Frangipani, Slaveykova, Reimmann, & Haas, 2008) Exposure to toxic compound tellurite
C-di-GMP regulates Pseudomonas aeruginosa stress response to tellurite during both planktonic and
biofilm modes of growth
c-di-GMP level play an important role in mediating response to
Tellurite, with elevated levels promoting tellurite resistance
(Chua et al., 2015)
Oxidative stress
Proteomics of the oxidative stress response induced by hydrogen peroxide and paraquat reveals a
novel AhpC-like protein in Pseudomonas aeruginosa
P. aeruginosa contains a plethora of novel antioxidant proteins that
contribute to its increased resistance t0 oxidative stress.
(Hare et al., 2011)
Exposure to antibiotics
Role of efflux pump(s) in intrinsic resistance of Pseudomonas
aeruginosa: resistance to tetracycline, chloramphenicol, and
norfloxacin
Efflux mechanism(s) contribute to the resistance of P. aeruginosa to the antibiotics studied, as does the low permeability of the outer
membrane.
(X. Z. Li, Livermore, &
Nikaido, 1994)
13
As can be seen, several works studying the effect of different external factors were conducted and these represent only a small example. For this study we will address the possible effects that radiation under the form of visible light might have on the molecular dynamics of P. aeruginosa
1.3-Light, an ever-present abiotic factor
1.3.1-Light and radiation in microbiology
In this study we will address the effects of visible light on P. aeruginosa dynamics and adaptation capabilities, more specifically when exposed to either constant light or complete absence of light. Light is electromagnetic radiation within a certain proportion of the electromagnetic spectrum (Figure 3). This term normally refers to visible light which as the name suggest is the portion of the electromagnetic spectrum that is detectable to the human eye ranging normally from 400nm – to 700 nm, situated between the infrared (greater wavelength) and the ultraviolet (UV) (shorther wavelength) regions (Bléger & Hecht, 2015; Zeitler, 2009).
Figure 3-Electromagnetic spectrum highlighting the various regions that divide it and the relation between wavelength, energy, and frequency. Adapted from https://imagine.gsfc.nasa.gov/science/toolbox/emspectrum1.html.
Nowadays, several studies are conducted focusing on UV radiation, that composes about 10% of the power of sunlight. All types of UV radiation (A, B and C), which correspond to different wavelengths in the UV zone of the electromagnetic spectrum, have been target of studies either for its effects on the human health since exposure to this type of radiation is a known risk factor for several health complications (e.g. cancer, optical complication) or for its possible uses in modern medicine (D’Orazio, Jarrett, Amaro-Ortiz, & Scott, 2013; Elasri & Miller, 1999; Paul & Gwynn-Jones, 2003). In a controlled environment and specific cases, it is however applied in the field of dermatology as treatment and one cannot forget its classical use as a sterilization agent which is of great importance in today’s modern society (Iwaguch, Matsumura, Tokuoka, Wakui, &
14
Kawashima, 2002; Rutala, Gergen, & Weber, 2010; Yagi et al., 2007). Other studies also point to the use of UV radiation as an inactivation agent for viral agents (Jean, Morales-Rayas, Anoman, & Lamhoujeb, 2011). In the field of microbiology, UV radiation is almost a synonym of stress induction, mutation, DNA damage and DNA repair mechanisms (Goosen & Moolenaar, 2008; A. L. Santos et al., 2012, 2013). Its capabilities as a bactericide are widely known and it is one of the most popular methods of inducing mutation or DNA damage in various model organisms for studies involving for example DNA repair mechanisms in this area. However, visible light has also been the target of several studies in the field of microbiology. Antimicrobial photodynamic therapy (aPDT), a technique that uses visible light, started to be investigated as an alternative for the treatment of localized infections due to the ever increasing need to find new forms of therapy consequence of the ever-increasing and ever-spreading antibiotic resistance among potentially pathogenic organisms (Ryskova, Buchta, & Slezak, 2010; Sperandio, Huang, & Hamblin, 2013). This procedure first reported by Danish physician Niels Finsen was used to treat a tubercular condition of the skin know as lupus vulgaris. The technique is currently defined as an oxygen-dependent photochemical reaction, triggered by light. This process is mediated by the activation of a photosensitizing agent that leads to the generation of singlet oxygen or other cytotoxic reactive oxygen species (Figure 4) with a short life time and short radius of action capable of killing several microorganisms (e.g. virus, bacteria, fungi) (Baltazar et al., 2015; O’Riordan, Akilov, & Hasan, 2005; Rajesh, Koshi, Philip, & Mohan, 2011).
Figure 4-Simplified scheme of the photochemical reaction that occurs in aPDT. Briefly, visible light excites a photosensitizer previously administrated. This photosensitizer will react with cellular oxygen originating cytotoxic compounds leading to cell damage and death. The arrows reflect the flow of electrons during the photochemical reactions.
15
Nevertheless, there are some disadvantages to treatments using aPDT such as the need for photosensitizers and its sub-optimal uptake by bacteria in most cases and the intrinsic lack of selectivity for bacterial cells over host cells presented by most of the photosensitizers currently used. However, recent research centered around blue light (415 – 470 nm), has reported growth inhibition and reduced viability of several bacteria and Fungi (e.g. Leuconostoc mesenteroides, Pseudomonas aeruginosa, Penicillium digitatum, Fusarium graminearum) exposed to radiation of wavelengths contained in this interval (Amin, Bhayana, Hamblin, & Dai, 2016; De Lucca, Carter-Wientjes, Williams, & Bhatnagar, 2012). This has led to the appearance of antimicrobial blue light therapy (aBLT) due to its apparent antimicrobial activity without the use of photosensitizers. In fact, studies have been conducted using blue light to treat lethal third-degree P. aeruginosa burn infection in mice showing promising results. The current common hypothesis to explain this phenomenon is the presence of natural endogenous photosensitizers in microorganisms, mainly porphyrins that are transformed into their triplet state when exposed to blue light which may lead them to generate free radicals or superoxide ions (Yunsong Zhang et al., 2014). As such, phototherapy using blue light does not require the application of an exogenous photosensitizers, since it makes use of endogenous porphyrins only present in bacterial cells which also solves the lack of specificity of exogenous photosensitizers (Amin et al., 2016; Rajesh et al., 2011).
However, it should be noted that visible light, is undeniably connected to life as we know it and as such while research in the area as revealed the potential of certain wavelengths as an antimicrobial agent, it is also an abiotic factor essential to living organisms, photosynthesis being a prime example of this. In fact, previously studies in P. aeruginosa led to the discovery of a Bacteriophytochrome in this organism (Yang, Kuk, & Moffat, 2008, 2009).
1.3.2-Bacteriophytochrome receptor PaBphP, evidence of a light-regulated system
Phytochromes are photoreceptors that operate based on red-light, regulating light responses in plants, fungi and bacteria via reversible photo conversion between red (Pr) and far-red (Pfr) light-absorption states (Sharrock, 2008). Usually these present a linear tetrapyrrole (bilin) that acts as a chromophore and allows for photoconversion between Pr and Pfr states (Rockwell, Shang, Martin, & Lagarias, 2009). As most signaling molecules bacteriophytochromes possess a modular domain architecture in which a total of 3 N-terminal domains will form a photosensory core domain (PCD), namely a Per-ARNT-Sim (PAS), cGMP phosphodiesterase/adenyl cyclase/FhlA (GAF), and phytochrome (PHY) domain. They also contain an Histidine Kinase (HK) domain on the
16
C-terminal responsible for the conversion of the light signal into a chemical signal via autophosphorylation of a histidine residue present in this domain(Rockwell et al., 2009; Sharrock, 2008). Recent studies have pointed a third domain formed by the PAS and GAF domains designated Chromophore binding domain (CBD) responsible for the binding of the chromophore. However, the molecular basis of the Pr/Pfr conversion as well the signal transduction mechanisms remain unclear, mostly due to absence of structural information of photoactive constructs containing both an intact PCD and Histidine Kinase domain(Yang et al., 2008, 2009).
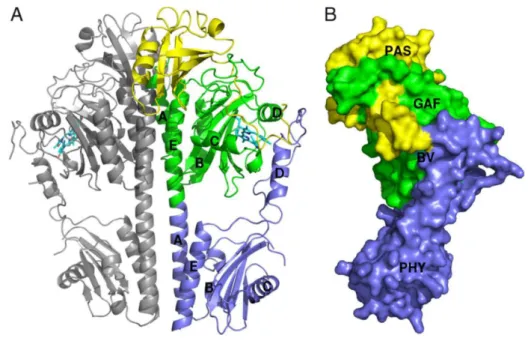
In a previous study, a P. aeruginosa bacterialphytochrome PCD in a Pfr dark-adapted state, was isolated, crystalized and its structure obtained via diffraction. The determined crystalized structure, dimeric in nature, is presented in Figure 5. It should be noted that the bilin used as a chromophore in P. aeruginosa bacterialphytochrome receptor (PaBphP) is biliverdin (BV) (Yang et al., 2008).
Figure 5-Crystal structure of wild-type PaBphP-PCD. (A) Diagram of the dimeric PaBphP-PCD structure. PAS, GAF, and PHY domains of one monomer are highlighted in yellow, green, and blue, respectively. Helices in the GAF and PHY domains are identified by letters A to E. (B) The PAS, GAF, and PHY domains are integrated by interdomain interactions and converge on the chromophore binding site (cyan). Image adapted from (Yang et al., 2008).
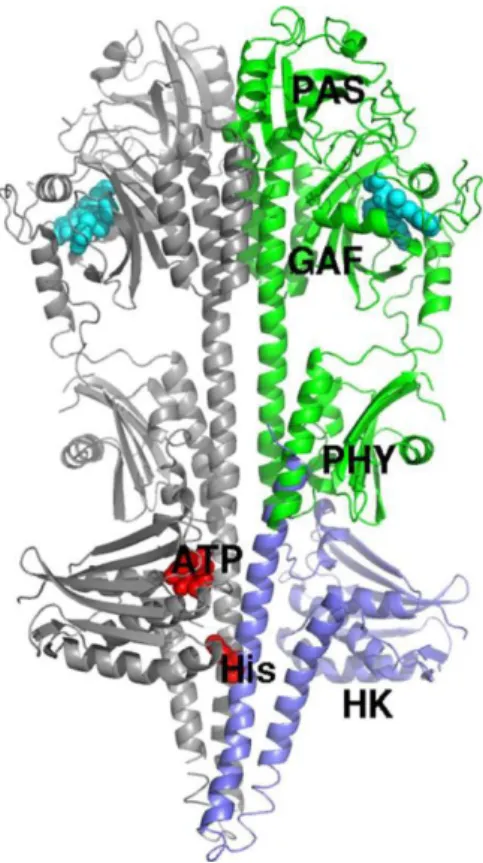
Furthermore, Yang et al proposed a model for a full structure of PaBphP using their obtained structure data of PaBphP-PCD by means of sequence and structural alignment between its C-terminal and the N-terminal of a homologous sensor Histidine Kinase structure (Figure 6)
17
Figure 6-Model of the full-length dimeric PaBphP bas on the PaBphP-PCD dimer structure and the sensor HK structure (PDB accessionID 2C2A) (PAS, GAF, and PHY in green; HK in blue; BV in cyan,). Adapted from (Yang et al., 2008).
According to this model prediction, the histidine kinase domain is directly fused with PHY domain E helix by its N-terminal helix in which the phosphor-acceptor histidine is present. However, this is only a prediction model, the true structure of PaBphP remains undiscovered as the implications of the chemical signal generated by the activity of this photoreceptor (Yang et al., 2008, 2009)
The knowledge acquired in studies of visible light allied with the molecular dynamism of P. aeruginosa, almost by itself poses the question: How does light affect this dynamic and adaptive organism? The sole fact that a photoreceptor related to signal transduction was discovered in P. aeruginosa strongly suggests that changes in light and therefore activity of the photoreceptor can have a strong impact on the organism. Perceiving the changes caused by this abiotic factor, and the molecular mechanisms that lead to them may allow for the development of additional tools in the field of biotechnology possibly culminating in the development of a light-controlled expression system that would possess an extremely dynamic range of applications in various areas and for innumerous purposes. As such, to discern possible changes in the molecular dynamics based on this abiotic factor, a proteomics approach will be used, since proteins are indeed the true effectors of an organism.
18
1.4-Proteomics, a brief overview
1.4.1-Systems Biology, the beginning of the age of Omics
To fully understand the concept of proteomics and what this area contributes to the understanding of biological functions, it is convenient to start whit a brief description of what is not only a research area that contributed to the birth of all omics but also a philosophy on how one should look at a living organism when attempting to study and describe it, namely Systems Biology. Nowadays, Systems Biology has become an ever-increasing popular field. Studies in this area seek to achieve an understanding of how and by what mechanisms a biological system, in its entirety, can adapt to its surroundings (Bruggeman & Westerhoff, 2007; Westerhoff & Palsson, 2004). Although it’s undeniable that the Human Genome sequencing project contributed heavily to recent increase of popularity of this subject, the idea already existed. The principles of this field were heavily based on what is called the central dogma of molecular biology represented in Figure 7 (Crick, 1970; Kitano, 2002)
Figure 7-The Central Dogma of molecular biology. Generally, the flow of information is in the direction highlighted in yellow. From DNA to RNA to protein, however some exceptions (highlighted in orange) exist in nature due to the action of special enzymes such DNA Reverse Transcriptase. The actual discovery of these “special” information flows have led to the development of popular techniques.
From the DNA to RNA and finally protein, the actual effector of the cell, was the initially accepted flow of information in a living organism. However, it was since then discovered that this flow was not unidirectional due to enzymes such as reverse DNA polymerase which, allows for the conversion of RNA back into DNA. This knowledge had various applications in the field of systems biology.
19
Based on this Dogma, the notion of -ome and -omics was born indicating totality of an organisms DNA, transcripts, proteins, and metabolites (Genome; Transcriptome, Metabolome, and Proteome) and the fields sciences that study them (Genomics, Transcriptomics, Metabolomics, and Proteomics) (Gomez-Cabrero et al., 2014; Kandpal, Saviola, & Felton, 2009; Wright, Noirel, Ow, & Fazeli, 2012). Over the course of time other “omes” and -omics studies started to appear (e.g. Secretome, Secretomics) leading to a universalization of the concept sometimes perhaps to the point of exaggeration (Prohaska & Stadler, 2011). Indeed, it could be said that the scientific community is entering the age of “omes” and -omics, where an organism is seen and perceived as a set of different “wholes”, which interact, intersect, and influence each other culminating in a holistic view of a living system. While all the omics have and will continue to benefit greatly from technological advances and breakthroughs, Proteomics has been quite dependent on these factors (Wright et al., 2012).
1.4.2-Proteome and Proteomics, a brief introduction
Proteomics is the systematic identification and quantification of the complete complement of proteins (the proteome) of a biological system (cell, tissue, organ, biological fluid, or organism) at a specific point in time. Proteome itself can be defined as “The analyses of the entire PROTEin complement by a genOME, or by a cell or tissue type” (Wasinger et al., 1995). While the concept of proteome is older than its definition, its analysis only began to be widespread when several conditions were fulfilled mainly the availability of genomic sequence information, technological advance in protein identification and acquisition of greater computing power and memory(Wang, Huang, & Nice, 2014). Proteome analysis that started with the classical two-dimension electrophoresis(2D-E) as described by O’Farell (O’Farrell, 1975) followed by MALDI( matrix-assisted laser desorption/ionization) mass-spectrometry (MS) (Hjernø & Jensen, 2007) has nowadays evolved, with newer techniques and procedures being developed at a steady pace. Advances in proteomics also made clear that direct correlation between protein and gene sequence is impossible, due to post- and co-translational protein modifications that cannot be directly predicted from genomics sequence (S. Li, Iakoucheva, Mooney, & Radivojac, 2010; Lothrop, Torres, & Fuchs, 2013). It is also known that these modifications have implications in disease. Nevertheless, by translating “in silico” DNA sequences into protein sequences, genome databases were essential for the identification of proteins. In fact, using this data one can generate, by means of a molecular
20
weight (Mw) vs isoelectric point (pI), a map of theoretically expressed proteins obtaining an image akin to a 2D-E gel but as can be observed in Figure 8 quite different (Lecoutere et al., 2012).
Figure 8-A –Theoretical representation of expressed proteins by P. aeruginosa PAO1 mapped by Mw vs pI. B – A representation of the P. aeruginosa PAO1 proteome obtained in this study. As can be seen there is remarkable difference between the two representations that can be attributed to various reasons. Image adapted from (Lecoutere et al., 2012)
Several factors may justify the observed difference between the two representations. Primarily, it should be noted that the proteome of a cell reflects its current metabolic state and as such is extremely dynamic and extremely variable (Harper & Bennett, 2016). Also, not all possible proteins will be expressed and certainly not all in the same period and at the same time. Some proteins will have so little presence that may not be detected during experimental practice. Furthermore, proteins may be differentially modified during or after translation altering their properties and finally some proteins may not be detected due to experimental conditions set (e.g. sample preparation method, precipitation method, solubilization method, pH gradient chosen for isoelectric focusing, polyacrylamide % chosen for SDS-PAGE, staining method used and others) (Harper & Bennett, 2016; Lothrop et al., 2013; R Westermeier, Naven, & Höpker, 2008).
Truthfully proteomics, especially gel-based proteomics, experimental practice is extremely complex being dependent on several factors that must be correctly set to achieve experimental success, also suffering from the inherent manual techniques used in some approaches which causes experiment success/results to depend heavily on user experience and performance (Baggerman, Vierstraete, De Loof, & Schoofs, 2005; Righetti, Antonioli, Simò, & Citterio, 2008). However, no matter how experienced the user or how automatized proteomics evolve, obtaining a complete picture of a proteome in one single experiment remains unachievable in the near future (Harper & Bennett, 2016; Kim et al., 2014).
21
Even though, when compared to genomics and transcriptomics, proteomics and its current edge cutting techniques are still largely under development, effective workflows for studies of the proteome of an organism already exist (Baggerman et al., 2005; Righetti et al., 2008). Classical gel-based proteomics will use electrophoretic separations, by one or more characteristics, to decomplex in gel, crude proteome’s allowing for isolation of individual proteins and posterior identification by MS technologies. An example of such a technique as previously mentioned is 2D-E, which will be discussed in more detail in the following section. These approaches however are not without limitations. Proteins larger than 250 kDa are normally not suited for SDS-PAGE analyses, a component of this type of approach. Furthermore, hydrophobic proteins due to their low solubility and low buffer compatibility are not suited for gel proteomics(Righetti et al., 2008). Due to these shortcomings, alternative techniques have emerged more recently namely approaches based on high-performance liquid chromatography (HPLC) for sample separation, followed by protein identification recurring to high-speed Tandem MS also known as shotgun proteomics. This technique will analyze a proteome in its more complex form in a quasi-random nature, which can be considered a disadvantage(Marcotte, 2007; Yaoyang Zhang, Fonslow, Shan, Baek, & Yates, 2013). One of the most well-known techniques using this approach is multidimensional protein identification technology (MudPIT). Briefly classical MudPIT uses two liquid chromatography separation phases to resolve protein complexes, followed by tandem MS for protein identification where computer algorithms will match the tandem mass spectra of the peptides to databases allowing rapid protein identification (Delahunty & Yates, 2007). On this study however, we will largely recur to the 2-DE technique.
1.5-Two-dimension electrophoresis, an overview for successful
application
1.5.1–Basics of 2D-E technique
2D-E consists in the separation of a complex protein mix by two separate dimensions (characteristics). This technique is highly sensible and requires the utmost care and high purity reagents to guarantee success. In 2D-E proteins will first be submitted to an isoelectric focusing (IEF) as the first dimension (horizontal separation) of this technique. Isoelectric focusing allows, under the influence of an electric field and presence of a pH gradient, for the separation of proteins by their pI, pH value at which the net charge of the protein is zero. This net charge value under pH