Trabalho efetuado sob a orientação da
Doutora Clara Sá Miranda
E co-orientação da
Professora Doutora Maria João Marques Ferreira
Sousa Moreira
iii
Apoio Financeiro
Este trabalho está inserido no projeto “Fabry Screen – Screening for Fabry disease based on automatic classification of chromatographic images”, com a referência PTDC/SAL‐BEB/100875/2008, financiado pela Fundação para a Ciência e a Tecnologia.
iv
Agradecimentos
Gostaria de começar por agradecer à Universidade do Minho pelos conhecimentos transmitidos durante este ciclo de estudos e ao Instituto de Biologia Molecular e Celular, por me acolher para realizar o projeto de mestrado. Um especial obrigado à Doutora Maria Clara Sá Miranda e à Doutora Maria João Marques Ferreira Sousa Moreira pela orientação dos trabalhos que constam nesta dissertação.
Pelo projeto em que estou inserida, e que em muito contribuiu para esta dissertação, fico grata à Unidade do Lisossoma e do Peroxissoma, liderada pela Doutora Maria Clara Sá Miranda, e ao “Bioimaging group”, liderado pela Doutora Ana Mendonça.
Ao Daniel devo os ensinamentos sobre TLC e a energia com que sempre se prontificou a ajudar-me na resolução de problemas e na interpretação das minhas placas.
Pela paciência e pelos conhecimentos transmitidos, agradeço ao Rui, à Lorena, à Andrea, ao Paulo e à Fátima.
Ainda ao Paulo e ao Rui, bem como à Cátia, à Cláudia, à Marta, à Tânia e à Ana, agradeço o ombro amigo, os conselhos, e os momentos da mais pura diversão que permitiam superar qualquer frustração.
v
HPTLC Detection of Gb3 in Urine Samples: improvement of the method
and sampling
Abstract
Fabry disease (FD) is a lysosomal storage disorder caused by deficient or null production of the enzyme galactosidase A (Gal A) as a result of mutations in galactosidase A gene (GLA), located on the X chromosome. The systemic accumulation of α-Gal A substrates, which are excreted in urine, leads to progressive damage of several organs and tissues and ultimately results in death due to heart failure, renal failure and cerebrovascular accidents.
Many studies are focused in diagnosing FD through measurement of α-Gal A activity in blood and of accumulated substrates, mainly globotriaosylceramide, in plasma or urine. Mass spectrometry techniques are extensively used for screening of FD and other lysosomal storage disorders. However, mass spectrometry is an expensive method, requires a specialized operator and involves complex equipment. Thin-layer chromatography, on the other hand, is a robust and well explored method suitable for analysis of a large number of samples.
The collection of urine samples is easy and non-invasive, which facilitates the cooperation of the subjects, but urine samples are difficult to transport without degradation.
In this study, the problematic of urine samples transport was overcome by using filter paper as a supporting material that allows shipping through general mail without deterioration. The high-performance thin-layer chromatography method conventionally used to analyse Gb3 in urine samples was successfully optimised to analyse urine in filter paper. Using this method 60% of the previously diagnosed FD patients revealed increased Gb3 levels and one patient on enzyme replacement therapy showed significant Gb3 reduction after three months of therapy.
The developed screening method offers an easy and simple method for urine sample shipping without degradation and suitable for a mass screening and ERT follow up program.
vi
HPTLC Detection of Gb3 in Urine Samples: improvement of the method
and sampling
Resumo
A doença de Fabry (FD) é uma doença lisossomal de sobrecarga causada pela atividade deficiente da enzima α-galactosidase A (α-Gal A) do, como resultado de mutações no gene desta enzima (gene GLA), localizado no cromossoma X. A acumulação sistémica dos substratos da α-Gal A, que são excretados na urina, leva à lesão progressiva de vários órgãos e tecidos, conduzindo por fim à morte devido a falência cardíaca, falência renal e acidentes vasculares cerebrais.
Vários estudos estão debruçados no diagnóstico da doença de Fabry através da medição da atividade da α-Gal A em sangue e de substratos acumulados, principalmente o globotriaosilceramida, em urina e plasma. As técnicas de espectrometria de massa são extensivamente no rastreio da doença de Fabry e outras doenças lisossomais de sobrecarga. Contudo, a espectrometria de massa é um método dispendioso, requer um operador especializado e envolve equipamentos complexos. A cromatografia em camada fina, por sua vez, é um método robusto e bem explorado adequado à análise de grandes grupos de amostras.
A colheita de amostras de urina é fácil e não é invasiva, o que facilita a cooperação por parte dos dadores, mas as amostras de urina são difíceis de transportar sem que haja deterioração.
Neste estudo, a problemática do transporte de amostras de urina foi ultrapassada utilizando o papel de filtro como material de suporte, permitindo que as amostras sejam enviadas por correio normal sem degradação. O método de cromatografia em camada fina de alta performance convencionalmente utilizado na análise de Gb3, em amostras de urina, foi otimizado com sucesso para analisar amostras de urina em papel de filtro. Recorrendo a esta metodologia, verificou-se que os níveis de Gb3 estavam aumentados em 60% dos doentes de Fabry previamente diagnosticados, e que um paciente em terapia enzimática de substituição mostrou uma redução significativa de Gb3 após três meses de terapia.
O método de rastreio desenvolvido oferece um modo simples e fácil de envio das amostras de urina sem que haja degradação, sendo por isso, adequado para o rastreio em massa e seguimento dos pacientes em terapia.
vii
INDEX
ABBREVIATION LIST IX
ILLUSTRATION LIST XI
TABLE LIST XII
1. INTRODUCTION 1
1.1. An Overview 2
1.2. Molecular Genetics 3
1.3. Metabolic Background of Fabry Disease 5
1.4. Glycosphingolipid Storage in a Cellular and Subcellular Perspective 9
1.5. Clinical Profile and Pathophysiology 11
1.5.1.Heterozygotes 14
1.6. Treatment 16
1.7. Laboratory Diagnosis of Fabry Disease 17
2. STUDY AIMS 20
3. SAMPLES AND METHODOLOGY 22
3.1. Sampling 23
3.1.1.Biological samples 23
3.1.2.Sample Collection 24
3.2. Reagents and Standards 25
3.3. Methods 26
3.3.1.High-Performance Thin-Layer Chromatography for Conventional Urine Samples 26
viii
4.1. High-Performance Thin-Layer Chromatography Optimization for Filter Paper Urine Samples 29
4.1.1.Validation of Filter Paper for HPTLC Analysis 29
4.1.2.Extraction Method 31
4.1.3.Lipid Fractionation Process 35
4.1.4.Development of the HPTLC Plate 36
4.1.5.Spraying Solution 37
4.1.6.Gb3 Detection Limit 39
4.1.7.Lipid loss in the HPTLC technique 40
4.1.8.Optimised Protocol 41
4.2. Lipidic Profile of FD Patients and Control subjects 43
4.3. Effect of ERT in FD Patients 46
5. DISCUSSION 48
6. CONCLUSIONS AND FUTURE PERSPECTIVES 53
7. REFERENCES 55
8. APPENDIX I 71
ix
Abbreviation list
3-KSR 3-ketosphinganine reductase
α-Gal A (GLA) α-galactosidase A
β-Hex A (B) β-Hexosaminidase A (B)
AC acid ceramidase
ASA arylsulfatase A
aSMase acid sphingomyelinase
C/M chloroform/methanol
Cer 4 asialoganglioside GM1
CerS ceramide synthase
CERT ceramide transfer protein
CGT ceramide UDP-galactosyltransferase
CST galactose-3-osulfotransferase
CTH ceramide trihexoside
DBS dried blood spot
DHCer dihydroceramide
DHCerS dihydroceramide desaturase
ELISA enzyme-linked immunosorbent assay
ER endoplasmic reticulum
ERT enzyme replacement therapy
FAPP2 four-phosphate adaptor protein 2
FD Fabry disease
FOS Fabry outcome survey
GALC GalCer-β-galactosidase GalCer galactosylceramide Gb3 globotriaosylceramide Gb3 synthase α-1,4-galactosyltransferase Gb4 globotetraosylceramide; globoside GCase β-glucocerebrosidase GCS glucosylceramide synthase
x
GLA α-galactosidase A gene
GLC gas-liquid chromatography
GlcCer glucosylceramide
GM1-GLB GM1-β-galactosidase
GM3 synthase lactosylceramide α-2,3-sialyltransferase
GSL glycosphingolipids
GT3 synthase α-N-acetylneuraminide
α-2,8-sialyltransferase
HPLC high-performance liquid chromatography
HPTLC high-performance thin-layer
chromatography
LacCer lactosylceramide
LacCer synthase LacCer synthase
LVH left ventricular hypertrophy
Lyso-Gb3 globotriaosylsphingosine
Lyso-GSLs lyso-glycosphingolipids
MS mass spectrometry
nSMase neutral sphingomyelinase
PE phosphatidylethanolamine
RSD relative standard deviation
S1P sphingosine 1-phosphate
S1-P Pase sphingosine 1-phosphate phosphatase
(Sa) N-ACT sphinganine N-acyltransferase
Sa1P sphinganine 1-phosphate
Sap A (B, C, D) saposin A (B, C, D)
SD standard deviation
Sk sphingosine kinase
SMS sphingomyelin synthase
SM sphingomyelin
SPT serine palmitoyl transferase
SRT substrate reduction therapy
xi
Illustration list
FIGURE 1: THE GSL METABOLIC PATHWAYS ... 6
FIGURE 2:STRUCTURES OF GLOBOTRIAOSYLCERAMIDE AND LYSO-GLOBOTRIAOSYLCERAMIDE ... 7
FIGURE 3:SCHEMATIC REPRESENTATION AND LOCALIZATION OF GSL METABOLISM IN THE CELL ... 8
FIGURE 4:LIPID AGGREGATES IN FABRY DISEASE ... 9
FIGURE 5:SOME CELL TYPES KNOWN TO EXPRESS HIGH DEGREE OF STORAGE IN FABRY DISEASE ... 10
FIGURE 6:SCHEMATIC MODEL FABRY DISEASE PROGRESSION ... 11
FIGURE 7:REPORTED SIGNS AND SYMPTOMS OF FABRY DISEASE AMONG 366FD PATIENTS ... 15
FIGURE 8: CONVENTIONAL COLLECTION URINE FLASK ... 25
FIGURE 9:FILTER PAPER KIT ... 25
FIGURE 10:FILTER PAPER KIT INSTRUCTION SHEET FOR COLLECTION OF URINE SAMPLES ... 73
FIGURE 11:ANALYSIS OF 1 AND 2 FILTER PAPERS FROM A CONTROL SAMPLE... 30
FIGURE 12:FD PATIENTS’ ANALYSIS OF CONVENTIONAL 20 ML URINE SAMPLES AND URINE SAMPLES APPLIED TO FILTER PAPERS ... 31
FIGURE 13:EVALUATION OF DIFFERENT EXTRACTION CONDITIONS ... 32
FIGURE 14:ANALYSIS OF DIFFERENT EXTRACTION AGITATION METHODS AND ORGANIC SOLVENT SOLUTIONS ... 34
FIGURE 15:ELUTION OF NEUTRAL LIPIDS FRACTION ... 35
FIGURE 16:DEVELOPMENT OF THE HPTLC PLATE FOR 7 CM ... 37
FIGURE 17:VISIBLE WHITE BANDS IN PATIENTS AND CONTROL URINES ... 37
FIGURE 18:ORCINOL STAINING OF NEUTRAL LIPIDS ... 38
FIGURE 19:ESTIMATION OF THE GB3 DETECTION LIMIT ... 39
FIGURE 20:GB3 LOSS DURING THE HPTLC TECHNIQUE AND FRACTIONATION OF THE OPTIMISED AND CONVENTIONAL METHOD ... 40
FIGURE 21:REPRODUCIBILITY EVALUATION OF THE OPTIMISED METHOD... 42
FIGURE 22: ANALYSIS OF SAMPLES FROM CONTROL SUBJECTS AND FD PATIENTS BY THE OPTIMISED HPTLC METHOD ... 44
xii
Table list
TABLE I:EARLY SIGNS AND SYMPTOMS OF FABRY DISEASE ... 12
TABLE II:COHORT CHARACTERISTICS ... 23
TABLE III:CHARACTERISTICS OF CONTROL SUBJECTS ... 72
TABLE IV:CHARACTERISTICS OF FD PATIENTS ... 24
TABLE V:CONSTITUTION OF A STANDARD MIXTURE FOR HPTLC ... 27
TABLE VI:DENSITOMETRY OF GB3 AND SM+GB4 BANDS FROM THE FILTER PAPER SAMPLES ... 30
TABLE VII: DENSITOMETRY OF GB3 AND SM+GB4 BANDS FROM URINE SAMPLES EXTRACTED UNDER DIFFERENT CONDITIONS ... 32
TABLE VIII: DENSITOMETRY OF GB3 BANDS FROM EMPTY FILTER PAPERS SUBJECTED TO DIFFERENT EXTRACTION AGITATION PROCEDURES ... 76
TABLE IX:DENSITOMETRY OF GB3 ELUTED WITH 8 ML OR 16 ML OF ORGANIC SOLVENT SOLUTION DURING FRACTIONATION... 36
TABLE X: DENSITOMETRY FOR CALCULATION OF GB3 LOSS DURING THE HPTLC TECHNIQUE AND FRACTIONATION WITH THE OPTIMISED AND CONVENTIONAL METHODS ... 41
TABLE XI:ASSESSMENT OF VARIABILITY OF THE OPTIMISED METHOD BY DENSITOMETRY... 43
TABLE XII:DENSITOMETRY OF CONTROL AND FD PATIENTS WITH TRACEABLE AMOUNTS OF GB3 ... 45
CHAPTER I
[2]
1.1. An Overview
Fabry disease (OMIM #301500) is an X-linked inherited lysosomal storage disorder caused by α-galactosidase A (EC 3.2.1.22) deficiency. α-Gal A is responsible for cleaving out neutral glycosphingolipids with α-galactosyl residues and is codified by the GLA gene (OMIM #300644), located on Xq22.1 (Desnick et al, 2001). The impairment of its activity results in progressive visceral accumulation of its substrates, mainly globotriaosylceramide (Gb3 or CTH), digalactosylceramide, and to a lesser extent, globotriaosylsphingosine (lyso-Gb3), blood group B, B1 and P1 related glycolipids (Hrebícek & Ledvinová, 2010). This accumulation in lysosomes leads to dysfunction of basic metabolic processes in the cell, leading to its death, which contributes to the development of secondary (inflammatory) processes culminating with vital organ dysfunction (Eng et al, 2007). Gb3 is the most abundant accumulated substance making it an appropriate molecular marker of FD. Increased values of Gb3 were reported in both hemizygous males and heterozygous females (Bodamer, 2007). Even though FD follows an X-linked pattern of inheritance, having males more severe symptoms, heterozygous females that in the past were considered as carriers, can be as affected as their male counterparts. About 69,4% of the 1077 females in the Fabry Registry (an ongoing observational database that tracks natural history and outcomes of FD patients) had symptoms and signs of the disease, showing that females have a considerable risk for major organ involvement and decreased quality of life (Germain et al, 2010).
FD is estimated to have a prevalence ranging from 1:40000 males to 1:117000 births (Germain, 2010; Levy & Feingold, 2000; Meikle et al, 1999). Due to its rarity, accurate values about its prevalence are harder to obtain. FD was for a long time predominantly described in males developing a “classic” phenotype (compatible with null α-Gal A activity and multi-organ involvement). However the remarkable heterogeneity in clinical manifestations among the patients, even within the same pedigree, led to the creation of sub-classifications, such as, the “cardiac variant” and the “renal variant”, for those patients showing predominant or exclusive cardiac or renal complications (Germain, 2010; Hrebícek & Ledvinová, 2010).
Despite the fact that the first signs of the disease emerge during childhood, glycosphingolipid accumulation processes might start in the fetal stage. The clinical features observed in FD patients worsen in adulthood and the mortality causes are generally related to
[3]
heart failure, renal failure or cerebrovascular accidents (Liu et al). Furthermore, FD signs and symptoms are not pathognomonic, which can delay the clinical diagnosis often until irreversible organ damage is already present. This becomes more evident in the absence of family history and in the case of affected females, since the range of enzyme activity in these patients is broader than in males (Germain, 2010). While FD can be diagnosed in males by demonstrating significantly reduced enzymatic activity of α-Gal A in plasma, leukocytes, fibroblasts or dried blood spots (DBSs; Gaspar et al, 2010), heterozygous females can only be unequivocally identified by mutational analysis. Classic hemizygotes and over 90% of the heterozygous females show elevated urinary Gb3 levels (Winchester & Young, 2006). For male patients with residual α-Gal A activity or with an atypical clinical presentation, measurement of urinary Gb3 and sequencing of the whole GLA gene must be carried out (Winchester & Young, 2006).
Although there is still no cure for FD, enzyme replacement therapy (ERT) is available in Europe since 2001. Two different products are approved, Agalsidase alfa (Replagal®, Shire
Human Genetic Therapies) and Agalsidase beta (Fabrazyme®, Genzyme Corporation; Lidove et
al, 2010).
1.2. Molecular Genetics
The GLA gene is localized at the X chromosome in the region Xq22.1 and is constituted by 12 kilobases distributed through 7 exons (Bishop et al, 1986; Kornreich et al, 1990).
Above 400 point mutations and 150 small rearrangements have been identified scattered throughout the GLA gene (Gal, 2010; Masson et al, 2004). Most of the identified patients have different mutations. The great majority of the GLA mutations are private/unique of the family (Gal et al, 2006; Schäfer et al, 2005).
The point mutations include missense, nonsense and splice site mutations, and the rearrangements include deletions and intragenic insertions (Desnick et al, 2001; Gal, 2010). The missense and nonsense mutations correspond to approximately 70% of the described mutations known to cause FD (Schäfer et al, 2005). The high proportion of novel mutations, the large phenotypic heterogeneity associated with the same mutation and the fact that patients with FD may develop disease-related complications observed in the general
[4]
population, difficult the genotype-phenotype correlations (Ries & Gal, 2006). However, some phenotypes associated to Fabry disease may be attributed to specific mutations of the GLA gene (Brown et al, 1997; Eng et al, 1993; Germain et al, 2002; Saito et al, 2011; Spada et al, 2006). Alleles with nonsense and splice-site mutations in the GLA gene or out-of-frame short rearrangements usually lead to a premature termination codon. Consequently, these alleles do not produce the enzyme. The missense mutations can affect the enzyme activity in a quite variable way. Clearly, the substitution of one residue in the pocket of the enzyme, or substitution of a residue essential for proper three-dimensional folding of the protein, generally results in a completely inactive enzyme. In contrast, the missense mutations associated with a less severe phenotype are generally located away from the active site of the enzyme, resulting in small structural changes. However, the enzyme product of missense mutations may still be subject to post-translational inactivation and degradation (Gal, 2010; Matsuzawa et al, 2005).
In Fabry disease, heterozygous females where initially referred to as carriers concerning their genotype. Even so, the affected females can present a phenotype that ranges from asymptomatic to the classical form of the disease seen in the majority of the male patients (MacDermot et al, 2001b; Wang et al, 2007; Whybra et al, 2001; Wilcox et al, 2008). Among females presenting the classic form of FD (null α-Gal A activity), missense and nonsense mutations are present. On the other hand, in patients with less severe or asymptomatic forms of the disease, only missense mutations are present, which leads to residual activity of α-Gal A (Desnick et al, 2001). Nevertheless, it is harder to predict the hetezygotes phenotype due to the X-inactivation process, which occurs early in the female embryonic phase and leads to a random and almost complete inactivation of one of the X chromosomes per cell. Therefore, depending on which α-Gal A gene is inactivated (the normal or the mutated gene) and according to the skewing rate that occurred at the precedent cell, different organs from the same patient may have distinct pathology degrees (Elstein et al, 2012).
Since FD is linked to the X chromosome, males descending from hemizygous males do not carry the mutated gene, while females acquire the mutated gene. Therefore, prenatal diagnosis is of major importance. FD can be determined by assessing α-Gal A activity in amniotic fluid at weeks 12 to 14 (Desnick et al, 2001).
[5]
1.3. Metabolic Background of Fabry Disease
The deficient α-Gal A catalytic activity of Gb3 and other substrates, leads to subcellular functional alterations responsible for the massive lysosomal storage of these components. Ultimately, the storage culminates in irreversible cell damage and death (Elleder, 2010).
α-Gal A substrates are sphingolipids characterized by an α-galactosyl moiety, of which Gb3, a glycolipid of the globo-series metabolism, is the major accumulated substrate. The massive storage of this GSL is pointed out as the major responsible for FD development. As seen in Figure 1, Gb3 can be synthesized from lactosylceramide (LacCer) by Gb3 synthase or it can be a product of globotetraosylceramide (Gb4) degradation by β-Hexosaminidase A (B) (Xu et al, 2010).
Besides Gb3, also di-galactosylceramide possesses an α-galactosyl moiety, making it suitable for degradation by α-Gal A. This glycolipid and other glycolipids from the blood group B, like the B1 and P1 related lipids, with α-galactosyl extremities have been shown to accumulate in Fabry patients, although in much lesser extent. Patients with this biochemical profile do not seem to be in higher risk for developing severe disease manifestations. Therefore scientific attention is mostly turned to the study of the glycosphingolipids that are thought to be related to the disease progression and severity (Elleder, 2010).
Lyso-Gb3, a deacylated derivate of Gb3 is also accumulated in FD (Aerts et al, 2008). Lyso-Gb3 has a similar structure to that of Gb3 but instead of ceramide it has a sphingosine backbone (Figure 2).
[6]
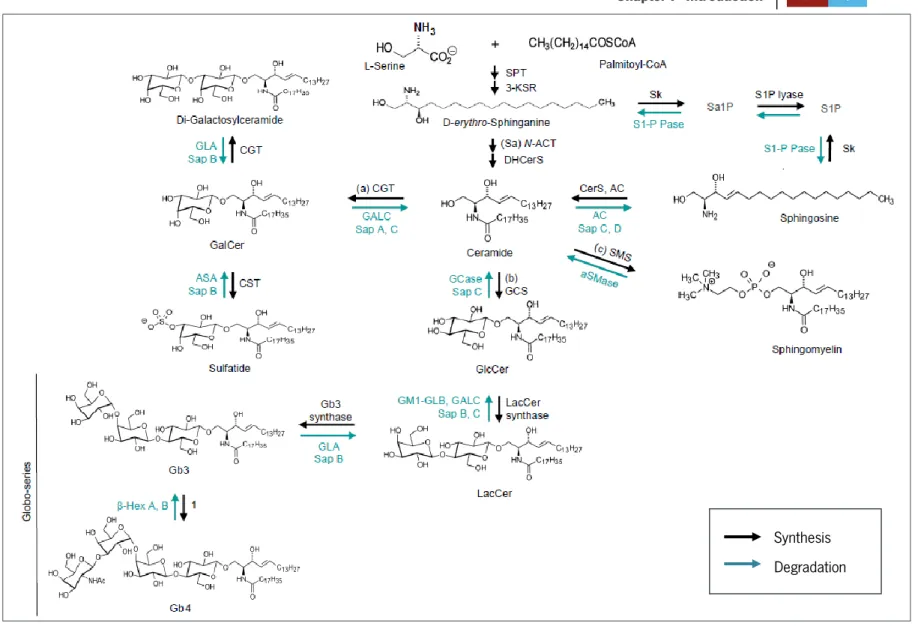
Figure 1: The GSL metabolic pathways. The synthesis and degradation of GSLs are sequential processes. The synthesis is catalyzed by membranous glycosyltransferases in the endoplasmic reticulum (ER). GSL synthesis
begins with condensation of serine and palmitoyl-CoA, leading to de novo biosynthesis of ceramide. Ceramide can also be formed from sphingosine by addition a fatty acid chain of specific length, or hydrolysis of sphingomyelin (SM). Once formed, ceramide can originate galactosylceramide (GalCer) or glucosylceramide (GlcCer) by addition of galactose or glucose residues, respectively. GalCer can form sulfatide and di-galactosylceramide (one of the GSLs accumulated in Fabry patients). The addition of one β-gal residue to GlcCer originates LacCer, which is a precursor of Gb3. Gb3 is created when a α-gal is added to LacCer and Gb4 is formed when α-gal is added to Gb3. 1=GM2/GD2/GA2/GT2-synthase. The degradation reactions occur in the lysosome by action of several hydrolases. (Adapted from Xu et al, 2010).
Synthesis Degradation
[7]
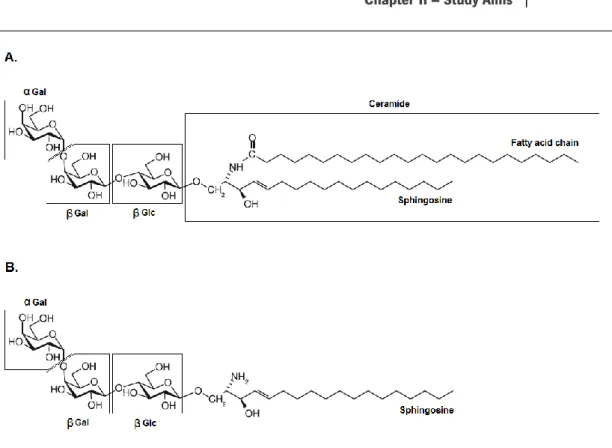
Figure 2: Structures of globotriaosylceramide and lyso-globotriaosylceramide. A. Gb3 is organized in 3 sugar
residues, α-gal, β-gal and β-glc, and a ceramide tail composed of a fatty acid acyl chain, that varies in length and saturation, and a sphingosine backbone. B. In lyso-Gb3, a deacylated derivate of Gb3, the fatty acid chain is missing (Adapted from Hřebíček & Ledvinová, 2010 and Cole et al, 2007).
The deposition of other lyso-glycosphingolipids (lyso-GSLs) was shown to be a characteristic aspect of LSDs, such as Krabbe (deposition of galactosylsphingosine) and Gaucher disease (deposition of glucosylsphingosine; Nilsson & Svennerholm, 1982; Orvisky et al, 2002; Svennerholm et al, 1980). These lyso-GSLs are described for their toxic effects and as potential pathologic agents in these diseases (Igisu & Suzuki, 1984; Orvisky et al, 2002). Therefore, lyso-Gb3 could be implicated in FD pathological events as well. In 2008, Aerts and colleagues described high levels of lyso-Gb3 in plasma of Fabry patients and mice. They advanced that this compound competes with Gb3 for the α-Gal A activity and promotes smooth muscle cell proliferation, which can be related to an increase in thickness of the intima-media of the heart (Aerts et al, 2008).
The understanding and knowledge of the pathways related to the incorporation and degradation of these GSLs may lead to relevant discoveries in the mechanisms associated to disease progression and tissue/cell specific reaction processes. The so far described synthesis and degradation pathways can be seen in Figure 3. The pathways that lead to α-Gal A
[8]
substrate delivery into the lysosome for degradation are still poorly understood but it is known that the substrates can be localized at the cell membrane or at the extracellular matrix and then be transported by endocytosis by plasma lipoproteins (Elleder, 2010; Huwiler et al, 2000). Thereafter, the endocytic vesicles are fused with the lysosome where α-Gal A plays its role, generating LacCer as a product of GSL degradation. The internalization of α-Gal A substrates into the cell is also possible through phagocytosis of old or damaged red blood cells (Elleder, 2010). Therefore, understanding and exploring the possible mechanisms of GSL trafficking may be important to predict the reaction of tissues and cells in their current environment and in response to several conditions.
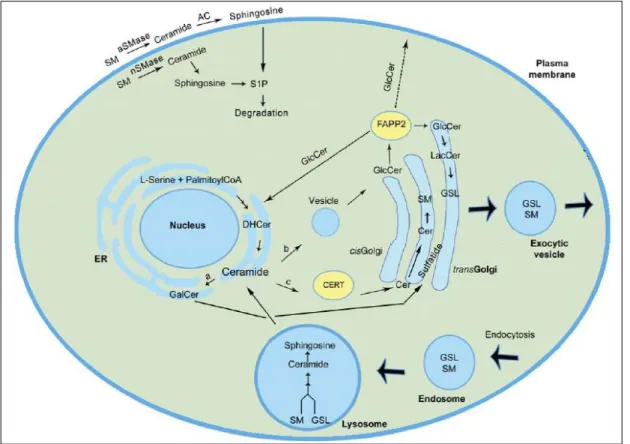
Figure 3: Schematic representation and localization of GSL metabolism in the cell. GSL biosynthesis starts in the ER. Ceramide
can be synthesized de novo from L-serine condensation with palmitoylCoA on the cytoplasmic face of ER or it can be formed from the GSLs recycled in the lysosome, specifically sphingosine. After this processes, ceramide can follow three possible pathways: a) it can form GalCer in the ER which on the other hand will generate sulfatide in the Golgi complex; b) it can be transported to the golgi complex in vesicles where it originates GlcCer on its cytoplasmic face; or c) ceramide can be transported to the mid-Golgi by CERT (ceramide transfer protein) to SM synthesis in the Golgi lumen. The FAPP2 (four-phosphate adaptor protein 2) enables the transport of GlcCer between ER and Golgi complex. GlcCer also reaches the cell membrane but the inherent mechanisms from which this happens are still unknown. FAPP2 is capable of transferring GlcCer from the cis face to the trans face of the Golgi complex as well, allowing the formation of a large variety of GSLs. Synthesized GSLs are then exocytosed from the cell to the extracellular matrix. Membrane GSLs recycling process starts by endocytosis and fusion with a lysosome for their degradation to sphingosine and free fatty acids. Membrane and cytosolic hydrolysis of SM can generate sphingosine as well which is further degraded. (Adapted from Xu et al, 2010).
[9]
1.4. Glycosphingolipid Storage in a Cellular and Subcellular
Perspective
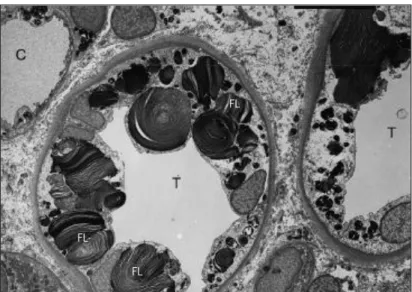
α-Gal A deficiency is correlated with appearance of lipid deposits inside the cells, more specifically within lysosomes. When GSLs start to accumulate, lysosomes acquire a conformation characterized by stacks of membranous structures with concentric or parallel disposition (zebra bodies; Figure 4). The circular deposits and fused lysosomes can be observed by convergence of two or more distinct laminar aggregate sets (Figure 4). Although the lipid aggregates entirely occupy the lysosome lumen and force lysosome expansion, no alterations are currently described for the biology of the lysosome. In 2008 Valbuena and coworkers hypothesized that the rupture of the storage lysosomes into the cytoplasm may be sufficient to cause cell death (Valbuena et al, 2008).
Figure 4: Lipid aggregates in Fabry disease. Photomicrograph of a kidney biopsy representing GSL deposits: in cells of
distal tubules (T) and in a capillary (C). Fused lysosomes (FL). (Germain, 2010).
The cell types affected by GSL storage in Fabry disease include endothelial cells, smooth muscle cells, cardiomyocytes, peripheral neurons and perineural cells, fibroblasts, pericapillary cells (i.e. pericytes and podocytes), ciliary epithelial cells, renal tubular epithelial cells, some secretory cells, macrophages and adipocytes (Figure 4 and 5, Chimenti et al,
FL
FL
[10]
2008; Elleder, 2003; Elleder, 2010; Hůlková & Elleder, 2010). Leukocytes are also affected in FD showing Gb3 deposits and physiologic alterations (Macedo et al, 2012; Rozenfeld et al, 2009a)
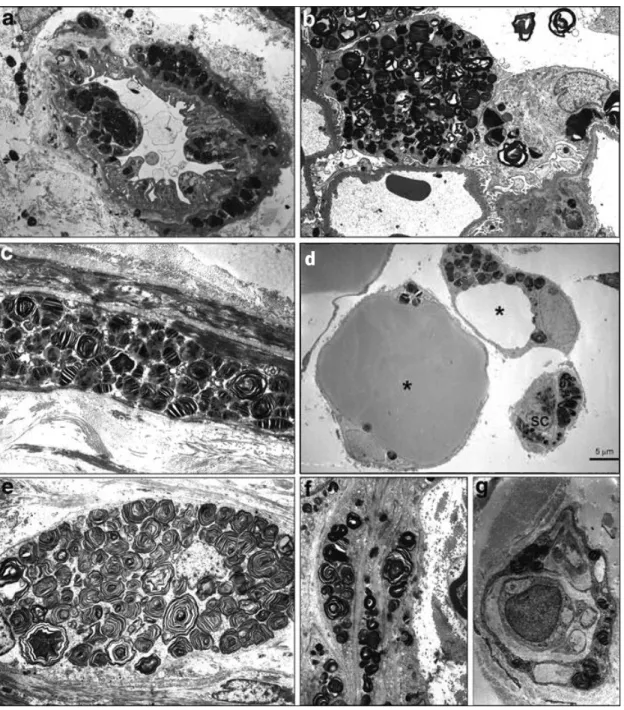
Figure 5: Some cell types known to express high degree of storage in Fabry disease. (a) complex capillary
endothelium-pericyte; (b) glomerular podocyte; (c) smooth muscle cell; (d) subcutaneous adipocytes (asterisks); (e) peripheral neuron in the bronchial wall; perineurial cells in large (f) and terminal (g) nerve fibres (magn. a, b, c, g 4,000×, f 3,000×). SC – collapsed storing capillary. (Adapted from Elleder, 2010 and Hůlková & Elleder, 2010).
[11]
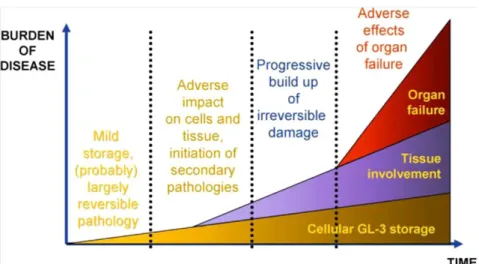
The extension of cell damage and the number of affected cells within an organ will determine the burden of the disease. These factors worsen as the disease progresses resulting in dysfunction of several organs (Figure 6; Eng et al, 2007).
Figure 6: Schematic model of Fabry disease progression. (Eng et al, 2007).
1.5. Clinical Profile and Pathophysiology
The pathological processes and the majority of the clinical manifestations become more severe with aging, however some of the pathological events have an early onset and can be detected at a pediatric age (see Table I). FD has a wide spectrum of clinical manifestations and systemic organ commitment is observed in patients with the classic phenotype (patients with null α-Gal A activity). The clinical profile of these patients involves left ventricle hypertrophy (LVH), acute and chronic neuropathic pain, renal insufficiency, skin lesions, ocular alterations and gastrointestinal symptoms (Germain, 2010).
The renal insufficiency develops as a consequence of cellular lesions caused by Gb3 storage, mainly in the glomerulus and podocytes, but damage also occurs in glomerular endothelial, mesangial and parietal epithelial cells (Alroy et al, 2002). This background evolves to mesangial widening and, in later stages, to glomerulosclerosis. Alterations in distal tubular epithelial cells and, in less extent, in proximal tubular epithelial cells, in addition to vascular lesions, will progressively cause tubular atrophy and interstitial fibrosis (Alroy et al, 2002).
[12]
Proteinuria results as a sign of renal function impairment and in adulthood renal insufficiency occurs due to chronic kidney disease, leading the patient to hemodyalisis (Desnick et al, 2003).
Table I:Early signs and symptoms of Fabry disease. (adapted from Eng et al, 2007).
A renal variant of FD was detected in a Japanese study, where hemodialysis patients with glomerulonephritis presented absent or low α-Gal A activity. One novel and two previously described mutations in the GLA gene were identified (Nakao et al, 2003). In this variant, some FD patients present disease manifestations confined to the kidney, but they may also develop vascular disease of the heart or brain later in life (Germain, 2010).
FD also promotes the development of cardiomyopathies, like LVH, arrhythmias, conduction and valvular abnormalities, and coronary heart disease (Germain, 2010). The
Organ system Sign/Symptom
Nervous system Acroparesthesias Nerve deafness Heat intolerance Hearing loss, tinnitus
Gastrointestinal
tract Nausea, vomiting, diarrhea
Postprandial bloating and pain, early satiety Difficulty in gaining weight
Skin Angiokeratomas Hypohidrosis
Eyes Corneal and lenticular opacities Vascolopathy (retina, conjuntiva)
Kidneys Microalbuminuria, proteinuria Impaired concentration ability Hyperfiltration
Increased urinary Gb3 excretion
Heart Impaired heart rate variability Arrhythmias
Electrocardiogram abnormalities Mild valvular insufficiency
[13]
cellular processes leading to these alterations develop throughout patient’s life, with accumulation of GSLs, particularly Gb3, on coronary arteries, myocardium, endocardium, and intravascular and intracardiac nerves (Askari et al, 2007).
Myocardial fibrosis is another pathological process described in FD patients (Hasegawa et al, 2006; Moon et al, 2006). In advanced cases, transmural replacement fibrosis evolves to a congestive heart failure (Germain, 2010).
The heart is predisposed to the GSL storage and in some cases it can be the only affected organ. This particular phenotype of FD is described as the cardiac variant of the disease and it is the most frequent atypical variant. Manifestations include cardiomegaly, electrocardiographic abnormalities consistent with cardiomyopathy, non-obstructive hypertrophic cardiomyopathy and myocardial infarctions (Germain, 2010).
Vascular lesions caused by GSL excessive storage origin angiokeratomas, which are characterized by single or clustered small reddish purple, raised superficial skin lesions. Generally this manifestation can be localized on the buttocks, groin, umbilicus and upper thighs (Germain, 2010). Skin sweat glands are affected by FD as well, leading to anhydrosis or hypohydrosis, which can cause heat and exercise intolerance (Eng et al, 2006; Kang et al, 1987; Orteu et al, 2007; Shelley et al, 1995).
Cornea opacities, commonly called cornea verticillata, and a corneal haze, are present in many FD patients but do not affect the vision capacity (Orssaud et al, 2003). Conjunctival and retinal vascular tortuosity can be observed in some patients as well as anterior and posterior subcapsular cataracts (Nguyen et al, 2005; Orssaud et al, 2003; Sodi et al, 2007). The posterior subcapsular cataract is considered the only pathognomonic clinical event of FD, therefore described as “Fabry cataract” (Germain, 2010). Optic neuropathy was also detected in FD patients in a pilot study (Pitz et al, 2009).
Cerebrovascular complications strongly contribute to morbidity and mortality of FD patients and are related to lesions in the large and small vessels, and alterations in other elements of the Virchow’s triad (which include factors that are thought to contribute to thrombosis, being the endothelial injury of brain vessels one of them; Fellgiebel et al, 2006; Moore et al, 2007). The most preoccupying manifestations observed in FD patients are transient ischemic attacks and strokes, that include ischemic and hemorrhagic stroke, and both have onset around the forth decade of life (Schiffmann et al, 2009). Symptoms like
[14]
headache, vertigo/dizziness and vascular dementia have also been reported (Mendez et al, 1997; Mitsias & Levine, 1996). Besides the clinical manifestations FD patients also develop periventricular white-matter lesions, microbleeds, cortical grey-matter infarcts and deep lacunar infarcts in both grey and white matter (Buechner et al, 2008; Jardim et al, 2004; Sims et al, 2009).
Gastrointestinal symptoms are common between FD patients and include post-prandial abdominal pain, diarrhea, nausea and vomiting (MacDermot et al, 2001a; Mehta et al, 2004; Rowe et al, 1974; Stryker & Kreps, 2001). Achalasia (esophageal motility disorder that can result in gastric reflux) and jejunal diverticulosis (able to cause small bowel perforation) can also occur (Banikazemi et al, 2005). These clinical manifestations are thought to be related to neuropathy of the autonomic nervous system and deposition of GSLs in ganglia and small mesenteric vessels (Hoffmann et al, 2004).
Neuropathic pain is present very early in FD patients and is generally the first clinical manifestation of the disease. However, the peripheral somatic and autonomic nerve systems are already affected in childhood and 41-59% of the FD children from both genders feel pain (Cable et al, 1982; Dutsch et al, 2002). In adolescence, the neuropathic pain experience increases to 65-81% among FD patients (Hopkin et al, 2008). Pain can be characterized by episodic crises of acute burning pain at the extremities or chronic paraesthesias, triggered by physical or emotional stress (Hoffmann et al, 2007). The physical limitations resulting from this symptom significantly reduce the patient’s quality of life (Germain, 2010).
1.5.1. Heterozygotes
For many years the FD females were seen as carriers of the disease, showing few or none of the clinical symptoms. However, the number of case reports including females showing signs and symptoms of FD, continued to increase, and large surveys among patients with FD revealed that there was a high prevalence of affected females (Figure 7; Desnick et al, 2001; Mehta et al, 2004; Bodamer, 2007). Since α-Gal A activity in FD females is often within the normal limits even in cases of severe clinical phenotype, it is difficult to elaborate the diagnosis, and therefore a combination of screening techniques including enzyme activity assays, measurement of urinary substrate excretion and molecular analysis, has to be carried out (Bodamer, 2007).
[15]
The most common complications experienced by FD heterozygous females are acroparesthesia, present in more than 80% of these patients since childhood (MacDermot et al, 2001b; Whybra et al, 2001), angiokeratoma, found in more than 55% of FD females (Whybra et al, 2001), renal impairment, affecting up to 50% of the female patients (MacDermot et al, 2001b; Wang et al, 2007) and cerebrovascular accidents, in 5-21% of the females (Fellgiebel et al, 2006; MacDermot et al, 2001b; Mehta et al, 2004; Rolfs et al, 2005). Heart manifestations were also found in some affected females, like hypertrophy, cardiomyopathy, cardiac valve disease, and arrhythmias (Chimenti et al, 2004; Elleder, 2010; Kampmann et al, 2002; Mehta et al, 2004; Shah et al, 2005).
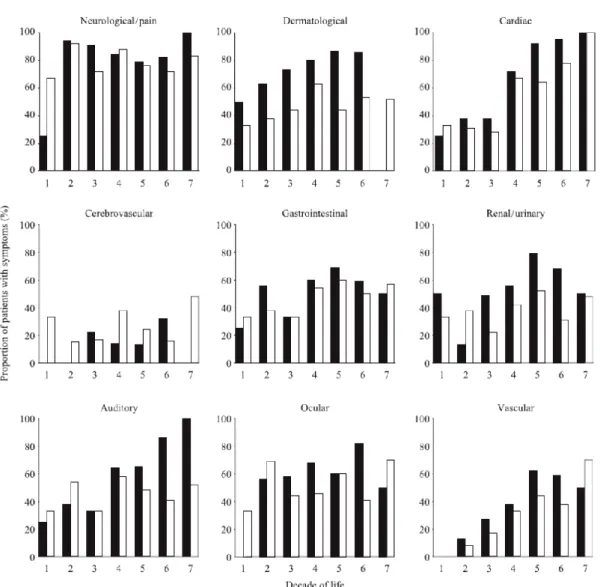
Figure 7: Reported signs and symptoms of Fabry disease among 366 FD patients. For this study it was considered
the age of the FD patients at the time of entry into the European Fabry Outcome Survey (FOS) in hemizygous males (black bars) and heterozygous females (white bars). (Mehta et al, 2004).
[16]
The lifespan of FD females is therefore reduced upon these complications and efforts must be made concerning their diagnosis, since many of the heterozygous females are still misdiagnosed.
1.6. Treatment
ERT is available for FD patients since 2001 in Europe in the form of two different drugs, Agalsidase alfa (Replagal®, Shire Human Genetic Therapies), and Agalsidase beta
(Fabrazyme®, Genzyme Corporation; Lidove et al, 2010).
Both Agalsidase alfa and beta are designed to boost α-Gal A activity. The amino acid composition of Agalsidase alfa and Agalsidase beta is the same and both are capable of successfully correct the substrate storage in FD patients cultured fibroblasts (Blom et al, 2003). On the other hand, differences in glycosylation and the number of mannose-6-phosphate residues have been described (Lee et al, 2003; Sakuraba et al, 2006). Agalsidase beta possesses more mannose-6-phosphate residues than Agalsidase alfa and the number of mannose-6-phosphate will influence the target compartment of these enzymes within the cell, which has to be the lysosome in order to fulfill its role. (Lee et al, 2003; Sakuraba et al, 2006). Since the glycosylation process might be important for enzyme input in human cells, and once glycosylation in Agalsidase beta is from non-human cells, it is possible that IgG antibodies are produced against this drug (Eng et al, 2001; Schiffmann et al, 2001). Nevertheless, the production of antibodies can be stimulated by both enzymes, with higher probability in patients with lower α-Gal A activity (Eng et al, 2001; Schiffmann et al, 2006). These antibodies neutralize the enzyme activity (Ohashi et al, 2007). Studies made on male patients being treated by ERT show that Agalsidase alfa is less antigenic than Agalsidase beta and therefore less antibodies are produced against this enzyme (Vedder et al, 2007a).
The approved dose of enzyme is 0.2 mg/Kg for Agalsidase alfa and 1.0 mg/Kg for Agalsidase beta every 15 days. Both treatments have variable results in FD patients, but preservation and stabilization of the renal function has been described, as well as reduction of cardiac hypertrophy, infarct and diarrhea episodes, fatigue and pain (Connock et al, 2006). Hearing loss, ‘psychological status’, frequency of physical exercise, ability to sweat and quality
[17]
of life were improved in treated patients (Connock et al, 2006; Wilcox et al, 2004). However ERT cannot stop FD from evolving if it is already in an advanced stage, especially when renal insufficiency is already present (Vedder et al, 2007a). For this reason, it is extremely important to start the therapy as soon as possible, in order to significantly improve lifespan of FD patients. An alternative to the ERT is Substrate Reduction Therapy (SRT), which inhibits the GSL biosynthesis in order to reduce accumulation of the α-Gal A substrates (Platt et al, 1994). This therapy was only tested in the animal model of FD and lymphoblasts of FD patients (Abe et al, 2000a; Abe et al, 2000b; Heare et al, 2007).
Although SRT and ERT can both reduce the storage substances, a recent study combining both therapies in FD mice revealed that SRT works as an adjuvant for ERT, improving the beneficial effects in many tissues, where higher storage clearance results were obtained (Marshall et al, 2010).
1.7. Laboratory Diagnosis of Fabry Disease
The Fabry outcome survey, a survey of a large cohort of Fabry patients, revealed that the average age for the FD diagnosis was 25.7 ± 15.3 years and 31.3 ± 17.4 years for male and female patients, respectively, with an average delay between onset of symptoms and diagnosis of approximately 12 years for both genders (Beck, 2006). Although the clinical history raises the suspect of FD, the definitive diagnosis in male patients is done when diminished α-Gal A activity is detected in a blood sample (Caudron et al, 2007; Desnick et al, 2001; Winchester & Young, 2006). The blood sample can either be leukocytes, plasma/serum (Winchester & Young, 2006) or DBSs (Chamoles et al, 2001; Gaspar et al, 2010). α-Gal A activity can also be determined in cultured fibroblasts, urine and other tissues (Winchester & Young, 2010). To confirm the diagnosis, mutational analysis of the GLA gene can be performed. In heterozygous females, the measurement of the α-Gal A activity is not sufficient to give a reliable diagnosis since the α-Gal A activity may be within the normal range, due to random inactivation of the X-chromosome (Germain, 2010). Hence, female samples must be submitted to mutation analysis as well.
[18]
The accumulation of α-Gal A substrates, namely Gb3 and lyso-Gb3, in plasma and urine can be measured and used to support the diagnosis and for treatment monitoring (Aerts et al, 2008; Eng et al, 2001; Togawa et al, 2010).
The described methods for direct Gb3 identification and measurement are thin-layer chromatography (TLC; Berná et al, 1999; Philippart et al, 1969), enzyme-linked immunosorbent assay (ELISA; Zeidner et al, 1999) and mass spectrometry (MS; Domon & Costello, 1988; Hsu & Turk, 2001; Mills et al, 2002). Other methods include immunohistochemistry (Selvarajah et al, 2011), indirect Gb3 identification by release of the oligosaccharide moiety by gas-liquid chromatography (GLC; Vance & Sweeley, 1967) or high-performance liquid chromatography (HPLC; McCluer et al, 1989; Ullman & McCluer, 1977).
The ultimate efforts made to improve the screening methodologies concern the mass or high-risk screening, based on measurement not only of α-Gal A activity and/or protein in DBSs, but also of the storage products in urine collected on filter paper. Some screening programs for FD based on MS measurement of Gb3 levels in urine and plasma, produced satisfactory and relevant results for comprehension of disease severity (Auray-Blais et al, 2007; Auray-Blais et al, 2006; Boscaro et al, 2002; Chien et al, 2011; Kitagawa et al, 2005). On the other hand, MS is a time-consuming method that is economically and technically very demanding, requiring specialized data interpretation.
TLC is a classic method for lipid identification used over thirty years in GSL analysis. The TLC resolving power, robustness and easy handling makes it a very reliable method for identification and separation of neutral GSLs and gangliosides (Kundu, 1981; Müthing, 1996; Müthing, 1998; Schnaar & Needham, 1994; Skipski, 1975; Yu & Ariga, 2000). Thus, it is a method suitable for a mass screening program.
The diagnosis of FD must be done as early as possible to achieve a better prognosis. However, the newborn screening of late onset X-linked disorders such as FD isn't generally accepted. For this reason, the screening of high-risk populations, which are composed of individuals with family history of FD or have symptoms compatible with FD, is the most adequate approach.
In fetus, the diagnosis can be achieved through the assessment of α-Gal A activity in the fetal tissues, since it reflects the genotype of the fetus. Hemizygous males are diagnosed due to deficient α-Gal A activity and heterozygous show variable amounts of activity. In male
[19]
fetus, the diagnosis can be made directly by measuring α-Gal A activity and/or mutation analysis (if the family mutation is known) directly in the chorionic villi and in cultured chorionic villi and amniotic cells (Winchester & Young, 2010). The female fetus can only be reliably diagnosed by mutational analysis, however it is not possible to predict what exactly will be the course and severity of FD in the heterozygous females for a certain mutation (Beck, 2006).
CHAPTER II
[20]
FD is a lysosomal storage disorder originated by a deficient activity of α-Gal A caused by mutations in the GLA gene. The substrates hydrolyzed by α-Gal A, such as Gb3 and other related GSLs, accumulate in different tissues and organs causing its dysfunction and are usually excreted in urine.
FD is an X-linked disease, however it is known that not only the males but also most of the females heterozygous for GLA mutations, present symptoms, although FD female patients have a late onset and show a slower progression of the disease. The severity and rate of progression of the disease is dependent on the degree of residual enzyme activity. The males with a classic form of FD are easy to diagnose since they present no residual activity, on contrast to females (heterozygous) and the males with a non classic form of FD, as they present some residual activity, and the diagnosis implicates combined biochemical and genetic analyses.
ERT is available for FD patients in the form of Agalsidase alfa and Agalsidase beta, both showing multi-organ beneficial effects. However, it must be noticed that the earlier the treatment starts, the higher are the chances of increasing the lifespan and quality of life of these patients.
Many studies focus on the diagnosis of FD by measuring the α-Gal A activity in blood and accumulation of its substrates, mainly Gb3, in urine and plasma of high risk populations. Mass spectrometry is widely applied for the screening of FD, as well as of other LSDs. However, mass spectrometry is a very expensive method, requires much skill from the operator and involves complex equipment. TLC is a robust and well explored method, suitable to analyse a large number of samples.
Urine samples are easy to collect, facilitating the cooperation of individuals, but on the other hand, the transportation is difficult without compromising the samples' integrity.
Thus, this study aims to use urine samples of FD patients to define a reliable diagnosis method, applicable to an automatic screening program of FD, and to follow the patients that are on ERT.
Therefore, this study has the following specific aims:
1. Simplification of the shipping method of urine samples using the filter paper as support material.
[21]
2. Optimization of the analysis method of Gb3 used in the laboratory for analysis of filter paper urine samples.
3. Obtain a screening system able of discriminating FD patients (males and females) from healthy individuals, and useful to follow FD patients under treatment.
4. Determination of the GSL profile in urine of FD patients, with known mutations of the GLA gene, before and after the beginning of the ERT.
CHAPTER III
[23]
3.1. Sampling
3.1.1. Biological samples
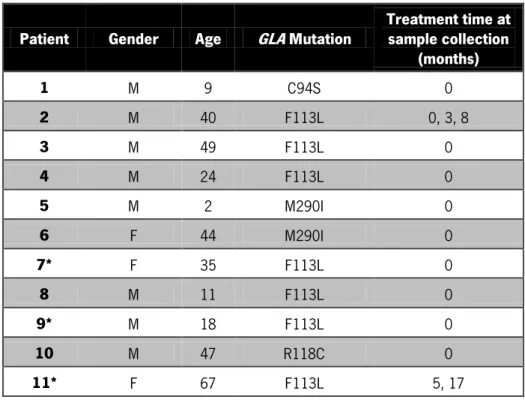
For this study eleven FD patients and thirty control subjects were analysed. The samples from control subjects were obtained from internal volunteers with representation of both genders and with ages between 20 and 69 years (Table II and Appendix I – Table III). Of the thirty control subjects 23 samples were collected with the filter paper kit. As for the FD patients, samples were obtained through a protocol established with the physicians and hospitals directly linked to the patients1. Samples from FD patients are from both genders and
their ages are between 2 and 67 years (Table IV). Due to the established protocols, all patient samples were conventionally collected. The GLA gene mutations were previously identified and the mutations C94S, F113L, M290I and R118C in the studied patients. Only two of the patients presented samples at least in two time points during ERT.
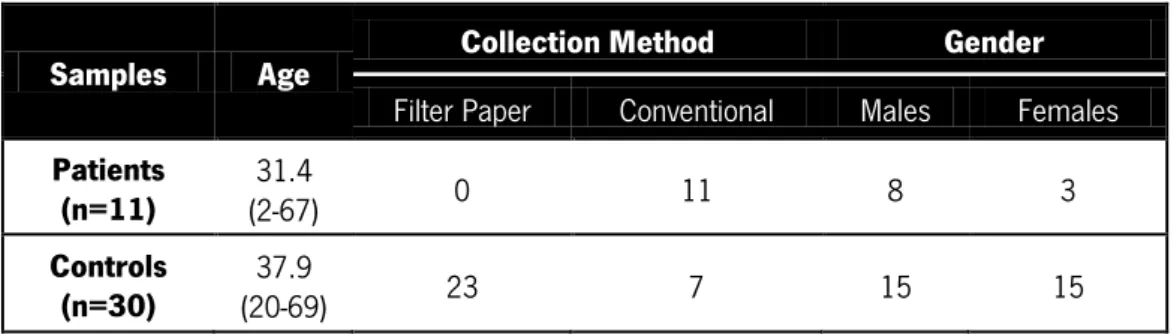
Table II: Cohort characteristics. Description of patient (n=11) and control subjects (n=30) regarding their age, collection
method (filter paper kit or conventional liquid collection) and gender. Age is presented as mean. The age range is displayed in parenthesis.
Samples Age Collection Method Gender
Filter Paper Conventional Males Females
Patients
(n=11) (2-67) 31.4 0 11 8 3
Controls
(n=30) (20-69) 37.9 23 7 15 15
1 Protocols established between Dr. Olga Azevedo – Centro Hospitalar do Alto Ave, Dr. Elisa Leão – Hospital S. João, Dr. Célia Barbosa – Hospital Pedro Hispano and Dr. Miguel Rodrigues – Centro Hospitalar de Setúbal.
[24]
Table IV: Characteristics of FD patients. Discrimination in terms of gender, age, GLA gene mutation and treatment duration at the time of sample collection. M – male; F – female. Asterisk (*) represents family related patients.
Patient Gender Age GLA Mutation Treatment time at sample collection (months) 1 M 9 C94S 0 2 M 40 F113L 0, 3, 8 3 M 49 F113L 0 4 M 24 F113L 0 5 M 2 M290I 0 6 F 44 M290I 0 7* F 35 F113L 0 8 M 11 F113L 0 9* M 18 F113L 0 10 M 47 R118C 0 11* F 67 F113L 5, 17 3.1.2. Sample Collection
Liquid urine samples were collected in the flask seen in Figure 8, aliquoted and frozen at -20 ºC until the analysis. Filter paper urine samples were collected using the kit in Figure 9. The recipient carried two filter paper squares, each one of 5 x 5 cm and was accompanied by an envelope containing a forceps. The donor was instructed of how to collect the sample and handle the filter papers through an instructions sheet (Appendix I – Figure 10). The collection indications were as follows: 1) dispose the excess of urine after absorption by the filter papers; 2) dry the filter papers at room temperature; 3) use the forceps to handle the dried filter papers and send them by mail using the provided envelope. At the arrival, the samples were catalogued and stored at -20 ºC in a sealed bag.
[25]
Figure 8: Conventional collection urine flask. Urine collection flask with capacity to 100 mL.
Figure 9: Filter paper kit. A. Urine collection container of 200 mL with two 5 x 5 cm filter papers (Whatman® #903). B.
Filter paper kit for urine collection composed by one urine container with filter papers, one envelope and one sealed forceps.
All our patient samples were 20 mL conventionally collected urine samples stored at -20 ºC. For this matter, these samples had to be defrosted and applied to filter papers, 2 mL per filter paper.
3.2. Reagents and Standards
Organic solvents such as chloroform (CHCl3) and methanol (MeOH; Fisher Scientific®
HPLC grade) were used to make organic solvent solutions or for single use.
The derivatization solution was produced with p-anisaldehyde (Sigma Aldrich®) and 96%
[26]
Several glycosphingolipid standards were used to prepare standards for the HPTLC plates, to spike and overload samples. The standards were SM, Gb4q, Gb3, LacCer, GlcCer and phosphatidylethanolamine (PE) from Matreya®.
3.3. Methods
In order to carry out the proposed aims, blood and urine samples collected on filter paper were analyzed. High-Performance Thin-Layer Chromatography (HPTLC), was used to identify traceable amounts of GSLs excreted in urine, namely Gb3. This technique was optimised to improve its sensitivity and to decrease its time duration for a better discrimination of FD patients and control subjects. This part was developed within the screening project for FD from Instituto de Biologia Molecular e Celular – Instituto de Engenharia Biomédica (IBMC-INEB), in Portugal, fellowship PTDC/SAL-BEB/100875/2008. The obtained results were also integrated in the IBMC-INEB project. The INEB team is currently developing an automatic screening software.
3.3.1. High-Performance Thin-Layer Chromatography for Conventional Urine Samples
Liquid urine samples are dialyzed in 12-14 kDa dialysis membrane against 0.01% sodium azide and dried by lyophilization.
Lipids are then extracted in two cycles with centrifugation: one cycle of 1min vortexing with 20:1.5 (v/v) MeOH/H2O and CHCl3 and one cycle of 1 min vortexing with 1:2 (v/v)
CHCl3/MeOH, followed by concentration under N2 stream, at 40 ºC.
The total lipid extract is then fractionated in C18 chromatography columns (Chromabond® C18 octadecyl-modified silica columns). Neutral lipids are recovered by a 1:2
(v/v) CHCl3/MeOH solution. The existing contaminants are removed and the acidic lipids are
discarded. In order to remove phosphoglycerides, neutral lipids are subjected to alkaline hydrolysis with sodium hydroxide. After hydrolysis, dried fractions are reconstituted in 1:2 (v/v) CHCl3/MeOH and applied to an HPTLC silica gel plate (Merck® HPTLC silica gel 60 plates)
[27]
and semi-quantification of the lipids on each sample, a mixture of standard lipids incorporating known amounts of SM, Gb4, Gb3, LacCer, GlcCer and PE is applied (Table V). Plates are developed with 70:30:5 (v/v) CHCl3/MeOH/H2O in a TLC chamber (Camag®) and dried under
a flow of hot air. The resulting separated lipids are visualized as purple bands by pulverizing the plate with an p-anisaldehyde/ H2SO4 solution (1% p-anisaldehyde in 80% H2SO4) followed by
heating the plate in the oven at 120ºC until the appearance of bands. Plates are digitalized and bands are quantified by the UN-SCAN-IT gel automated digitizing system software version 5.1 (Silk Scientific corporation).
Table V: Constitution of a standard mixture for HPTLC. 30 μL 0.2 μg/μL disposable mixture aliquots.
GSL Quantity per 10 μL GlcCer 2 µg PE 2 µg LacCer 2 µg Gb3 2 µg SM 2 µg Gb4 4 µg
This procedure will allow the classification and semi quantification of the lipids present in each sample, allowing a rapid screening of significant alterations in the lipid profile as compared to control samples.
CHAPTER IV
[29]
4.1. High-Performance Thin-Layer Chromatography Optimization
for Filter Paper Urine Samples
4.1.1. Validation of Filter Paper for HPTLC Analysis
Liquid urine samples are difficult to send to the laboratory and only are viable for several hours before the storage at -20 ºC. On the other hand, filter papers can be sent by mail and are viable for several weeks even at room temperature (Auray-Blais et al, 2007). However, the HPTLC method was not adapted to filter paper collected samples. The main problem was the significantly lower urine quantity held by the filter paper when compared to the conventionally collected urine samples. In order to do the screening for FD, 20 mL of urine are needed, but the filter paper squares (5 x 5 cm) only absorb a maximum of 2 mL.
To evaluate if the use of 1filter paper is a suitable approach, the same urine sample was added to one filter paper and two filter papers (approximately 4 mL; Figure 11). The Gb3 of each sample was normalized to SM values. SM is an adequate physiological representative of Gb3 excretion, as like Gb3, it can be localized at the cellular membrane (Barr et al, 2009). Because the SM and Gb4 bands usually overlap they are identified as a group.
It is visible that in the urine samples applied to two filter papers the GSL bands are stronger, when compared to samples applied to one filter paper (confirmed in Table VI). The ratio of Gb3 to SM+Gb4 of the one filter paper sample overloaded with Gb3 proved to be higher than the one from the two filter papers, not because of Gb3 bands intensity but because there was less SM quantified, in similarity to the non-overloaded samples.
Analyzing the Gb3 band in overloaded samples it is also clear that the use of two filter papers does not interfere with Gb3 identification and band density. Therefore, in order to increase the amount of GSLs in urine samples, the minimum sample quantity was defined as two filter papers.
[30]
Figure 11: Analysis of 1 and 2 filter papers from a control sample. An urine sample from a control subject was
applied to filter papers and analysed by the conventional HPTLC method. The same sample was divided into: 1) 2 filter papers, 2) 1 filter paper, 3) 1 filter paper overloaded with 2 µg of Gb3, and 4) 2 filter papers overloaded with 2 µg of Gb3. F.P. – filter paper. Std. – standards (2 µg). The applied standard mixture contained 2 µg of SM, Gb3, LacCer, PE and GlcCer and 4 µg of Gb4.
Table VI: Densitometry of Gb3 and SM+Gb4 bands from the filter paper samples. The SM/Gb4 and the Gb3 bands
from the samples of the control subject previously analysed by HPTLC were quantified by densitometry. SM/Gb4 group was analysed separately of Gb3. The ratio of Gb3 to SM+Gb4 was calculated to normalize the samples. The represented pixels are the result of the background pixels subtracted to the total band determined pixels. 2 F.P. – two filter papers of the urine sample; 1 F.P. – one filter paper of the urine sample; 1 F.P. + Gb3 – one filter paper of the urine sample overloaded with Gb3; 2 F.P. + Gb3 – two filter papers of the urine sample overloaded with Gb3. Gb3 overload – 2 µg; n.d. – non-detected.
Lane (pixels) Gb3 SM+Gb4 (pixels) Gb3/SM+Gb4 (pixels)
2 F.P. 77.1 497.9 0.15
1 F.P. n.d. 349.3 n.d.
1 F.P. + Gb3 82.0 355.7 0.23
2 F.P. + Gb3 92.4 514.6 0.18
This change was tested in several naïve patient samples (not on ERT; Figure 12). Although the filter paper Gb3 bands were markedly weaker compared to the ones obtained
[31]
from liquid samples, the FD patients detected in liquid samples were also detected by filter paper analysis. Moreover, the software that is currently being developed must be sensitive enough to discriminate FD patients from controls.
Figure 12: FD patients’ analysis of conventional 20 mL urine samples and urine samples applied to filter papers. 20 mL urine samples from previously diagnosed FD patients (P1-P4) were analysed by the conventional HPTLC
method prior to this study. The same samples were added to two filter paper squares and analysed by the optimised HPTLC method that is later described in this work2. Std. – standards (2 µg). The applied standard mixture contained 2 µg of SM, Gb3,
LacCer, PE and GlcCer and 4 µg of Gb4.
4.1.2. Extraction Method
The extraction method limits the lipid quantity available for the following HPTLC steps. The mechanical procedures (centrifugation, sonication and agitation) and the organic solvent solutions were the tested conditions.
The centrifugation steps are crucial for protein precipitation. However, the filter paper was described as a good support for proteins since they do not enter in solution during the extraction process (Müthing & Distler, 2009). It has also been suggested that the desquamated urinary tract cells may still be intact in the urine extract and that sonication improves the amount of detected lipid by disrupting the existing cellular and lysosomal membranes (Auray-Blais et al, 2006). Hence, three different extraction processes were tested using a filter paper control sample overloaded with both SM and Gb3 (Figure 13).
2 As there are few urine samples from FD patients, the filter paper analyses of all the patients simultaneously were only performed when the method was optimised.
[32]
Figure 13: Evaluation of different extraction conditions. A control urine sample collected by the filter paper kit was subjected to three
extraction conditions, using for each one, two filter papers: centrifugation (“Cent.”) at 3000 rpm for 10 minutes (twice) after the agitation with organic solvents; no centrifugation and no sonication steps (“no Cent./Son.”); and sonication in water bath for 5 minutes (“Son.”) of the final extract (after the second extraction cycle). Before the extraction, each two filter paper squares were overload with 4 µg of Gb3 and 10 µg of SM. Std. – standards (2 µg). The applied standard mixture contained 2 µg of Cer 4 (asialoganglioside GM1), 2 µg of SM, 2 µg of Gb4, 2 µg of Gb3, 4 µg of LacCer, 2 µg of PE and 2 µg of GlcCer.
The first extraction process encompasses two centrifugation steps, the second extraction process had no centrifugation or sonication steps and the third was defined by a sonication step. By densitometry of Gb3 bands it becomes clear that centrifugation decreases the Gb3 quantity at the end of the extraction process. This is probably due to the extract volume retained in the filter paper as a consequence of filter paper compression during centrifugation (Table VII).
Table VII: Densitometry of Gb3 and SM+Gb4 bands from urine samples extracted under different conditions. The represented
pixels were determined as a result of background subtraction to the total pixels per band. Gb3 pixels and SM+Gb4 pixels were measured by densitometry of the Gb3 and SM+Gb4 areas. Cent. – 2x 10 minutes centrifugation at 3000 rpm; no Cent./Son. – no centrifugation or sonication steps; Son. – sonication for 5 minutes in a water bath.
Lane Gb3 pixels SM and Gb4 pixels
Cent. 1252.1 1181.5
no
Cent./Son. 1817.3 1544.7
[33]
On the other hand, adding a sonication step increased the Gb3 band density which indicates that more lipid was present in the extract. Although 4 μg of Gb3 were added to the control sample, there is always some GSL content from the sample itself, producing an increment in density relatively to the sample that was not sonicated. The densitometry of the SM and Gb4 bands confirmed this theory.
Together, these modifications increased the efficiency of the extraction method, which led to an improvement of the detection limit.
The type and duration of agitation during the extraction procedure is also a determining factor for an efficient lipid extraction. In order to evaluate this factor, an empty filter paper was overloaded with Gb3 and subjected to different agitation conditions (Figure 14A).
The standard extraction, with two cycles of organic solvents and 1min vortexing (or 5 minutes in a multi-vortex), was compared to: 1) three cycles of organic solvents, 2 h each in a roller agitator, and 2) one cycle of 1min vortexing with organic solvents and one cycle of 24 h agitation in a roller agitator with organic solvents. Better results were obtained with a roller agitator when the agitation time was increased to 24 h. This observation was confirmed by densitometry (Table VIII of Appendix II).
Another issue involves the concentration of organic solvents. The ratio between the organic solvents is very important for an adequate extraction of the the lipids of interest. Some authors use a 2:1 (v/v) CHCl3/MeOH ratio for GSL extraction (Krüger et al, 2010; Roy et al,
2004; Rozenfeld et al, 2009b). With the aim of exploring this variant, a filter paper control sample was extracted with 2:1 (v/v) CHCl3/MeOH ratio and the conventional 1:2 (v/v)
CHCl3/MeOH ratio (Figure 14B). Because the control sample did not have elevated GSL
content, filter papers were overloaded with different quantities of Gb3 (2 μg and 4 μg). With the Gb3 overload of control samples it was clear that the utilization of the 2:1 (v/v) CHCl3/MeOH
in substitution of the standard 1:2 (v/v) CHCl3/MeOH ratio led to less GSL content on the
[34]
Figure 14: Test of different extraction agitation methods and organic solvent solutions. In A, six pairs of empty
filter papers were overloaded with 10 µg of Gb3 and extracted with: 1) one cycle of 5 minutes vortexing at room temperature and one cycle of 24 h at 4 ºC in a roller agitator (“24 h” lanes); 2) three cycles of 2 h at 4 ºC in a roller agitator (“3 x 2h” lanes); and 3) two cycles of 5 minutes multi-vortexing at room temperature (“5 min” lanes). In B, the same control sample collected in filter papers was extracted with 1:2 (v/v) of chloroform/methanol (lanes 1, 3 and 5) and 2:1 (v/v) of chloroform/methanol (lanes 2, 4 and 6), without Gb3 overload (lane 1 and 2), with 2 µg of Gb3 (lanes 3 and 4) and with 4 µg of Gb3 (lanes 5 and 6). Analysis of two filter paper squares per lane. C/M (1:2) – 1:2 (v/v) chloroform/methanol; C/M (2:1) – 2:1 (v/v) chloroform methanol; Gb3 overload: no Gb3 overload “-“, 2 µg of Gb3 “+” and 4 µg of Gb3 “++”; Std. – standards (2 µg). The applied standard mixture contained 2 µg of SM, Gb3, LacCer, PE and GlcCer and 4 µg of Gb4.
[35] 4.1.3. Lipid Fractionation Process
C18 reverse phase silica columns are specific for neutral substances. However, their efficiency is not 100%. As the polypropylene material used for fractionation is a source of contaminants, all the pieces preventing the sample from a direct contact with the C18 column were removed.
To address the most adequate solvent volume to elute neutral lipids and increase the amount of lipid eluted from the C18 column, a known quantity of Gb3 was added to a C18 column and the efficiency of the organic solvent volume used in the protocol [8 mL of 1:2 (v/v) CHCl3/MeOH] was compared to the double volume of the same organic solvent solution
(Figure 15). Still, no improvement was seen. In fact, there was less lipid content in the lanes of more eluted samples. The loss of lipid content was even higher in the Gb3 eluted with 16 mL of organic solvent solution when compared to pure Gb3 lanes (Table IX).
Figure 15: Elution of neutral lipids fraction. 4 µg of Gb3 were applied to eight C18 reverse phase columns and
fractionated by the conventional method for lipid fraction collection. The only modification was the removal of the plastic material. The neutral lipids’ fraction was eluted with 8 mL of 1:2 (v/v) CHCl3/MeOH (“8 mL C/M (1:2)” lanes), and with 16 mL
of 1:2 (v/v) CHCl3/MeOH (“16 mL C/M (1:2)” lanes). To compare the Gb3 obtained from the fractionation process to the
initially added Gb3, two lanes with 4 µg of pure Gb3 were added to the HPTLC plate (“Pure Gb3” lanes). C/M (1:2) – 1:2 (v/v) CHCl3/MeOH; Std. – standards (2 µg). The applied standard mixture contained 2 µg of SM, Gb3, LacCer, PE and GlcCer and 4