*Correspondence: P. A. Marinho. Instituto de Criminalística de Minas Gerais. Rua Juiz de Fora, 400 - Bairro Barro Preto - 30180-060 - Belo Horizonte - MG, Brasil. E-mail: [email protected]
A
rti
Pharmaceutical Sciences vol. 46, n. 4, out./dez., 2010
Quantiication of LSD in illicit samples by high performance liquid
chromatography
Pablo Alves Marinho
1,*, Edna Maria Alvarez Leite
21Institute of Criminology of Minas Gerais, Belo Horizonte, 2Toxicology Laboratory, Pharmacy College, Federal University of Minas Gerais
In the present study, a method using high performance liquid chromatography to quantify LSD, in blotter papers seized in Minas Gerais, was optimized and validated. Linearity, precision, recovery, limits of detection and quantiication, and selectivity were the parameters used to evaluate performance. The samples were extracted with methanol:water (1: 1) in an ultra-sound bath. The linearity between 0.05 and 20.00 µg/mL (0.5 and 200.0µg of LSD/blotter) was observed with satisfactory mean intra and inter assay precision (RSDr = 4.4% and RSDR = 6.4%, respectively) and with mean recoveries of 83.4% and
84.9% to the levels of 1.00 and 20.00 µg/mL (10 and 200µg LSD/blotter). The limits of detection and quantiication were 0.01 and 0.05 µg/mL, respectively (0.1 and 0.5 µg of LSD/blotter). The samples of blotters (n =22) were analyzed and the mean value of 67.55 µg of LSD/blotter (RSD=27.5%) was found. Thus, the method used showed satisfactory analytical performance, and proved suitable as an analytical tool for LSD determination in illicit samples seized by police forces.
Uniterms: LSD/detection. Forensic chemistry. Analytical toxicology. In-house validation. High Performance Liquid Chromatography/quantitative analysis.
No presente trabalho, um método utilizando cromatograia líquida de alta eiciência foi otimizado e validado para quantiicar o LSD em selos apreendidos em Minas Gerais. A linearidade, precisão, recuperação, limites de detecção e quantiicação e seletividade foram os parâmetros de desempenho avaliados. As amostras foram extraídas com metanol: água (1:1) em banho de ultra-som. A linearidade entre 0,05 a 20,00 mg/mL (0,5 a 200 µg LSD/blotter) foi observada com precisão média, intra e inter ensaio, satisfatória (RSDr = 4,4% e RSDR = 6,4%, respectivamente) e com recuperações médias de 83,4%
e 84,9% para os níveis de LSD de 1,00 e 20,00 mg/mL (10 e 200 µg LSD/selo). Os limites de detecção e quantiicação encontrados foram de 0,01 e 0,05 mg/mL, respectivamente (0,1 e 0,5 µg LSD/selo). As amostras de selos (n = 22) foram analisadas e o valor médio encontrado foi de 67,55 µg de LSD/selo (RSD% = 27,5). Desta forma, o método analítico apresentou desempenho satisfatório, capaz de ser utilizado como instrumento de análise para a determinação do LSD em amostras ilícitas apreendidas pelas forças policiais.
Unitermos: LSD/detecção. Química Forense. Toxicologia analítica. Validação intralaboratorial. Cromatograia líquida de alta efeciência/análise quantitativa.
INTRODUCTION
The Swiss chemist Albert Hofmann irst synthesized LSD (lysergic acid diethylamide) in 1938. The short form LSD comes from its early code name LSD-25, which is an
abbreviation for the German “Lysergsäure-diethylamid” followed by a sequential number (NIDA, 2001; Cashman, 1980).
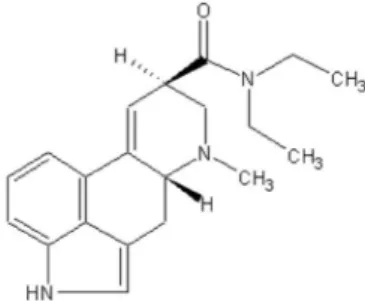
LSD chemical structure is shown in Figure 1. Lysergic acid diethylamide commonly known as acid, lysergide or sweet is a semisynthetic drug made from lysergic acid, an alkaloid produced by fungus Claviceps purpurea (Oga, 2003; Schiff, 2006).
such as sugar cubes, paper dosage units (blotter papers), small tablets (microdots), and gelatin matrix containing LSD that is solidiied and cut into square pieces called windowpanes (United Nations, 2003, 1989).
Research carried out in Brazil in 2005, by the Centro Brasileiro de Informações sobre Drogas Psico-trópicas- CEBRID (Brazilian Center for Information on Psychotropic Drugs) and Secretaria Nacional Antidrogas – SENAD (National Anti-drugs Secretariat) showed that 1.1% of Brazilians have used hallucinogens at least once in their lifetime. These rates are lower than those found in the survey carried out by the Substance Abuse and Mental Health Services Administration SAMHSA (14.3%) (Car-lini et al., 2005).
Brazilian law prohibits the use of LSD and its isomers in the country (Resolution 344/1998 of Agência Nacional de Vigilância Sanitária-ANVISA) but statistics compiled by the Observatório Brasileiro de Informações sobre Drogas-OBID showed an increase (539 %) in LSD seizure by National Police from 2004 to 2006. Thus, it is very important to identify the drugs seized.
Ultraviolet (UV) irradiation, color tests using
Ehrlich’s reagent, reagent of Mandelin or Marquis and thin layer chromatography (TLC) with luorescent addi-tive in the stationary phase for instance, can all be used to screen for LSD in illicit samples (United Nations, 1989; Moffat, 2004).
Usual techniques for quantiication of LSD are high performance liquid chromatography with luorescence, ultraviolet or mass spectrometry detection, as well as gas chromatography and capillary electrophoresis with mass spectrometry detection. (Chung et al., 2009; Shutter et al., 2009; Favretto et al., 2007).
Unfortunately, few laboratories of toxicology in Brazil and other developing countries are equipped to follow international protocols. The lack of equipment for mass spectrometry in these laboratories can be explained by the high cost of acquisition and maintenance of such equipment (GGLAS, 2008). Moreover, there are no studies on the quantitative proile of LSD in illicit samples seized
in Brazil and this gap precludes intra- and inter-regional comparative studies on these samples.
Thus, the aim of the present study was to optimize and validate an analytical method for LSD determination in samples of blotter papers traded illicitly, using high performance liquid chromatography with an ultraviolet detector (HPLC-UV) and determination of the quantitative proile of the analyzed samples.
MATERIAL AND METHODS
Instrument
Chromatographic analysis was performed by a Hewlett Packard® HPLC, model HP 1200 Series, equipped
with isocratic pump, ultraviolet detector and ChemStation Rev.B.02.01 software (Agilent Technologies 2001-2006). A Zorbax Eclipse XDB - C8, 5 µm (150 mm x 4.6 mm) column (Agilent Technologies®) was used.
Standards and reagents
Lysergic acid diethylamide (LSD) – 1.0 mg/mL; Lysergic acid methylpropylamide (LAMPA) – 1.0 mg/ mL; (-) ∆9-Tetrahydrocannabinol (THC) – 1.0 mg/mL,
were used, all obtained from Cerilliant Corporation®
(Texas, U.S.A.). Trade standards of caffeine (Synth®),
benzocaine (Sigma-Aldrich®), lidocaine (Sigma-
Aldri-ch®) and cocaine extract were puriied by our laboratory.
Acetonitrile and methanol grade HPLC (J.T. Baker®);
acid acetic (Vetec®) and ammonium carbonate (Reagen®)
grade PA was used.
Samples
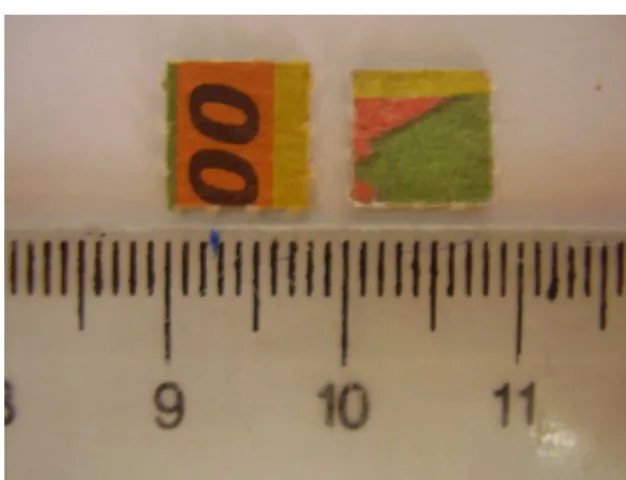
Samples of blotters came (n=22) from seizures car-ried out by the police of Minas Gerais State between 2006 and 2009 and were sent to the Institute of Criminology of Minas Gerais in order to be examined by chemical-toxicological assay. The blotters had an average mass of 17 µg and dimensions of 7 x 7 mm, as shown in Figure 2.
METHODS
Sample preparation
The samples were extracted with 2.0 mL of me-thanol: water (1:1) for twenty minutes in an ultrasonic bath, changing the solvent extractor every 5 minutes, in order to extract the maximum LSD impregnated in the blotters.
FIGURE 1 - LSD chemical structure (P.M.: 323.432; CAS:
Instrumental conditions
T h e m o b i l e p h a s e w a s c o m p o s e d o f methanol:acetonitrile (75:25) - ammonium carbonate 1.0 g/L (1:1), pH = 8.2. The mobile phase low was kept in the isocratic form (1.0 mL/min) and the injection volume was 50 µL. The wave length selected for LSD detection was 220 nm and the total running time was set at 12 minu-tes. The LSD retention time was 7.7 ± 0.3 minuminu-tes.
Validation procedure
The performance characteristics of the method were established by in-house validation procedures. During method validation the parameters linearity, precision, recovery, limits and selectivity were assessed. In order to study the method linearity, ive levels of concentration of LSD were prepared in triplicate (from 0.05 to 20.0 µg/mL).
The ordinary least squares method (simple linear regression) was used for the linearity curve construction, curve equation evaluation, determination coeficient (R2)
and visual inspection of graph x/y. Residues of regression were also veriied.
In contrast, according to reports of numerous refe-rences, linearity cannot be evaluated by the determination of correlation coefficient alone, where a more refined statistical study is required in order to conirm linearity. The assumptions of studies of linear regression (normali-ty, homoscedastici(normali-ty, and independence) are encouraged to verify the adjustment to the proposed model (Draper, Smith, 1998; RSC, 2005; Souza, 2007; Burke, 2001).
Normality, homoscedasticity and independence were tested by the statistic tests of Ryan-Joiner (1976), Brown-Forsythe (1974) and Durbin-Watson (1951), res-pectively.
FIGURE 2 - Two samples of blotters seized and analyzed by
present method.
The Jacknife standardized residue test was used to verify the presence of outliers. This was applied successi-vely until no outliers were detected, or until outlier presen-ce did not expresen-ceed 22% of the initial value (Horwitz, 1995). Values outside the interval ± (t1- α/2; n-2) sres, were considered outliers ( sres = residue standard deviation).
Limit of detection (LD) and limit of quantiication (LQ) were determined after successive dilutions of LSD stock solution (20.0 µg/mL). That concentration able to produce a signal-noise ratio of 3:1 was considered the LD. The concentration that produced a signal-noise of 10:1 and also had adequate precision (CV=8%) was established as LQ.
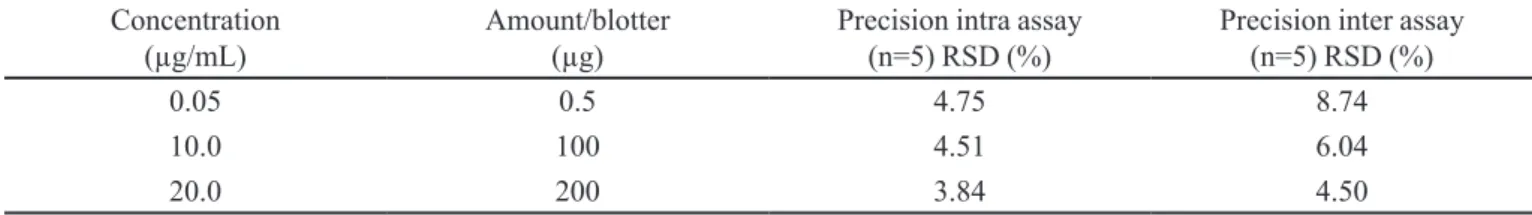
A precision study under repeatability conditions was conducted by injecting standard solutions of LSD diluted in methanol: water (1:1), concentrations of 0.05, 10.0 and 20.0 µg/mL, on the same day and in quintuplicate. An intermediate precision study was conducted using these same LSD concentrations also injected in quintuplicate but on ive different days.
In the present study, it was not possible to evaluate the method accuracy, as there were no certiied reference materials or other reference materials available in the laboratory. Apparent recovery was therefore analyzed as an indirect accuracy parameter. Recovery was evaluated based on blotter papers, previously extracted exhaustively in order to withdraw all impregnated LSD. These blotters, considered “blanks samples”, were extracted according to the item sample preparation. The extracts obtained were fortiied with 1.0 µg and 20.0 µg of LSD in a 10 mL inal volume and then injected into the HPLC. Responses obtai-ned were considered 100%. Other “blank blotter” papers were previously impregnated on their external surfaces with the same LSD quantity and after drying were extrac-ted to study recovery .
In order to study selectivity, samples of some subs-tances present in “street drugs” were extracted to verify if the retention time of these compounds coincided with that of the LSD. The examined substances were benzocaine, lidocaine, cocaine, caffeine, THC and LAMPA. Althou-gh LAMPA is not a substance used in drug abuse, it was employed in the test because many methods described in the literature use it as an internal standard.
RESULTS AND DISCUSSION
Methanol:water (1:1) was selected as the LSD sol-vent extractor according to the study by Veress (Veress, 1993). Blotters are usually impregnated with LSD in salt form (for example, LSD tartrate) so a high polarity solvent is more eficient to extract the drug. The results of the present study were consistent with those found by Veress 1993, as LSD levels from blotters extracted with methanol were signiicantly lower than those obtained using methanol:water (1:1) extraction.
Before examining the assumptions related to the li-near regression, the presence of dispersed values (outliers) was analyzed by the Jacknife standardized residuals test. Only one outlier value was detected. Figure 4 shows a graph of residuals without the outlier value, which was removed earlier.
The presence of heteroscedasticity or the lack of adjustment to the linear model was not evident visually.
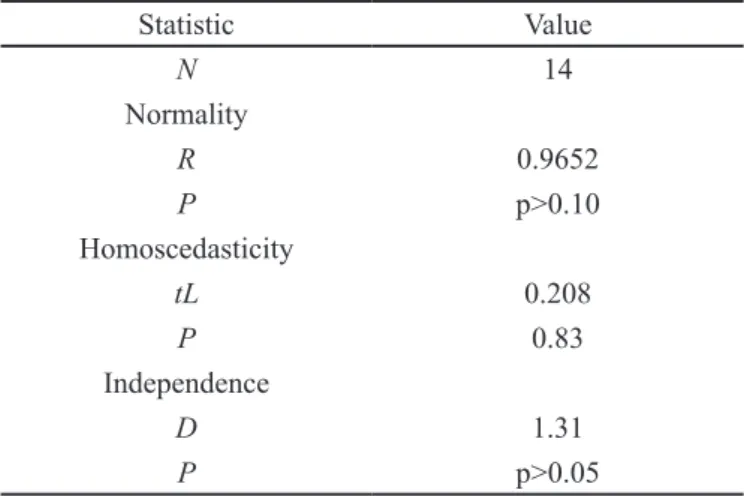
Ryan-Joiner, 1976, Brown- Forsythe, 1974 and Durbin-Watson 1951 tests were applied in order to verify the normality, homoscedasticity and independence of the regression residues, respectively (Table I.)
The linear range obtained in this study after the exclusion of outlier and linear regression assumptions evaluation was from 0.05 to 20.0 µg/mL (0.5 to 200.0 µg of LSD/blotter). Figure shows the LSD linearity curve.
LD and LQ values were 0.01 and 0.05 µg/mL, respec-tively (equivalent to 0.1 and 0.5 µg of LSD/blotter). Both of these presented adequate S/N ratio and LQ also showed satisfactory precision (8%). According to Thompson, 2004, the RSD under reproducibility conditions changes with the compound concentration in the sample, whereby lower concentrations show higher acceptable RSDs.
The precision under repeatability and day to day, attained in the present study are shown in Table II, and
FIGURE 3 - Amount of LSD extracted from ive LSD blotter
papers in each cycle.
FIGURE 4 - Residual plots for outlier treatment by Jacknife
standardized residuals test, demonstrating maximum and minimum allowed intervals. The horizontal lines correspond to ± (t 0.975; n-2) sres.
FIGURE 5 - Linear range of HPLC-UV method for LSD
determination, demonstrating curve equation and determination coeficient.
TABLE I - Statistical parameters for linear regression evaluation
Statistic Value
N 14
Normality
R 0.9652
P p>0.10
Homoscedasticity
tL 0.208
P 0.83
Independence
D 1.31
P p>0.05
n: data number; R: Ryan-Joiner correlation coefficient; tL:
TABLE II - Mean and intra and inter assay relative standard deviation precision at different levels of LSD
Concentration
(µg/mL) Amount/blotter (µg) Precision intra assay (n=5) RSD (%) Precision inter assay (n=5) RSD (%)
0.05 0.5 4.75 8.74
10.0 100 4.51 6.04
20.0 200 3.84 4.50
TABLE III - Mean recovery at two different levels of concentration and respective relative standard deviation
Concentration (µg/mL) Amount/blotter (µg) Mean Recovery RSD (%)
1.0 10 83.84 2.72
20.0 200 84.85 7.49
the results are in agreement with Pocklington, 1990 (11% and 23%).
Percentage recovery found for the two different concentrations studied can be seen in Table III. These data are in accordance with those reported by the European Commission, 2002, that cites acceptable recovery values as lying in the range between 80 to 110% for substances at concentrations higher than 0.01 ppm in the sample.
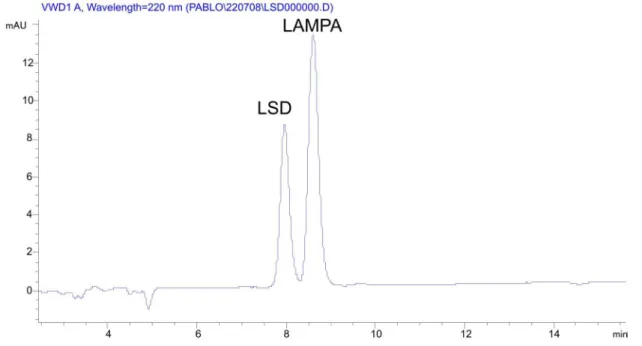
No substance used to verify the method selectivity showed a retention time able to interfere with the LSD chromatographic peak (Figures 6, 7 and 8).
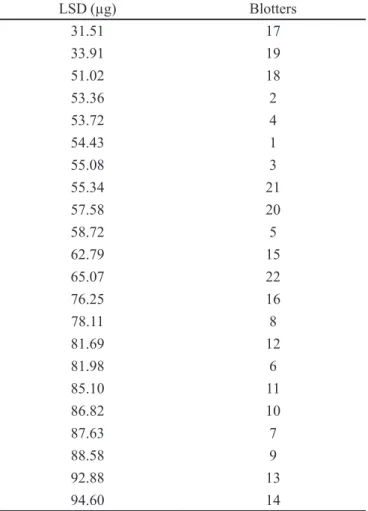
Twenty-two (22) blotter samples were analyzed and quantiied by the method validated. For LSD quantiica-tion, a calibration curve was prepared with three levels of
FIGURE 6 - Chromatogram obtained after injection of standards of caffeine (tr = 1.92 min), benzocaine (tr = 4.33 min), LSD (tr =
7.64 min), cocaine (tr = 12.77 min) and lidocaine (tr = 23.51 min).
concentration, in triplicate, using “blank blotters” as ex-plained in the recovery study described above. The results are shown in Table IV. Figure 9 shows a chromatogram of an analyzed LSD blotter sample.
Other “blank blotter” papers were previously im-pregnated on their external surface with the same LSD quantity and then dried and submitted to the extraction method for recovery calculation.
In order to ascertain the degree of LSD homogeneity of different blotters, samples from the same pack were analyzed and then compared with samples from other seizures. A lower variation was found in the blotter derived from the same pack of LSD (n=5, RSD=3.9%), compared to the variation found in different seizure blotters (n=11, RSD=31.5%). This result was expected since the blotters seized in different places may have come from different sources, thus the LSD solution concentration employed to impregnate the blotters, as well as the impregnation process may vary among the dealers.
FIGURE 7 - Chromatogram obtained after injection of standards of LSD (tr = 7.96 min) and LAMPA (tr = 8.60 min).
FIGURE 8 - Chromatogram obtained after injection of standards of THC (tr = 1.25 min) and LSD (tr = 7.98 min).
CONCLUSION
TABLE IV - LSD in 22 blotters seized by Police of Minas Gerais
state
LSD (µg) Blotters
31.51 17
33.91 19
51.02 18
53.36 2
53.72 4
54.43 1
55.08 3
55.34 21
57.58 20
58.72 5
62.79 15
65.07 22
76.25 16
78.11 8
81.69 12
81.98 6
85.10 11
86.82 10
87.63 7
88.58 9
92.88 13
94.60 14
Mean value: 67.55± 18.61 (CV= 27.5%)
FIGURE 9 - Chromatogram after injection of blotter extract in methanol: water (1:1) tr LSD = 7.86 min.
LSD in illicit samples. Further similar studies carried out in the future with samples seized in other states, will allow a quantitative proile of the drug in these samples to be deined at the national level.
REFERENCES
BRASIL. ANVISA. Resolução da diretoria colegiada - RDC
nº 07, de 26 de fevereiro de 2009. Available at: http://e-legis.anvisa.gov.br/leisref/public/ showAct.php?id=35907. Access on: 20 mar. 2009.
BROWN, M.B.; FORSYTHE, A.B. Robust tests for the equality of variances. J. Am. Stat. Assoc., v.69, n.346, p.364-367, 1974.
BURKE, S. Regression and calibration. LC•GC Europe
Statistics and Data Analysis Online Supplement. p.13-18, 2001. Available at: https://www.webdepot.umontreal. ca/ Usagers/sauves/MonDepotPublic/CHM%203103/ LCGC%20Eur%20Burke%202001%20-%202%20 de%204.pdf. Access on: 03 jun. 2008
CASHMAN, J. LSD. São Paulo: Perspectiva, 1970. 155 p.
CHUNG, A.; HUDSON, J.;MCKAY, G. Validated
ultra-performance liquid chromatography-tandem mass spectrometry method for analyzing LSD, iso-LSD, nor-LSD, and O-H-LSD in blood and urine. J. Anal. Toxicol. v.33, n.5, p.253-259, 2009.
DRAPER, N.; SMITH, H. Applied regression analysis. New York: Wiley, 1998. 706 p.
DURBIN, J.; WATSON, G.S. Testing for serial correlation in least squares regression II. Biometrika, v.38, n.1-2, p.159-178, 1951.
EUROPEAN COMMISSION (EC). Commission decision 2002/657/EC of 12 August 2002. Implementing Council Directive 96/23/EC concerning performance of analytical methods and the interpretation of results. Off. J. Eur. Commun., v.45, n.221, p.8-36,2002.
FAVRETTO, D.; FRISON, G.; MAIETTI S.; FERRARA, S.D. LC-ESI-MS/MS on an ion trap for the determination of LSD, iso -LSD, nor -LSD and 2-oxo-3-hydroxy-LSD in blood, urine and vitreous humor. Int. J. Legal Med., v.121, n.4,p.259-265, 2007.
GERÊNCIA GERAL DE LABORATÓRIOS DE SAÚDE
PÚBLICA-GGLAS. Levantamento de laboratórios
analíticos de Toxicologia Forense. ANVISA – REBLAS. 2004, 256p. Available at: http://www.anvisa.gov.br/reblas/ pesquisa.htm. Access on: 23 apr. 2008.
HORWITZ, W. Protocol for the design, conduct and interpretation of method-performance studies. Pure Appl. Chem., v.67, n.2, p.331-343, 1995.
MOFFAT, A.C.; OSSELTON M.D.; WIDDOP, B. Clarke’s
analysis of drugs and poisons. 3.ed. London: The Pharmaceutical Press, 2004. 2101 p.
NICHOLS, D.E. Hallucinogens. Pharmacol. Ther., v.101, n.2, p.131-181, 2004.
OBSERVATÓRIO BRASILEIRO DE INFORMAÇÕES
SOBRE DROGAS (OBID). Apreensão de drogas.
Available at: http://www.obid.senad.gov.br/portais / OBID/biblioteca/documentos/Dados_Estatisticos/ indicadores/327433.pdf. Accessed on: 14th June 2009.
POCKLINGTON, W.E. Harmonized Protocols for the Adoption of Standardized Analytical Methods and for the Presentation of their Performance Characteristics. Pure Appl. Chem.,
v.62, n.1, p.149-162, 1990.
POSTIGO, C.; ALDA, M.J.L.; VIANA M.; QUEROL, X.; ALASTUEY, A.; ARTINANO, B.; BARCELO, D. Determination of drugs of abuse in airborne particles by pressurized liquid extraction and liquid chromatography-electrospray-tandem mass spectrometry. Anal. Chem., v.81, n.11, p.4382-4388, 2009.
ROCHA, O.G.F. Estudo da intoxicação por estrôncio em pacientes portadores de insuficiência renal crônica, submetidos a tratamento dialítico. Belo Horizonte, 2003. 106 f. [Tese Doutorado em Ciências Farmacêuticas. Faculdade de Farmácia. Universidade Federal de Minas Gerais].
ROYAL SOCIETY OF CHEMISTRY (RSC). Analytical Methods Committee - Technical Brief : Is my calibration linear? RSC, 2005. Available at: http://www.rsc.org/pdf/ amc/brief3.pdf. Accessed on: 20.oct.2009
RYAN, T.A.; JOINER, B.L. Normal probability plots and tests for normality. The State College: Pennsylvania State University, 1976. Available at: <http://www.minitab.com/ uploadedFiles/Shared_Resources/Documents/Articles/ normalprobability_plots.pdf>. Accessed on: 14th jun. 2009.
SOUZA, S.V.C. Procedimento para validação intralaboratorial de métodos de ensaio: delineamento e aplicabilidade em análises de alimento. Belo Horizonte, 2007. 297 f. [Tese de Doutorado em Ciências de Alimentos. Faculdade de Farmácia. Universidade Federal de Minas Gerais].
THOMPSON, M.; ELLISON, S.L.R.;WOOD, R. Harmonized guidelines for single-laboratory validation of methods of analysis. Pure Appl. Chem., v.74, n.5, p.835-855, 2002.
THOMPSON, M. The amazing Horwitz function. AMC Technical Brief, n.17, 2004. Available at: <http://www.rsc. org/images/brief17_tcm18-25961.pdf.> Accessed on: 20. Oct. 2009
UNITED NATIONS. Recommended method for testing lysergide (LSD). Manual for use by National Narcotic Laboratories, Division of Narcotic Drugs. Vienna, 1989. 21p.
VERESS, T. Study of the extraction of LSD from illicit blotters for HPLC determination. J. Forensic Sci., v.38, n.5, p.1105-1110, 1993.
VESSMAN, J.; RALUCA I. S.; VAN STANDEN J. F.; DANZER, K.; LINDNER W.; BUNS, D.T.; FAJGELJ, A.; MÜLLER, H. Selectivity in analytical chemistry. Pure Appl. Chem., v.73, n.8, p.1381-1386, 2001.
Received for publication on 23th July 2009.