Article
J. Braz. Chem. Soc., Vol. 22, No. 7, 1221-1228, 2011. Printed in Brazil - ©2011 Sociedade Brasileira de Química
0103 - 5053 $6.00+0.00
A
*e-mail: [email protected]
Enantioselective Analysis of Fluoxetine and Norluoxetine in Plasma Samples by
Protein Precipitation and Liquid Chromatography with Fluorescence Detection
Jordana S. Bueno, Bruno J.G. Silva and Maria Eugênia C. Queiroz*
Departamento de Química, Faculdade de Filosoia Ciências e Letras de Ribeirão Preto, Universidade de São Paulo, 14040-901 Ribeirão Preto-SP, Brazil
Neste trabalho, o método de precipitação de proteínas e cromatograia líquida de alta eiciência com detecção de luorescência (PP/CLAE-luorescência) foi desenvolvido para a análise enantioseletiva da luoxetina e norluoxetina em amostras de plasmas. Diferentes agentes precipitantes, como solventes orgânicos, ácidos e sais, em diferentes proporções, foram avaliados. Segundo testes calorimétricos de Bradford, dentre todos os agentes precipitantes avaliados, a acetonitrila apresentou maior eiciência, considerando o número de etapas requeridas e a porcentagem de precipitação de proteínas (99,7%), quando adicionado na proporção de 3:1 (agente precipitante: plasma, v/v). O método PP/CLAE-luorescência apresentou limite de quantiicação de 30 ng mL−1 e intervalo linear de 30 a 1000 ng mL−1 com coeicientes de regressão linear acima de
0,9973 para os quatro enantiômeros. Em conclusão, o método PP/CLAE-luorescência padronizado e validado proposto neste estudo foi aplicado com sucesso na análise de amostras de plasma de pacientes em terapia com a luoxetina.
In this study, the enantioselective analysis of luoxetine and norluoxetine in plasma samples was performed by the protein precipitation method and high performance liquid chromatography with luorescence detection (PP/LC-FD). Different precipitating agents - organic solvents, acids, and salts - in several proportions were available. The Bradford colorimetric method employed for evaluation of the eficiency of protein precipitation, has shown that for the sake of simplicity and percentage of protein precipitation (99.7%), acetonitrile was most effective when added at a ratio of 3:1 (acetonitrile/plasma, v/v). The quantiication limit of the PP/LC-FD method was 30 ng mL−1
for the four enantiomers. The response of the proposed method was linear over a dynamic range from LOQ to 1000 ng mL−1, with correlation coeficients higher than 0.9973. In conclusion, the
PP/LC-FD method can be successfully used to analyze plasma samples from ageing patients undergoing therapy with luoxetine.
Keywords: luoxetine and norluoxetine, enantioselective analysis, protein precipitation,
plasma, LC-FD
Introduction
Fluoxetine (FLX) (N-methyl-3-phenyl-3-[(α,α,α
-trifluoro-p-tolyl)oxy]-propylamine) is one of the most widely prescribed selective serotonin reuptake inhibitors for the treatment of depression. Factors affecting the safety and eficacy of the drug have not been fully characterized, although luoxetine have been available for over 20 years. The lack of a suitable test to discriminate between the R and S enantiomers of fluoxetine and its active demethylated metabolite, norluoxetine (NFLX), has hampered assessments of the potential correlation between clinical response and plasma
levels of luoxetine and / or norluoxetine for many years.1
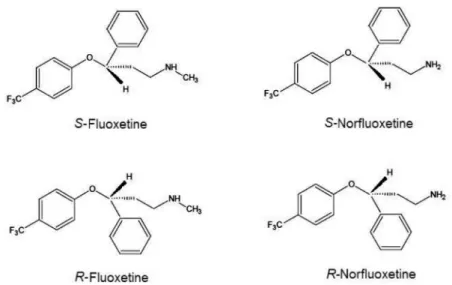
The chemical structures of the enantiomers of luoxetine and norluoxetine are shown in Figure 1.
In fact, while the two FLX enantiomers are approximately equipotent in blocking 5-HT (serotonin) reuptake, the NFLX enantiomers display marked differences in pharmacological activity, with the S-enantiomer being approximately 20 times more potent than the R-enantiomer as a 5-HT-reuptake inhibitor both in vitro and in vivo.2,3 On
For this purpose, several chromatographic methods (both gas chromatography, GC, and liquid chromatography, LC) have been described for the determination of FLX and NFLX enantiomers, including direct (using chiral stationary phases) and indirect (after derivatization in mobile phase) methods.4-8 Moreover, as fast and reliable high
throughput analysis of drug and metabolite concentrations in plasma samples is essential for pharmacokinetic, pharmacodynamic, and toxicokinetic studies, the protein precipitation method (PP) has been an ideal sample preparation technique of complex matrices, such as plasma, serum, and whole blood, for drug analysis.9,11 In
protein precipitation, acids, salts, or water miscible organic solvents are used to remove the protein by denaturation and precipitation. Acids, such as trichloroacetic acid (TCA) and perchloric acid, are very eficient at precipitating proteins. Organic solvents, such as methanol and ethanol, have been widely employed in bioanalysis because of their compatibility with LC mobile phases.12
In order to quantify drug in a plasma sample, it is often necessary to disrupt the protein-drug binding, so that the total amount of drug can be extracted for analysis. Precipitation is useful because it can be utilized to denature the protein, destroying its drug binding ability depending on the binding mechanism.13 Besides being a very simple and fast procedure,
the protein precipitation technique can be employed as a precursor to other methods and also to increase method precision and decrease the consumable costs, as many fully automated methods employing robotic sample processor in the 96-well plate format have been reported.14,15
This study has evaluated several protein precipitants (organic solvents, acids, and salts) in human plasma samples by spectrophotometrically examining their effectiveness at protein removal, for a high throughput sample analysis of
luoxetine, norluoxetine, and their enantiomers by liquid chromatography - luorescence detection (LC-FD).
Experimental
Reagents and analytical standards
Fluoxetine and norfluoxetine analytical standards were donated by Sigma-Aldrich® (São Paulo, Brazil). The
working standard drug solutions, based on therapeutic interval concentrations, were prepared by diluting the stock solutions of these drugs (1mg mL−1) to a proper methanol
volume. These solutions were stable for 18 months at − 20 ºC when stored in methanol. The water used to prepare the mobile phase had been puriied by a Milli-Q system (Millipore®, São Paulo, Brazil).
Methanol, acetone and acetonitrile (HPLC grade), ethanol, hydrochloric acid, acetic acid, phosphoric acid, perchloric acid 70%, trichloroacetic acid, and concentrated sulfuric acid were purchased from J.T. Baker® (Phillipsburg,
USA); potassium hexaluorophosphate 98%, bovine serum albumin (BSA), and sodium perchlorate 98% were obtained from Aldrich® (Steinheim, Germany). Sodium phosphate
dibasic, sodium borate, sodium hydroxide, copper sulfate, ammonium acetate, zinc sulfate, ammonium sulfate, anhydrous sodium sulfate, sodium acetate, and Coomasssie Blue G-250 dye were acquired from Merck® (Darmstadt,
Germany). The saturated aqueous salt solutions were prepared at 25 ºC for the PP technique.
Plasma samples
Plasma from healthy volunteers that had not been subjected to any pharmacological treatment for at least
72 h (blank plasma) was supplied by Hospital das Clínicas de Ribeirão Preto, University of São Paulo, Brazil. The plasma samples were stored at − 20 ºC for up to 6 months. The principles embodied in the Helsinki Declaration were observed, and the study was approved by the Ethics Committee of the University of São Paulo in Ribeirão Preto, Brazil. The plasma sample was collected from elderly patients subjected to therapy with luoxetine for at least 2 weeks. Blood samples were drawn 12 h after the last drug administration.
Instrumentation and chromatographic conditions
The LC-FD analyses were performed in a Shimadzu®
LC-20AT chromatogaph (Kyoto, Japan) equipped with a RF-10AxL detector, and a CBM-20A system controller. The enantiomers were separated in the tris-(3,5-dimethylphenyl carbamate) cellulose column (Chiralcel OD-R, 250 × 4.6 mm, 10 µm - Chiralcel Tech®) at room
temperature (25 ºC) with a mobile phase consisting of potassium hexafluorophosphate 7.5 mmol L-1 and
sodium phosphate 0.25 mol L-1 solution, pH 3.0, and
acetonitrile (75:25, v/v), in the isocratic mode, at a low rate of 1.0 mL min−1. The column efluent was monitored at
Ex/Em 230/290 nm. The pH of the mobile phase, adjusted with chloridric acid 0.1 mol L-1, was measured in the
aqueous component alone, and was iltered and degassed prior to use.
A Thermo Spectronic® spectrophotometer (model
4001/4, USA) was used for the spectrophotometric assays at 595 nm. Other instrumentations included a centrifuge model 206 BL from Fanem® (São Paulo, Brazil) and a
tube shaker model MA138 (Marconi®, São Paulo, Brazil).
Protein precipitation procedure
The following protein precipitant solutions were prepared: aqueous ammonium, sodium, copper and zinc sulfates (saturated at room temperature), aqueous ammonium acetate (saturated at room temperature), aqueous trichloroacetic acid (TCA) (10%, m/v), aqueous perchloric acid 70%, and aqueous sulfuric acid 97%. Acetonitrile, ethanol, acetone, and methanol were also used as solvent for protein precipitation. Each precipitant was added to the plasma samples at volume ratios ranging from 0.5:1 to 4:1 (precipitant/plasma, v/v), in triplicate. Solutions were shaken for 15 min and centrifuged for 25 min at 3500 rpm. The plasma sample volume was ixed at 100 µL, according to previous studies.12 After the
precipitation process, the supernatant was collected and injected into the LC-FD system. In the cases of protein
precipitation using acid solutions, the supernatant pH was adjusted to 7.0 before the injection.
Protein concentration determination
The Bradford reagent was prepared according to the protocol described in the literature.16 Although the
absorbance of Coomassie Blue dye at 595 nm is proportional to the amount of bound protein, it is necessary to establish a correspondence between absorbance values and known amounts of protein. For this purpose, a series of six BSA protein standardswas prepared using sequential dilution of a protein solution of known concentration in water, from 0 to 10.0 µg L−1. A volume of 10 µL of the protein precipitant
was added to 90 µL of each standard solution (0, 2, 4, 6, 8 and 10 µg L−1). Finally, the volume was completed with
1 mL of the Bradford reagent. These solutions were shaken for 10 s, left to stand for 2 min, and the absorbance was read on a spectrophotometer at 595 nm. Once the absorbance for all the standards had been measured, a standard curve was plotted (absorbance versus known protein content of each standard) for each protein precipitant. After registration of the absorbance of the unknown sample, the standard curves were used for determination of the amount of protein corresponding to the measured absorbance values. Plasma protein concentration was found by comparing absorbance values of the analytical curve and that of the plasma sample precipitation and further comparison with that of non-precipitated plasma (total), where precipitation eficiency = [(total plasma protein − protein remaining in the supernatant) / total plasma protein] ×100.
Analytical validation
The analytical validation of the PP/LC-FD method was carried out with blank plasma samples spiked with drugs standard solutions at concentrations that included the therapeutic plasma levels. The linearity was evaluated by calibration curves constructed using linear regression of the drug peak area (Y) versus the drug nominal plasma concentration (X, ng mL−1). These sample
concentrations ranged from the limit of quantiication (LOQ) to 1000 ng mL−1.
Accuracy, recovery, and inter-day precision values were determined by calibration curves, by means of quintuplicate PP/LC-FD assays of the blank plasma samples spiked with analytes at concentrations of 100, 300, 400, 500 and 1000 ng mL−1. Accuracy values were calculated by
the selectivity of the method was also investigated by comparison of retention times among the analytes, other drugs, and endogenous compounds.
Results and Discussion
Optimization of protein precipitation
The Bradford assay is based on the use of a dye, Coomassie Blue G-250, to which protein binds, thus altering the light absorbance properties of the dye. When the dye is prepared as an acidic solution (in 85% phosphoric acid), it maximally absorbs light with a wavelength of 465 nm. Protein addition results in a shift of the dye’s absorption maximum to 595 nm. As the protein concentration increases, the absorbance of light at 595 nm rises linearly, and can be measured in a spectrophotometer.16 The BSA
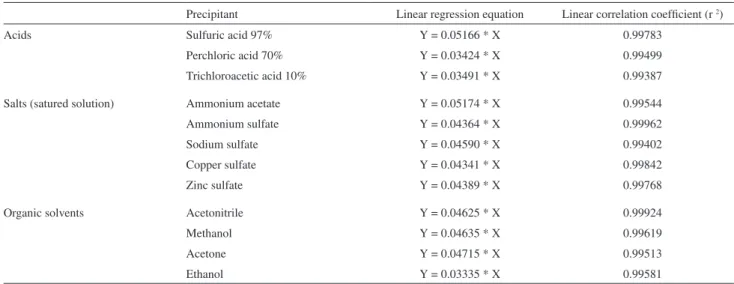
standard curves at 595 nm for the 12 available precipitants were found to be linear, with correlation coeficients higher than 0.9938 (Table 1).
The different protein precipitation techniques lead to different modes of protein precipitation.17 Protein solubility
results from polar interactions with the aqueous solvent, ionic interactions with salts, and repulsive electrostatic forces between charged molecules. At the isoelectric point (pI), there is no net charge on a protein, so similarly the protein has minimum solubility in aqueous solvent. Above the pI, a protein has a net negative charge, while below its pI, it has a net positive charge. Precipitant effectiveness increases with volume to a maximum that is reached at a ratio of approximately 3 or 4 to 1. The selected volume ratios are listed in Table 2.
Results from protein precipitation (percentage of precipitation and remaining protein plasma concentration)
for the twelve precipitants in human plasma are shown in Table 2. Each protein precipitation eficiency value is an average of three replicates. With the exception of ammonium sulfate and sulfuric acid 97%, all precipitants were on average at least 90% effective.
Precipitants exert speciic effects on proteins in order to facilitate their precipitation from solution. Organic solvent precipitants lower the dielectric constant of the plasma protein solution, which increases the attraction between charged molecules and facilitates electrostatic protein interactions. The organic solvent also displaces the ordered water molecules around the hydrophobic regions on the protein surface. Hydrophobic interactions between proteins are minimized as a result of the surrounding organic solvent, while electrostatic interactions become predominant and lead to protein aggregation. Organic solvents are the most widely employed protein precipitants in drug analysis, especially acetonitrile.9,15 In this work,
acetonitrile was also found to be the best organic plasma protein precipitant, particularly at a 3:1 (precipitant/plasma) volume ratio. After precipitation with acetonitrile, and other organic solvents, the supernatant was easily dried, providing increased analytes concentration just before injection into the LC-FD system.
Acidic reagents form insoluble salts with the positively charged amino groups of the protein molecules at pHs below their pI. Proteins are precipitated from solutions with high salt concentrations as the salt ions become hydrated and the number of available water molecules decrease, drawing the water away from the protein hydrophobic surface regions. This results in aggregation of protein molecules via protein-protein hydrophobic interactions.17,18
This study has also shown that protein precipitation using strong acids (perchloric acid 70% and trichloroacetic acid)
Table 1. Equations and linear coeficients of the calibration curves
Precipitant Linear regression equation Linear correlation coeficient (r 2)
Acids Sulfuric acid 97% Y = 0.05166 * X 0.99783
Perchloric acid 70% Y = 0.03424 * X 0.99499
Trichloroacetic acid 10% Y = 0.03491 * X 0.99387
Salts (satured solution) Ammonium acetate Y = 0.05174 * X 0.99544
Ammonium sulfate Y = 0.04364 * X 0.99962
Sodium sulfate Y = 0.04590 * X 0.99402
Copper sulfate Y = 0.04341 * X 0.99842
Zinc sulfate Y = 0.04389 * X 0.99768
Organic solvents Acetonitrile Y = 0.04625 * X 0.99924
Methanol Y = 0.04635 * X 0.99619
Acetone Y = 0.04715 * X 0.99513
is effective at high volume ratios (4:1, Table 2), though there is need for an additional step in the process: dilution with basic solutions for control of pH after protein precipitation and before injection into the LC-FD system. Although salt solutions provided eficient protein precipitation by the salting-out effect, the high water volume added to the plasma sample decreased the analytes concentration in the free protein sample.
This study is in general agreement with previously reported data using the Lowry method for assessment of protein precipitation effectiveness.12 Among the tested
precipitants, acetonitrile and trichloroacetic acid provided the most eficient precipitation compared to precipitants with similar mechanisms. Thus, because of the high protein precipitation eficiency and simplicity, acetonitrile was selected as precipitant at a volume ratio 3:1 (acetonitrile/ plasma) for analytical validation.
Chromatographic conditions
Due to the high solubility of FLX and its metabolite NFLX in water, separation was carried out by reversed phase chromatography. For the mobile phase, a mixture of two different salt solutions (potassium hexaluorophosphate and sodium phosphate) was necessary, to increase resolution while at the same time decreasing peak width, whereas acetonitrile provided shorter analysis time. The most suitable percentage of acetonitrile for a good separation in a reasonable analysis time was 25%.
The acid-base properties of FLX and NFLX mean that the pH of the mobile phase could influence the chromatographic separation. The studied pH range was 3 to 7, and no signiicant differences were observed with
regard to the chromatographic resolution. However, as the maximum excitation and emission may vary with pH, the inluence of this variable on the intensity of the signal was studied. A progressive reduction could be observed from pH 3, so this was the value selected as optimum for the study.
The identiication of R and S enantiomers of luoxetine and norluoxetine was performed according to literature results, considering the elution order of these drugs in the same chiral column and detection system.1 The mobile
phase consisted of potassium hexafluorophosphate 7.5 mmol L-1 and sodium phosphate 0.25 mol L-1 solution,
pH 3, acetonitrile (75:25, v/v), at a low rate of 1.0 mL min−1
in the isocratic mode. Under this set conditions, the LC-FD analysis in the selected mobile phase furnished appropriate resolution and satisfactory analysis time (23 min). In passing through the stationary phase, Chiralcel OD-R, the drug can interact with groups C=O and NH groups through hydrogen bonds, in addition to the dipole-dipole interactions with the groups C=O,19 which affords good
resolution ability.
Analytical validation
The validation of PP/LC-FD method was conducted to minimize errors, ensure the highest quality of analytical work and, consequently, to obtain reliable laboratory results. The speciicity (selectivity) of the method is demonstrated by the following chromatograms: referenceplasma blank (Figure 2a) and reference plasma sample spiked with the enantiomers at a concentration of 500 ng mL−1 (Figure 2b).
No interfering peaks were found in chromatograms obtained after extraction of different sets of blank plasma
Precipitant Proportion
(precipitant: plasma, v/v)
Mean absorbance /
AU
Corresponding concentration /
(g L−1)
Eficiency of protein precipitation /
(%)
Acids Sulfuric acid 97% 1 drop 0.413 7.995 85.7
Perchloric acid 70% 4:1 0.011 0.032 99.9
Trichloroacetic acid 10% 4:1 0.014 0.040 99.9
Salts (satured solution) Ammonium acetate 3:1 0.113 4.368 92.2
Ammonium sulfate 2:1 0.182 8.340 85.1
Sodium sulfate 3:1 0.097 4.226 92.5
Copper sulfate 3:1 0.093 4.284 92.4
Zinc sulfate 4:1 0.084 3.828 93.2
Organic solvents Acetonitrile 3:1 0.071 0.154 99.7
Methanol 4:1 0.336 0.725 98.7
Acetone 2:1 0.171 0.363 99.4
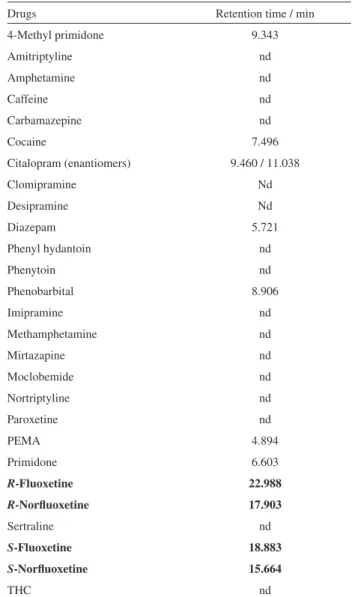
samples (n = 5) from drug-free healthy volunteers. This gives evidence of the ability of the method to unequivocally measure the drugs in the presence of endogenous plasma components. Because fluoxetine can be prescribed in combination with different psychotropic agents and/or other drugs, it is important to evaluate their co-elutions with the studied enantiomers. According to Table 3, these drugs did not co-elute with the enantiomers under study.
Fluoxetine and norluoxetine provided a satisfactory response in the luorescence detector. Under our LC-FD conditions, the limit of detection (LOD – S/N = 3) was 5 ng mL−1. This determination was performed with
standard drugs solutions. The limit of quantification (LOQ – S/N = 10) of the enantiomers in plasma was 30 ng mL−1, with RSD (relative standard deviation) lower
than 15%, for the four analytes studied here (Table 4). The linearity of the method PP / LC-FD was determined in plasma samples spiked with reference antidepressants in plasma related to the LQ, 300, 400, 500, and 1000 ng mL−1.
This range was linear, with linear regression coeficients above 0.9973, and the coeficients of variation for all calibration points were lower than 14% (Table 5).
Figure 2. PP/LC-FD chromatograms. A) Blank plasma sample, B) Blank plasma sample spiked with FLX and NFLX, resulting in 500 ng mL−1.
1: S-Norluoxetine, 2: R-Norluoxetine, 3: S-Fluoxetine, 4: R-Fluoxetine.
Table 3. Retention time of the drugs studied as possible interferent
Drugs Retention time / min
4-Methyl primidone 9.343
Amitriptyline nd
Amphetamine nd
Caffeine nd
Carbamazepine nd
Cocaine 7.496
Citalopram (enantiomers) 9.460 / 11.038
Clomipramine Nd
Desipramine Nd
Diazepam 5.721
Phenyl hydantoin nd
Phenytoin nd
Phenobarbital 8.906
Imipramine nd
Methamphetamine nd
Mirtazapine nd
Moclobemide nd
Nortriptyline nd
Paroxetine nd
PEMA 4.894
Primidone 6.603
R-Fluoxetine 22.988
R-Norluoxetine 17.903
Sertraline nd
S-Fluoxetine 18.883
S-Norluoxetine 15.664
THC nd
*nd = not detected until 30 min of running. The drugs marked in bold are the target analytes.
Table 4. Linearity and coeficient of variation (CV) for the LOQ
Drug Linear regression r² CV / (%), n = 5 (LOQ = 30 ng mL−1)
S-NFLX y = −27564.22 + 1083.77 x 0.9993 13.6
R-NFLX y = −32043.92 + 1048.36 x 0.9978 12.5
S-FLX y = −88237.23 + 1491.19 x 0.9973 9.8
R-FLX y = − 2219.33 + 1484.45 x 0.9976 14.1
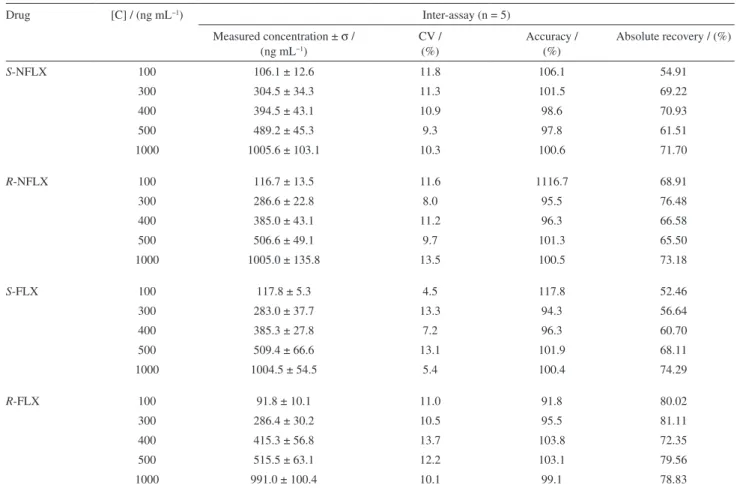
The method presented adequate accuracy, with values ranging between 91.8% and 117.8%. The inter-assay precision (n = 5) of the standardized method was determined using plasma samples enriched with the enantiomer concentrations of 100, 300, 400, 500 and 1000 ng mL−1.The coeficients of variation at the ive
studied enantiomers (Table 5). These results demonstrate that the developed method allows for the quantiication of antidepressants in the therapeutic interval, although no therapeutic levels have been clearly deined for selective serotonin reuptake inhibitors.20
The stability of standard solutions of FLX and NFLX, as well as plasma samples, had been conirmed in previous studies.21,22 According to Kovacevic et al.,21 no signiicant
loss is observed for analysis of plasma samples stored in methanol for 18 months at −20 ºC or after a freeze/thaw 9-month cycle after they were analyzed for the irst time. These results are proof of the stability of the plasma samples and standard solutions in conditions proposed in this work.
To evaluate the applicability of the standardized and validated method, plasma samples from elderly patients subjected to therapy with luoxetine (Prozac®, 20 mg per day) were analyzed (Figure 3). The detected concentrations were 570 ng mL−1 for S-NFLX, 434 ng mL−1 for R-NFLX,
759 ng mL−1 for S-FLX, and 58 ng mL−1 for R-FLX.
The PP/LC-FD method developed here give values of accuracy and linearity close to those achieved with sample preparation methods previously described in the literature, such as liquid-liquid extraction (LLE/LC-UV),1
solid phase extraction (SPE/LC -FD),4 and LLE/GC-NPSD
(nitrogen-phosphorus selective detector),23 for analysis of
these enantiomers in biological matrices.
Conclusions
The protein precipitation technique has been shown to be a simple and rapid preparation route of plasma samples for enantioselective analysis of the antidepressant
Drug [C] / (ng mL−1) Inter-assay (n = 5)
Measured concentration ± σ /
(ng mL−1)
CV / (%)
Accuracy / (%)
Absolute recovery / (%)
S-NFLX 100 106.1 ± 12.6 11.8 106.1 54.91
300 304.5 ± 34.3 11.3 101.5 69.22
400 394.5 ± 43.1 10.9 98.6 70.93
500 489.2 ± 45.3 9.3 97.8 61.51
1000 1005.6 ± 103.1 10.3 100.6 71.70
R-NFLX 100 116.7 ± 13.5 11.6 1116.7 68.91
300 286.6 ± 22.8 8.0 95.5 76.48
400 385.0 ± 43.1 11.2 96.3 66.58
500 506.6 ± 49.1 9.7 101.3 65.50
1000 1005.0 ± 135.8 13.5 100.5 73.18
S-FLX 100 117.8 ± 5.3 4.5 117.8 52.46
300 283.0 ± 37.7 13.3 94.3 56.64
400 385.3 ± 27.8 7.2 96.3 60.70
500 509.4 ± 66.6 13.1 101.9 68.11
1000 1004.5 ± 54.5 5.4 100.4 74.29
R-FLX 100 91.8 ± 10.1 11.0 91.8 80.02
300 286.4 ± 30.2 10.5 95.5 81.11
400 415.3 ± 56.8 13.7 103.8 72.35
500 515.5 ± 63.1 12.2 103.1 79.56
1000 991.0 ± 100.4 10.1 99.1 78.83
Figure 3. Chromatogram obtained after protein precipitation from plasma samples collected from elderly patient in therapy with luoxetine in the selected mobile phase. The concentrations found in the patient sample were 570 ng mL−1 for S-NFLX, 434 ng mL−1 for R-NFLX, 759 ng mL−1
luoxetine and its metabolite, norluoxetine, by means of LC-FD. Among all the evaluated precipitants, acetonitrile was the most eficient, considering the necessary number of steps and the percentage of protein precipitation (99.7%) when it was added at a 3:1 ratio (precipitating agent/ plasma, v/v).
According to the analytical validation parameters, the PP/LC-FD method is suitable for analysis of antidepressants in plasma samples, with good repeatability, inter assay precision, limit of quantiication, linearity, and selectivity. The analysis time (25 min) was satisfactory for quantitative analysis.
To evaluate the applicability of the standardized and validated method, plasma samples from patients in therapy with antidepressants has been reviewed and proven the relevance of the technique for the enantioselective analysis of luoxetine and norluoxetine in plasma samples from patients with analyte concentrations between 100 and 1000 ng mL−1.
Acknowledgments
The authors are grateful to Prof. Dr. Arthur Henrique Cavalcante de Oliveira (Departamento de Química-USP/ Ribeirão Preto-SP, Brazil) for his contribution in the spectrophotometric assays and to CNPq (Conselho Nacional de Desenvolvimento Cientíico e Tecnológico) for inancial support.
References
1. Gatti, G.; Bonomi, I.; Marchiselli, R.; Fattore, C.; Spina, E.; Scordo, G.; Paciici, R.; Perucca, E.; J. Chromatogr., B 2003, 784, 375.
2. Fuller, R. W.; Snoddy, H. D.; Krushinsky, J. H.; Robertson, D. W.; Neuropharmacology 1992, 31, 997.
3. Wong, D. T.; Fuller, R. W.; Robertson, D. W.; Acta Pharm. Nord. 1990, 2, 171.
4. Unceta, N.; Barrondo, S.; de Azúa, I. R.; Gómez-Caballero, A.; Goicolea, M. A.; Sallés, J.; Barrio, R. J.; J. Chromatogr., B 2007, 852, 519.
5. Eap, C. B.; Gaillard, N.; Powell, K.; Baumann, P.; J. Chromatogr., B 1996, 682, 265.
6. Yu, L.; Mei-Li, F.; Jie-Guo, X.; Arch. Pharm. Chem. Life Sci. 2006, 339, 461.
7. Jie, Z.; Yi-Wen, Y.; Feng, W.; Ping-Dong, W.; J. Zhejiang Univ. Sci. 2007, 8, 56.
8. Silva, B. J. G.; Lanças, F. M.; Queiroz, M. E. C.; J. Chromatogr., A 2009, 1216, 8590.
9. Macek, J.; Klíma, J.; Ptácek, P.; J. Chromatogr., B 2007, 852, 282.
10. Samanidou, V. F.; Nika, M. K.; Papadoyannis, I. N.; J. Sep. Sci. 2007, 30, 2391.
11. Shin, J.; Pauly, D. F.; Johnson, J. A.; Frye, R. F.; J. Chromatogr., B 2008, 871, 130.
12. Blanchard, J.; J. Chromatogr. 1981, 226, 455.
13. Chamberlain, J. B.; The Analysis of Drugs in Biological Fluids, 2nd ed., CRC Press: Boca Raton, FL, 1995, p. 38.
14. Biddlecombe, R. A.; Pleasance, S.; J. Chromatogr., B1999, 734, 257.
15. Ma, J.; Shi, J.; Le, H.; Cho, R.; Huang, J. C.; Miao, S.; Wong, B. K.; J. Chromatogr., B 2008, 862, 219.
16. Bradford, M. M.; Anal. Biochem. 1976, 72, 248.
17. Polson, C.; Sarkar, P.; Incledon, B.; Raguvaran, V.; Grant, R.; J. Chromatogr., B 2003, 785, 263.
18. Scopes, R. K.; Protein Puriication: Principles and Practice, 3rd ed., Springer: New York, 1994, 3.
19. Yashima, E., Okamoto, Y.; Bull. Chem. Soc. Jpn.1995, 68, 3289.
20. Titier, K.; Castaing, N.; Scotto-Gomez, E.; Pehourcq, F.; Moore, N.; Molimard, M.; Ther. Drug Monit. 2003, 25, 581.
21. Kovacevic, I.,Pokrajac, M., Miljkovic, B., Jovanovic, D., Prostran, M.; J. Chromatogr., B 2006, 830, 372.
22. Addison, R. S., Franklin, M. E., Hooper, W. D.; J. Chromatogr., B 1998, 716, 153.
23. Ulrich, S.; J. Chromatogr., B 2003, 783, 481.
Submitted: December 1, 2010
Published online: February 24, 2011