Spectral indexes for identification of nitrogen deficiency in maize
1Índices espectrais para identificação de deficiência de nitrogênio em plantas de milho
Liliane Maria Romualdo2*, Pedro Henrique de Cerqueira Luz2, Murilo Mesquita Baesso2, Fernanda de Fatima da Silva Devechio3 and Jessica Angela Bet2
ABSTRACT - Image analysis can provide information extracted from the leaves of crops, and contribute to early identification of nutrient deficiency. The objective of this study was to recognize nutritional nitrogen (N) patterns in maize plants, at the V4 and V7 stages, using digital image analysis based on spectral indexes. The experiment was carried out in a greenhouse under hydroponic cultivation. Treatments consisted of a completely randomized design, in a 4 × 2 factorial arrangement, with four replications. The factors were constituted by the doses of N (0; 3.0; 6.0 e 15 mmol L-1) combined at V4 and V7. In each stage,
digital images were taken of leaf blades, with subsequent chemical composition and image analysis. For image recognition and classification, a vector of characteristics based on the spectral indexes was used as follows: excess of green, normalized red, normalized green and red-green ratio, and the combination among them. Additionally, extracted blocks of 9 × 9, 20 × 20 and 40 × 40 pixels on original images were used. The N content in the leaf blade, the dry mass of the plants and the external critical level of N in the nutrient solution were determined for result validation, based on 90% dry matter production. Maximum the global accuracy rate for N patterns was 80 and 93% at V4 and V7, respectively. The use of combined spectral indexes provided better classification performance, and the 9 × 9 pixel image block appeared more adequate for differentiation among the doses of N.
Key words:Zea mays L.. Image analysis. Mineral nutrition. Image processing.
RESUMO - A análise de imagens pode fornecer informações extraídas das folhas das culturas, que podem contribuir na identificação precoce de deficiência de nutrientes. O objetivo do trabalho foi reconhecer padrões nutricionais de nitrogênio (N) em plantas de milho, nos estádios V4 e V7, utilizando análise de imagens digitais baseados em índices espectrais. O experimento foi realizado em casa de vegetação sob cultivo hidropônico. Os tratamentos foram dispostos em um delineamento inteiramente casualizado, em esquema fatorial 4×2, com quatro repetições. Os fatores foram constituídos pelas doses de N (0; 3,0; 6,0 e 15 mmol L-1) combinados no V4 e V7. Em cada estádio foram digitalizadas imagens da lâmina foliar, que
foram processadas pela análise de imagens e analisadas quimicamente. Para reconhecimento das imagens foi utilizado um vetor de características baseados nos índices espectrais: excesso de verde, vermelho normalizado, verde normalizado e razão verde-vermelho, e na combinação entre eles. Na imagem original foram extraídos blocos de 9×9; 20×20 e 40×40 pixels. Para validação dos resultados foi determinado o teor de N na lâmina foliar, a massa seca das plantas e o nível crítico externo de N na solução nutritiva, com base em 90% produção de massa seca. A máxima porcentagem de acerto global dos padrões de N foi 80 e 93% em V4 e V7, respectivamente. A utilização de índices espectrais combinados proporcionou melhor desempenho na classificação, e o bloco de imagem 20×20 pixels mostrou-se mais adequado para a diferenciação entre as doses de N.
Palavras-chave:Zea mays L.. Análise de imagem. Nutrição mineral. Processamento de imagens.
DOI: 10.5935/1806-6690.20180021 *Author for correspondence
Received for publication on 12/08/2016, approved 25/05/2017
1Parte da Tese do primeiro autor apoiada pela FAPESP - Fundação de Pesquisa do Estado de São Paulo (Grants 2009 / 51835-0 e 2010 / 18233-3) 2Departamento Faculdade de Zootecnia e Engenharia de Alimentos, Universidade de São Paulo, FZEA/USP, Zona Rural, Pirassununga-SP,
Brasil, [email protected], [email protected], [email protected], [email protected]
INTRODUCTION
Maize is one of the most nutrient-demanding crops, with abundant nitrogen (N) a requirement for growth. According to Von Pinho et al. (2009), maize plants accumulate 22% of the total N at the V3 stage, reach 60% at V6, and extract and estimated 374.6 kg ha-1at V10. Thus,
determining what period the crops most require nutrients allows correcting deficiencies that may occur during development, as well as correctly estimating the amount of necessary fertilizer, and stablishing management practices, in order to maximize utilization. The need for efficiency in nutrient usage and improvement of methods to identify the plant nutritional state has led Agronomy, Economy, Environment and Operational Systems to search for new technologies (ROMUALDOet al., 2014).
Precision agriculture has used new technologies as a tool to assist in nutritional diagnoses and high productivity plant management. As an example, the use of optical sensors to capture the reflectance at certain wavelengths throughout the plant canopy, for applying N at a variable rate (AMARAL; MOLIN, 2011). Additionally, systems of computational vision through image analysis (CAMARGO; SMITH, 2009; PEDROSO et al., 2010), and the most recent studies using unmanned aerial vehicles for image acquisition (HOLLAND; SCHEPERS, 2010, 2012; SHIRATSUCHIet al., 2011) have been developed. Mathematical combinations of different spectral bands within their electromagnetic spectrum (ATZBERGER, 2013) can better evaluate the reflectance characteristic usage in agriculture. These combinations are measures for a particular purpose, within the bands of the visible and near infrared (SHIRATSUCHIet al., 2011).
Image analysis uses methods to interpret and/or verify an image automatically or semi-automatically (BACKES; CASANOVA; BRUNO, 2009). Image analysis is a promising tool for the early diagnosis of nutritional maize status, detecting levels of latent nutritional deficiencies that can allow for the improvement of nutrient management in the crop cycle. This technology has the potential to recommend nitrogen topdressing in maize submitted to different management systems (DELLINGER; SCHIMDT; BEEGLE, 2008), and for maize nutritional diagnosis in the greenhouse or in the field (ROMUALDOet al., 2014; SILVAet al., 2014). Moreover, it may be used for size processing, width, and length analysis of corn seeds (TEIXEIRAet al., 2007).
Thus, the objective of this research was to recognize patterns for nitrogen nutritional deficiencies in maize plants, at the V4 and V7 developmental stages, using digital image analysis of leaf blades based on visible spectral indexes.
MATERIAL AND METHODS
This study consisted of an image bank obtained from an experiment with the DKB 390® maize hybrid cultivated in a hydroponic system, and conducted in the agricultural science sector of the Department of Animal Science of the Faculty of Animal Science and Food Engineering - FZEA / USP, in Brazil.
A completely randomized experimental design was created, in a 4 × 2 factorial arrangement, with four replicates and factors composed of four doses of N concentration. For T1 = complete omission, T2 = 3.0 mmol L-1 (dose at 20%
– 42 mg L-1); T3 = 6.0 mmol L-1 (dose at 40% – 84 mg
L-1); T4 = 15.0 mmol L-1 (dose at 100% – 210 mg L-1),
evaluated in two phenological stages, V4 and V7 [24 and 44 days after emergence (DAE) respectively], totaling 32 experimental units.
Studies on nutrient solutions and on macronutrients followed Hoagland and Arnon (1950, respectively, and for micronutrients, Furlani et al. (1999), modified for preliminary tests. The nutrient solution had the following concentrations in L-1: N = 210 (complete dose); P = 31;
K = 234; Ca = 200; Mg = 48; S = 64; B = 0.6; Cu = 0.05; Fe = 6.9; Mn = 0.8; Mo = 0.032 and Zn = 0.17. Nutrients were provided according to reagent sources P.A: amonium nitrate (NH4NO3); potassium dihydrogen phosphate (KH2PO4); potassium chloride (KCl); calcium chloride dehydrate (CaCl2.2H2O); magnesium sulfate heptahydrate (MgSO4.7H2O); boric acid (H3BO3); copper chloride (CuCl2); ethylenediamine di-2-hydroxyphenyl acetate ferric (Fe-EDDHA 6% - Fe); manganese chlorid tetrahydrate (MnCl2.4H2O); molybdic acid monohydrate (H2MoO4.H2O) and zinc chlorid (ZnCl2). The nutrient solution was prepared with deionized water, and the reagents were previously prepared in individual stock solutions, and pipetted into the concentrations.
Each experimental unit received filtered and bubbled compressed air for 10 seconds every 30 seconds, had nutrient solutions renewed weekly, had deionized water added when necessary, and had pH monitored daily and corrected occasionally with the use of 1N HCl (hydrochloric acid) and / or 1N NaOH (sodium hydroxide) to between 5.0 and 6.0 during the experimental period.
After sowing plants in washed sand, and irrigating the seedlings with deionized water, they were maintained under these conditions for 14 days after emergence (VE). Two plants composed each experiment, in 3.5 L of nutrient solution and were previously selected by uniformity and transplanted into the experimental units.
leaf blades of each phenological stage were extracted from the fourth fully expanded leaf at V4, and the seventh fully expanded leaf at V7. The leaves were cleaned and then scanned according to the procedures described by Romualdoet al. (2014). The zero N level inhibited plant development; therefore, the third fully expanded leaf was used as indicative leaf.
The leaf blades were digitized at 1,200 DPI, in a high-resolution scanner (model HP G2710), identified according to nitrogen doses, and stored in tiff format (without compression), for further processing, in which, image characteristics were extracted constricting the information. A vector of characteristics represented the desired information instead of the original image. As a hypothesis for the study, characteristics related to the visible spectral indexes extracted from the images were regarded as information desired to classify the dose of N deficiency in the plant.
Equations 1 to 4 calculate these characteristics (BAESSOet al., 2007):
(1)
(2)
(3)
(4)
where, Eg = excess of green; Rg = rate of pixels in the green band; Rb = rate of pixels in the blue band; Rr = rate of pixels in the red band; Nr = normalized red; Ng = normalized green and Rgr = green-red ratio. The characteristics were calculated in blocks of the original image that represented the leaf reflectance. A computer program developed and implemented in MATLAB®R2013a cut images into blocks of 9×9, 20×20 and 40×40 pixels (BAESSOet al., 2007). Each dimension consisted of 10 blocks cut from the previously selected region (two at each cardinal point and two at the center of the leaf excluding the edges and the central vein). The total of 320 blocks for each studied developmental stage (4 doses of N x 2 sampled leaf blades from each dose for scanning x 4 replicates x 10 blocks) were separated into classes corresponding to doses of N. The characteristic vector was the input variable of a classifier to discriminate the doses of N. Each color index was individually assessed, and the indexes were also combined, resulting in 15 possible index combinations as shown in Table 1. The last step of the analysis was the development of an algorithm for the elaboration and evaluation of the statistical classifier. Gonzales and Woods (2008) described the statistical classifier evaluated for the statistical classification and evaluation of the best feature vector among the four classes corresponding to the nitrogen doses in the plant, which is composed of a set of discriminating functions (Equation 5): (5)
where,
dj= discriminating function of class j;
C
j= covariance matrix of class j;
det Cj= determinant of the covariance matrix of class j;
X = characteristic vector;
Table 1 - Characteristic vectors (X) evaluated in the development of the classifiers to discriminate the doses of N in the leaf blade of maize plants
Eg = excess of green; Nr = normalized red; Ng = normalized green; Rgr = green-red ratio
One index Two indexes Three indexes Four indexes
X = Eg X = Eg and Nr X = Eg, Nr, Ng X = Eg, Nr, Ng, Rgr
X = Nr X = Eg and Ng X = Eg, Nr, Rgr
X = Ng X = Eg and Rgr X = Eg, Ng, Rgr
X = Rgr X = Nr and Ng X = Nr, Ng, Rgr
m
j = rate vector of class j;
n = characteristic vector size;
P (W
j) = a priori probability of class j; and
T = symbol representing the transpose of a matrix.
This work considered the occurrence of four doses of nitrogen. According to equation 6,
(6)
Four discriminating functions were developed, one for each class, so that an unknown vector X was assigned to class j, which presented the highest value for the discriminating function dj(X). The classification error was estimated by cross-validation leaving one out (CONGALTON; GREEN, 2009), thus an observation was separated and the discriminating functions were elaborated with the remaining data (39 samples), and then, the separate observation was classified. This procedure was repeated and evaluated successively for each sampled block size, for all of the 40 observations (4 treatments with 10 replicates). In addition, an error matrix was elaborated to estimate classification errors, as described in Congalton and Green (2009).
The generated error matrix enabled the classification of omission errors (EO) corresponding to the images not classified in the belonging class, and the inclusion errors, which included images to a not-belonging class (BAESSOet al., 2007).
The classifier performance measurement was determined by the global accuracy rate in classification and by the Kappa coefficient.
Equation 7 - global accuracy rate (GAR) of the classifier:
(7)
where,
GAR = global accuracy rate;
CC = number of correctly classified samples; and
Nt = total number of samples.
According to Everitt and Dunn (2001), the Kappa coefficient (K) is used in this study to measure the confidence of classification. The values generated by the Kappa range up to 1.0 and the image classification was evaluated as follows: 0 - 0.20 = not trust; 0.21 - 0.40 = low; 0.41 - 0.60 = moderate; 0.61 - 0.80 = trust and 0.81 - 1.0 = worthy trust.
Equation 8 - estimate K:
(8)
where,
= Estimation of Kappa coefficient; X
ii= Value in line i and column i (diagonal) of the error
matrix;
Xi0= Total of line i (inclusion error);
X
0i= Total of column i (error of omission); and
nt= Total number of doses.
The Z test at 5% tested the difference between both classifiers (CONGALTON; GREEN, 2009) in order to define the best spectral indexes of the classification.
Equation 9 - calculated Z value:
(9)
where,
Z = Calculated Z value;
1= Kappa coefficient 1;
2= Kappa coefficient 2;
Var (
1) = Kappa coefficient variance 1; and
Var(
2) = Kappa coefficient variance 2.
Equations 10, 11, 12, 13 and 14 (HUDSAM; RAMM, 1987) determined the Kappa coefficient variance.
(10)
where,
determination of the critical level of N in the nutrient solution and leaf. Regression studies were carried out for significance of the results, and the correlation of the nitrogen content with the dry mass production was established using SAS 9.2 software (SAS INSTITUTE, 2012).
RESULTS AND DISCUSSION
Nitrogen contents (N) in the plant tissue of indicative leaf blades at V4 and V7 increased significantly (p<0.01) with incremental doses of N in the nutrient solution (Figure 1a). Dry mass production had a positive and significant correlation with the contents (Figure 1b). The inadequate nitrogen supply significantly compromised maize development (Figures 1 and 2), hence the plant biomass production value. The N characteristic deficiencies in the plant were observed in the blades of the old leaves with chlorosis that evolved to dry, and necrosis of the vegetal tissue progressing along the main vein. Ferreira (2012) and Gondim et al. (2010) found similar results.
The N sufficiency range was established at the developmental stages based on the equations described in Figure 2, ranging from 7.6 to 15.0 mmol L-1 at V4
and from 9.4 mmol L-1to 16.7 mmol L-1at V7. Over the
maximum stablished values (Figure 2), the probability of response to the addition of nitrogen in the solution is very low in sufficient ranges. The minimum concentration required to reach 90% of maximum yield was higher at V7 (9.4 mmol L-1). Therefore, small decreases in N
concentration may compromise the dry mass production
of the plant. The leaf contents of N, to reach 90% of the dry mass for the internal critical level at V4, were 37.2 g kg-1 and 50.6 g kg-1. Plants with fast early growth,
such as maize, require nitrogen in a short period, and if the requirements are not supplied, there is damage in the initial growth, with effects on grain production (ALMEIDAet al., 2013).
The obtained results allow us to infer there was a significant variation among the foliar contents of the treatments according to the applied N rates and to recognize a lack of nitrogen by image analysis based on spectral indexes.
Tables 2 and 3 present the global accuracy rate (GAR) and Kappa coefficient of developed classifiers for indicative images of maize leaf, at the studied developmental stages, considering the three dimensions of image blocks (9 × 9, 20 × 20 and 40 × 40 pixels).
The results from the combined spectral indexes showed significant differences compared to individual analysis. When combined, they presented a better determination of N doses, with a global accuracy probability over 65% (Table 1) and 80% (Table 2) at the V4 and V7 stages, respectively.
Independent of block size, the combinations of normalized red (Nr), normalized green (Ng) and green and red ratio (Rgr) among the indexes presented higher GAR (80, 78 and 68%, respectively) and the Kappa indexes were trust and moderate (0.73, 0.70 and 0.57, respectively). Whereas for the V7 stage (Table 3), despite not reaching the highest GAR (93, 85 and 83%, respectively), the Kappa indexes worthy trust and trust
Figure 1 - N content in the indicative leaf (a) and correlation of N contents with dry mass (b), as a function of N concentration in the
(0.90, 0.80, 0.77, respectively), showing no significant difference in relation to the indexes with higher GARs. Abrahãoet al.(2013) and Baessoet al. (2007) observed that the combinations among the spectral indexes
promoted a better determination of N foliar contents and chlorophyll in the common bean, by bands and spectral vegetation indexes. Romualdo et al. (2014) studied through image analysis the different extraction methods for the recognition of nitrogen deficiency in leaves of maize at the V4 phenological stage, and verified that the classification increased in quality when spectral patterns were added.
Sena Júnior et al. (2008) worked with topdressing fertilization levels for wheat (0, 30 e 60 kg ha-1), and used a spectral index (red, green, infrared
bands and combination of four spectral bands indexes) extracted from canopy digital images evaluated at 8, 14 and 30 days of nitrogen fertilization. The authors concluded that the indexes discriminate the N doses in the wheat canopy after 8 days of N topdressing. Silva et al. (2014) studied different extraction methods for detecting magnesium deficiency in corn leaves at the V4 stage, and verified the color information associated with the texture characteristic showed a higher percentage of global accuracy (98%) and Kappa (0.9) compared to gray scale images (GAR 50% and Kappa 0.7). However, Silva Junior et al. (2008) verified the green band was more efficient in relation to the foliar nutritional estimate, the foliar N content and the DM productivity than the red band.
Table 2 - Global accuracy rate (GAR) and Kappa index for each spectral index and combinations, for the different image block dimensions of the indicative leaf at the V4 stage
Spectral Indexes 9×9 pixels Spectal Indexes 20×20 pixels Spectal Indexes 40×40 pixels
GAR% Kappa GAR% Kappa GAR% Kappa
Nr, Ng, Rgr 80 0.73 a Nr, Ng, Rgr 78 0.70 a Nr, Ng, Rgr 68 0.57 a
Eg, Nr, Ng, Rgr 75 0.67 ab Eg, Ng, Rgr 78 0.70 a Ng 60 0.47 a
Eg, Nr, Ng 73 0.63 ab Eg, Nr, Ng 78 0.70 a Eg and Rgr 60 0.47 a
Eg, Ng, Rgr 70 0.60 ab Ng and Rgr 78 0.70 a Ng and Rgr 60 0.47 a
Eg and Ng 65 0.53 abc Nr and Rgr 78 0.70 a Eg 58 0.43 a
Eg and Rgr 63 0.50 bc Eg and Rgr 78 0.70 a Rgr 58 0.43 a
Nr and Ng 63 0.50 bc Nr and Ng 75 0.67 ab Eg e Nr 58 0.43 a
Nr and Rgr 63 0.50 bc Eg and Nr 75 0.67 ab Nr e Ng 58 0.43 a
Ng and Rgr 63 0.50 bc Eg and Ng 68 0.57 ab Nr e Rgr 58 0.43 a
Rgr 60 0.47 bc Eg, Nr, Ng, Rgr 65 0.53 ab Eg, Nr, Ng 58 0.43 a
Eg and Nr 60 0.47 bc Eg 65 0.53 ab Eg, Ng, Rgr 58 0.43 a
Eg 48 0.30 c Ng 65 0.53 ab Eg, Nr, Ng, Rgr 58 0.43 a
Ng 48 0.30 c Nr 55 0.40 b Eg e Ng 55 0.43 a
Nr 45 0.27 c Rgr 50 0.33 b Nr 40 0.20 b
Kappa coefficients followed by the same letter do not differ in the line through Z test, at 5% probability and followed by distinct letters differ significantly through Z test, at 5% probability. Eg = excess of green; Nr = normalized red; Ng = normalized green; Rgr = green-red ratio
Gonzalez and Woods (2008) reported that three visible color channels provide relevant image information. However, the isolate analysis may result in a loss of important information among these colors in the same pixel for the 3 channels. In this sense, the colorful image represents an important attribute to differentiate changes that occur in the leaf surface as a function of nutrient deficiency, even when these deficiencies are latent.
In this study, the statistical classifiers that obtained a Kappa value greater than 0.80 were considered worthy trust. Table 4 shows the occurrence frequency of Kappa classifiers equal to or greater than 0.80 for each image acquisition period and each combination of spectral indexes.
According to Table 4, there was no occurrence of excellent Kappa at V4; however, among the 15 spectral indexes studied, 10 combinations among them presented better performance in the classification, confirming that when the indexes are combined it is possible to distinguish nitrogen nutritional standards in the plant. The V7 stage best presents these distinctions.
The obtained results indicate a lower nitrogen at V4, as observed in the critical concentrations of N at this stage (Figure 2), but still do not show differences as development progresses. However, as the demand for N
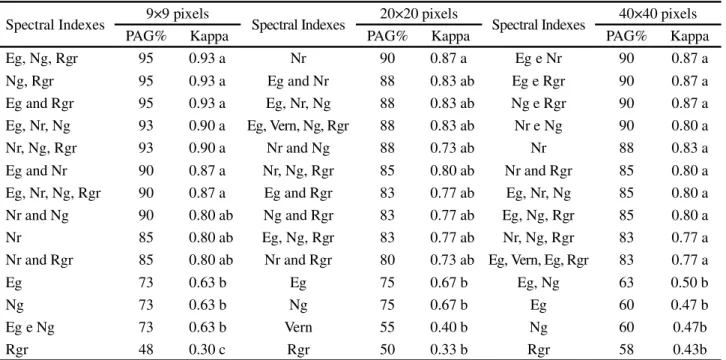
Table 3 - Global accuracy rate (GAR) and Kappa index for each spectral index and combinations, for the different image block dimensions of the indicative maize leaf at the V7 stage
Table 4 - Frequency of occurrence for Kappa classifiers equivalent to or higher than 0.80 at the developmental stages V4 and V7 for each combination of spectral indexes used as characteristic vector
Spectral Indexes 9×9 pixels Spectral Indexes 20×20 pixels Spectral Indexes 40×40 pixels
PAG% Kappa PAG% Kappa PAG% Kappa
Eg, Ng, Rgr 95 0.93 a Nr 90 0.87 a Eg e Nr 90 0.87 a
Ng, Rgr 95 0.93 a Eg and Nr 88 0.83 ab Eg e Rgr 90 0.87 a
Eg and Rgr 95 0.93 a Eg, Nr, Ng 88 0.83 ab Ng e Rgr 90 0.87 a
Eg, Nr, Ng 93 0.90 a Eg, Vern, Ng, Rgr 88 0.83 ab Nr e Ng 90 0.80 a
Nr, Ng, Rgr 93 0.90 a Nr and Ng 88 0.73 ab Nr 88 0.83 a
Eg and Nr 90 0.87 a Nr, Ng, Rgr 85 0.80 ab Nr and Rgr 85 0.80 a
Eg, Nr, Ng, Rgr 90 0.87 a Eg and Rgr 83 0.77 ab Eg, Nr, Ng 85 0.80 a
Nr and Ng 90 0.80 ab Ng and Rgr 83 0.77 ab Eg, Ng, Rgr 85 0.80 a
Nr 85 0.80 ab Eg, Ng, Rgr 83 0.77 ab Nr, Ng, Rgr 83 0.77 a
Nr and Rgr 85 0.80 ab Nr and Rgr 80 0.73 ab Eg, Vern, Eg, Rgr 83 0.77 a
Eg 73 0.63 b Eg 75 0.67 b Eg, Ng 63 0.50 b
Ng 73 0.63 b Ng 75 0.67 b Eg 60 0.47 b
Eg e Ng 73 0.63 b Vern 55 0.40 b Ng 60 0.47b
Rgr 48 0.30 c Rgr 50 0.33 b Rgr 58 0.43b
Spectral indexes V4 V7*
Eg 0 0
Nr 0 3
Ng 0 0
Rgr 0 0
Eg and Nr 0 3
Eg and Ng 0 0
Eg and Rgr 0 2
Nr and Ng 0 3
Nr and Rgr 0 2
Ng and Rgr 0 2
Eg, Nr, Ng 0 3
Eg, Nr, Rgr 0 3
Eg, Ng, Rgr 0 2
Nr, Ng, Rgr 0 2
Eg, Nr, Ng, Rgr 0 2
Kappa coefficients followed by the same letter do not differ in the line through Z test, at 5% probability and followed by distinct letters differ significantly through Z test, at 5% probability. Eg = excess of green; Nr = normalized red; Ng = normalized green; Rgr = green-red ratio
Eg-excess of green; Nr-normalized red; Ng- normalized green; Rgr-green-red ratio. *Frequency of maximum occurrence equivalent to 3
CONCLUSIONS
1. Image analysis using visible spectral indexes allowed for the identification of nitrogen deficiency in maize plants at the V4 and V7 developmental stages;
2. The use of combined spectral indexes in the classifier characteristic vector provided better classification performance;
3. The highest differentiations among classes occurred at stage V7;
4. The 9 × 9 pixel image block was the most adequate to distinguish classes corresponding to the nitrogen rates. For the conditions in this study, the combination of Nr, Ng and Rgr indexes allowed a higher GAR and Kappa index, which was very trust and worthy trust, obtaining 80% and 0.73 at V4 and 93% and 0.90 at V7, respectively;
5. The increase in N doses in the nutrient solution promoted higher N content in the indicative leaves at both developmental stages;
6. N supply for maize implies linear responses in dry mass production, based on the concentrations used in the nutrient solution, at the V4 and V7 developmental stages, according to the conditions in this study; 7. At V4 and V7, the external critical levels of N were 7.6
and 9.4 mmol L-1, respectively.
ACKNOWLEDGEMENT
FAPESP for granting research support and scholarship on the 2010 / 18233-3 and 2009 / 51835-0 processes.
REFERENCES
ABRAHÃO, S. A. et al. Determination of nitrogen and chlorophyll levels in bean-plant leaves by using spectral vegetation bands and indices.Revista Ciência Agronômica, v. 44, n. 3, p. 464-4173, 2013.
ALMEIDA, M. L.et al. Crescimento inicial de milho e sua relação com o rendimento de grãos.Ciência Rural, v. 33, n. 2, p. 189-194, 2013.
AMARAL, L. R.; MOLIN, J. P. Sensor óptico no auxílio à recomendação de adubação nitrogenada em cana-de-açúcar.
Pesquisa Agropecuária Brasileira, v. 46, n. 12, p. 1633-1642, 2011.
ATZBERGER, C. Advances in remote sensing of agriculture: context description, existing operational monitoring systems and major information needs.Remote Sensing, v. 5, n. 2, p. 949-981, 2013.
BACKES, A. R.; CASANOVA, D.; BRUNO, O. M. Plant leaf identification based on volumetric fractal dimension.
International Journal of Pattern Recognition and Artificial Intelligence, v. 23, n. 6, p. 1145-1160, 2009.
BAESSO, M. M. et al. Determinação do “status” nutricional de nitrogênio no feijoeiro utilizando imagens digitais coloridas.
Engenharia Agrícola, v.27, n. 2, p. 520-528, 2007.
BATAGLIA, O. C. et al. Métodos de análise química de plantas. Campinas: Instituto Agronômico, 1983. 48p. (Boletim Técnico, 78).
CARMARGO, A.; SMITH, J. S. Image pattern classification for the identification of disease causing agents in plants.Computers and Electronics in Agriculture, v. 66, n. 2, p. 121-125, 2009.
CONGALTON, R. G.; GREEN, K.Assessing the accuracy of remotely sensed data: principles and practices. 2nd ed. Boca Raton, FL: CRC Press, 2009, 183 p.
DELLINGER, A. E.; SCHMIDT, J. S.; BEEGLE, D. B. Developing Nitrogen Fertilizer Recommendations for Corn Using an Active Sensor.Agronomy Journal, v. 100, p. 1546-1552, 2008.
Block dimension Developmental stages
V4 V7
9 × 9 “pixels” 0.73 Ab 0.93 Aa
20 × 20 “pixels” 0.70 Aa 0.87 Aa 40 × 40 “pixels” 0.57 Ab 0.87 Aa
Table 5 - Kappa coefficient of the best classification results, at the developmental stages V4 and V7, for the blocks of 9 × 9; 20 × 20 and 40 × 40 “pixels”
Kappa coefficients followed by the same lowercase letter do not differ in the line through Z test, at 5% probability; Kappa coefficients followed by the same capital letter do not differ, in the column, through Z test at 5% probability
increased, a small reduction of N levels in the nutrient solution under 9.4 mmol L-1 at V7 (Figure 2), allowed for
a better class discrimination by image analysis.
EVERITT, B. S.; DUNN, G. (Ed.).Applied Multivariate Data Analysis. 2nd ed. London: London Arnold, 2001.
FERREIRA, M. M. M. Sintomas de deficiência de macro e micronutrientes de plantas de milho híbrido BRS 1010.Revista Brasileira de Agroambiente, v. 6, p. 74-83, 2012.
FURLANI, P. R. et al. Cultivo hidropônico de plantas.
Campinas: Instituto Agronômico, 1999. 52 p.
GONDIM, A. R. O. et al. Eficiência nutricional do milho cv. BRS 1030 submetido à omissão de macronutrientes em solução nutritiva.Revista Ceres, v. 57, n. 4, p. 539-544, 2010.
GONZALEZ, R. C.; WOODS, R. E. Digital image processing. 3rd ed. Reading, Massachusetts:
Addison-Wesley, 2008. 943 p.
HOAGLAND, D. R.; ARNON, D. I. The water culture method for growing plants without soil. Berkeley: California Agricultural Experimental Station, 1950. 32 p. (Circular 347). HOLLAND, K. H.; SCHEPERS, J. S. Derivation of a variable rate nitrogen application model for in-season fertilization of corn.Agronomy Journal, v. 102, n. 5, p. 1415-1424, 2010.
HOLLAND, K. H.; SCHEPERS, J. S. Use of a virtual-reference concept to interpret active crop canop sensor data. Precision Agriculture, v. 14, n. 1, p. 71-85, 2012.
HUDSON, W. D.; RAMM, C. W. Correct formulation of the kappa coefficient of agreement.Photogrammetric Engineering & Remote Sensing, v. 53, n. 4, p. 421-2, 1987.
PEDROSO, M. et al. A segmentation algorithm for the delineation of agricultural management zones. Computers
and Electronics in Agriculture, v. 70, n. 1, p. 199-208, 2010.
ROMUALDO, L. M. et al. Use of artificial vision techniques for diagnostic of nitrogen nutritional status in maize plants.
Computers and Eletronics in Agriculture, v. 104, p. 63-70, 2014.
SAS INSTITUTE. Version 9.2. Cary: Statistical Analysis System Institute, 2012.
SENA JÚNIOR, D. G. deet al. Discriminação entre estágios nutricionais na cultura do trigo com técnicas de visão artificial e medidor portátil de clorofila.Engenharia Agrícola, v. 28, n. 1, p. 187-195, 2008.
SHIRATSUCHI, L. S. et al. Water and nitrogen effects on active canopy sensor vegetation indices. Agronomy Journal, v. 103, n. 6, p. 1815-1826, 2011.
SILVA JÚNIOR, M. C. et al. Detecção do efeito da adubação nitrogenada em Brachiaria decumbens Stapf. utilizando um sistema de sensoriamento remoto. Revista Brasileira de Zootecnia, v. 37, n. 3, p. 411-419, 2008.
SILVA, F. F.et al. A diagnostic tool for magnesium nutrition in maize based on image analysis of different leaf sections.Crop Science, v. 54, p. 738-745, 2014.
TEIXEIRA, E. F.et al. Análise da uniformidade de sementes de milho via processamento de imagens digitais.Revista da FZVA, v. 14, n. 1, p. 14-24, 2007.
VON PINHO, R. A. V. et al. Marcha de absorção de macronutrientes e acúmulo de matéria seca em milho.Revista Brasileira de Milho e Sorgo, v. 8, p. 157-173, 2009.