Observed and estimated leaf appearance of landrace and improved maize cultivars
Emissão de folhas observada e estimada de cultivares crioulas e melhoradas de milho Josana Andreia Langner1 Nereu Augusto Streck2* Angelica Durigon2
Stefanía Dalmolin da Silva1 Isabel Lago2 Genei Antonio Dalmago3
Lia Rejane Silveira Reiniger2 Lúcio Gabriel Scheffel4 Anderson Haas Poersch5
ISSNe 1678-4596
INTRODUCTION
Regarding to the genetic variability, maize cultivars can be grouped in local, traditional or landrace cultivars (LTLCs), all open pollination varieties (OPV), and in
improved cultivars, that besides including OPV’s, also include hybrids (MORRIS et al., 2003). Farmers have autonomy of access, management and marketing of seeds and grains of LTLCs, on which, most of the time are named as “landrace”. Improved cultivars are those
1Programa de Pós-graduação em Engenharia Agrícola, Universidade Federal de Santa Maria (UFSM), Santa Maria, RS, Brasil.
2Departamento de Fitotecnia, Universidade Federal de Santa Maria (UFSM), Av. Roraima, 1000, 97105-900, Santa Maria, RS, Brasil. E-mail:[email protected]. *Corresponding author.
3Centro Nacional de Pesquisa de Trigo, Empresa Brasileira de Pesquisa Agropecuária (EMPRAPA), Passo Fundo, RS, Brasil. 4Curso de Agronomia, Universidade Federal de Santa Maria (UFSM), Santa Maria, RS, Brasil.
5Curso de Meteorologia, Universidade Federal de Santa Maria (UFSM), Santa Maria, RS, Brasil.
ABSTRACT: The objective of this study was to compare the simulations of leaf appearance of landrace and improved maize cultivars using
the CSM-CERES-Maize (linear) and the Wang and Engel models (nonlinear). The coefficients of the models were calibrated using a data set of
total leaf number collected in the 11/04/2013 sowing date for the landrace varieties ‘Cinquentinha’ and ‘Bico de Ouro’ and the simple hybrid
‘AS 1573PRO’. For the ‘BRS Planalto’ variety, model coefficients were estimated with data from 12/13/2014 sowing date. Evaluation of the
models was with independent data sets collected during the growing seasons of 2013/2014 (Experiment 1) and 2014/2015 (Experiment 2) in Santa Maria, RS, Brazil. Total number of leaves for both landrace and improved maize varieties was better estimated with the Wang and Engel
model, with a root mean square error of 1.0 leaf, while estimations with the CSM-CERES-Maize model had a root mean square error of 1.5 leaf.
Key words: Zea mays L., vegetative development, air temperature, sowing time, model.
RESUMO: O objetivo deste trabalho foi comparar a simulação da emissão de folhas de cultivares crioulas e melhoradas de milho realizada pelos modelos CSM-CERES-Maize (linear) e Wang e Engel (não linear). Para tanto, foram realizados dois experimentos nas safras agrícolas
de 2013/2014 e 2014/2015 com delineamento de blocos ao acaso. Os coeficientes dos modelos foram calibrados a partir de um conjunto de
dados de número de folhas totais de plantas, coletados na semeadura de 04/11/2013 para as cultivares crioulas ‘Cinquentinha’ e ‘Bico de
Ouro’ e o híbrido simples ‘AS 1573PRO’. Para a variedade de polinização aberta melhorada ‘BRS Planalto’, os coeficientes foram estimados
com dados da semeadura de 13/12/2014. A avaliação dos modelos foi realizada com dados independentes de semeaduras dos anos agrícolas 2013/2014 (Experimento 1) e 2014/2015 (Experimento 2) em Santa Maria, RS, Brasil. A melhor estimativa do número total de folhas, tanto para cultivares crioulas como melhoradas, foi obtida com o modelo Wang e Engel. A raiz do quadrado médio do erro do Wang e Engel foi de 1,0 folha, em comparação com o linear CSM-CERES-Maize, em que a raiz do quadrado médio do erro foi de 1,5 folha.
Palavras-chave: Zea mays L., desenvolvimento vegetativo, temperatura do ar, época de semeadura, modelo.
synthesized by a formal breeding program, and are commercialized under registered designation and/or under intellectual property protection for a patent system, a sui generis model, or even a combination of both (VIANA, 2011).
Simulation models can be used to estimate growth and development of crops. Growth corresponds to the increase in plant physical dimensions like dry matter, length, volume or area (STRECK et al., 2007). Development is related to processes that includes cellular differentiation and initiation and appearance of organs during the entire crop cycle (HODGES, 1991). To represent pant development, the total leaf number (TLN, leaf pl-1) can be applied as it is related to the
appearance of other organs. The TLN is calculated by the time integration of the leaf appearance rate (LAR, leaf day-1) (STRECK et al., 2003). The
LAR is an important parameter in simulation models as the TLN represents the occurrence of the development stages, related to time-specific management practices.
The LAR can be calculated by the
phyllochron, which is defined as the thermal time
needed to the appearance of two consecutive leaves in the main stem or in a branch, being the thermal time represented by a linear function (°C day leaf-1). Another way to calculate the LAR
is applying multiplicative models composed by response functions [f(T)], as the Wang and Engel (WE) model (WANG & ENGEL, 1998). In the WE, f(T) is described by a nonlinear function which combines the effect of environmental factors on LAR in a multiplicative way. LAR calculations with thermal time and f(T) are distinguished by the temperature response between the cardinal temperatures for plant development (lower (Tb), optimal (Tot), and upper (TB) (STRECK et al., 2003). Thermal time method considers that the development linearly increases between Tb and Tot and linearly decreases between Tot and Tb,
defining two straight lines. The f(T) function
considers that the development slowly increases above Tb, becoming linear until Tot and slowly
decreases until TB, creating an smooth inflection
in the development representation (STRECK et al., 2003). Both models are similar in LAR response just in an intermediate interval between Tb and Tot. Outside this interval, the WE is a better alternative. Many maize simulation models, including the CSM-CERES-Maize in the platform DSSAT (Decision Support System for Agrotechnology
Transfer) (Jones & Kiniry, 1986), use the thermal time method to simulate leaf appearance.
Even with the high importance of landrace maize cultivars, there are no records in the literature attempting to describe the interactions between its plants and environment using mathematical models, a tool that had increased its use in recent years. The Wang and Engel model has already been calibrated to leaf appearance for the improved OPV ‘BRS Missões’ (STRECK et al., 2009b, 2010). However, there are no references to previous studies of calibration and simulation of leaf appearance for OPVs, being improved or landrace with the CSM-CERES-Maize model. The objective of this study was to compare the simulations of leaf appearance of landrace and improved maize cultivars using the CSM-CERES-Maize (linear) and the Wang and Engel models (nonlinear).
MATERIALS AND METHODS
Two field experiments were conducted with maize in the growing seasons of 2013/2014 (Experiment 1) and 2014/2015 (Experiment 2), with different sowing dates, in Santa Maria, Rio Grande do Sul State, Brazil (latitude: 29º 43΄S, longitude: 53º 43΄W, and altitude: 95m). Soil type at the site was a Rhodic Paleudalf (SOIL SURVEY STAFF, 2010). Climate is subtropical humid, Cfa - Köppen’s System, with hot summers and no dry season.
Soil tillage was with one ploughing and two diskings. Soil was corrected by incorporating limestone to reach a pH of 6.0 (CQFS-RS/SC, 2004). The base fertilization varied according to the results of soil analysis being applied approximately 30-150-150kgha-1 with NPK
5-20-20. Nitrogen was top dressed at V3 and V8 stages (115kg ha-1 N). Supplemental irrigation was done
by drip and water applied during the crop cycle was around 150 and 200mm. Weed control was done manually with weeding hoes and taking into account the weed infestation in each sowing dates, usually done between the stages V3-V4, V6-V7 and V10-V11. Two landrace maize cultivars, ‘Cinquentinha’ (early maturity) and ‘Bico de Ouro’ (late maturity), and a simple hybrid, ‘AS 1573PRO’ (early maturity) were used in both experiments. In Experiment 2, OPV ‘BRS Planalto’ (early maturity) was added.
Each replication was composed by five lines, with
5.0m in length, and two side lines used as borders. Line spacing was 0.90m and plant spacing was 0.20m. In Experiment 1 the sowing dates were 08/20/2013, 11/04/2013 and 02/03/2014, and in Experiment 2 were 08/15/2014, 12/13/2014 and 01/07/2015. In the three central lines of each replication, 45 plants were marked in the landrace cultivars due to its high genetic variability, and 15 plants were marked in the improved maize cultivars with colored wires. In the marked plants, total leaf number (TLN, leaf pl-1) was weekly measured from
the canopy establishment until the plants emitted
the flag leaf. For counting a leaf, it was considered
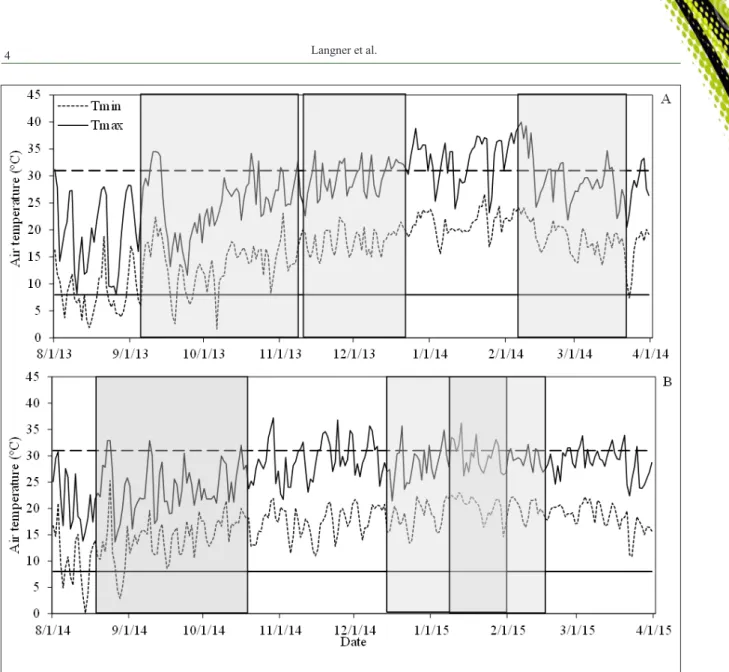
the moment when its tip was visible in the cartridge (STRECK et al., 2009b). Daily minimum (Tmin, °C) and maximum (Tmax, °C) air temperature data was collected from the automatic station of the 8th
District of Meteorology of the National Institute of Meteorology (DISME / INMET), located at about 100m from the experiment.
Two models were used to simulate leaf appearance: the linear, CSM-CERES-Maize (CERES) (JONES & KINIRY, 1986), and the nonlinear, Wang and Engel (WE) (WANG & ENGEL, 1998). In the CERES, TLN of a plant was calculated by: TLN = STa/FILO (leaf pl-1), where
STa is the accumulated thermal time during the leaf appearance period (ºC day) and FILO is the phyllochron of one plant (ºC day leaf-1). The STa was calculated by: STa = ƩSTd (ºC day), where
STd is the thermal time of one day (ºC day). The daily thermal time (STd) used was calculated by the CERES. In the WE, the TLN was calculated
by: TLN = ƩLAR (leaf pl-1), where LAR is the leaf
appearance rate in one day of one plant (leaf day-1).
The LAR is calculated by: LAR = LARmax·f(T), where LARmax is the maximum leaf appearance rate (leaf day-1)and f(T) is a temperature function
response. f(T) is a beta functions that varies from zero to one (Wang & Engel, 1998): f(T) =[(Topt– Tb)α –(T–Tb)2α]/(Topt–Tb)2α, when Tb≤T≤TB,
and f(T) = 0 when T<Tb or T>TB, with: α= ln(2)/ ln[(TB–Tb)/(Topt–Tb)], where Tb, Tot e TB are the cardinal temperatures for maize development (lower, optimal and upper), and T represents the maximum and minimum air temperatures (°C). f(T)s were calculated with Tmin and Tmax, and the arithmetic average between them was determined to get of the daily f(T) (STRECK et al., 2009a).
Cardinal temperatures in CERES and WE models were assumed as Tb = 8°C, Topt =
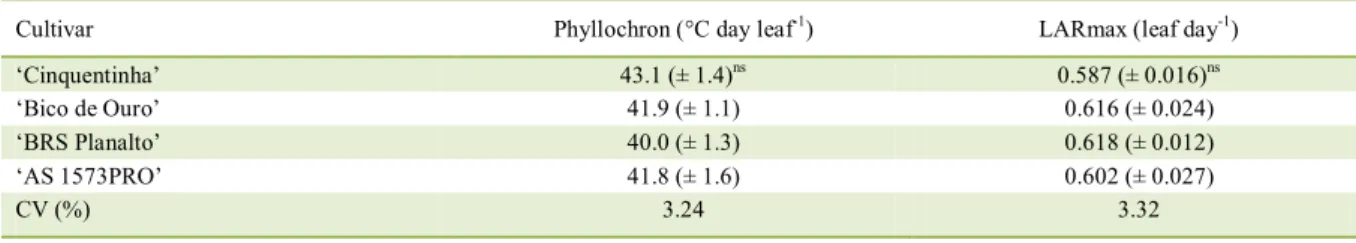
31°C and TB = 44°C (JONES & KINIRY, 1986; STRECK et al., 2009b). Coefficients phyllochron and LARmax are dependent on the genotype and were estimated using observed data of TLN in cultivars ‘Cinquentinha’, ‘Bico de Ouro’ and ‘AS 1573PRO’ for the 11/04/2013 sowing date. For ‘BRS Planalto’, these coefficients were obtained with observed data from the 12/13/2014 sowing date. Phyllochron was estimated by the inverse of the slope of the linear fit of TLN and STa (STRECK et al., 2009b). LARmax was estimated by the Ordinary Least Square method minimizing the residues between observed and simulated values of TLN (ERPEN et al., 2013). LARmax and phyllochron were estimated to each replication and the average was calculated to obtain the values for each cultivar.
An independent data set of TLN collected in Experiments 1 and 2 was used to evaluate the performance of the models for the cultivars ‘Cinquentinha’, ‘Bico de Ouro’ and ‘AS 1573PRO’. The evaluation of ‘BRS Planalto’ was done with an independent data set collected in Experiment 1. The following statistics were used (STRECK et al., 2009a, ERPEN et al., 2013): Root Mean
Square Error (RMSE): RMSE=[∑(Si-i)
2/n)]0,5;
Normalized Root Mean Square Error (NRMSE):
NRMSE=RMSE(100/Ō); BIAS index (BIAS):
BIAS=(ΣSi-Oi)/ΣOi; and correlation coefficient (r):
r = Σ(Oi-Ō)(Si-S)/{[Σ(Oi-Ō)
2][Σ(S
i-S)
2]}0,5; where
Si and Oi are the simulated and observed values, respectively,
S
andO
are the mean simulated and observed values, respectively, and n is the number of observations.RESULTS AND DISCUSSION
didn’t differ significantly between the cultivars (Table 1), indicating that there are similarity on leaf appearance in these cultivars. Although, there wasn’t significantly difference, we decided to use the calibrated values for each cultivar because these coefficients are genetic specific. Phyllochron and LARmax estimated for these cultivars are in the range of the observed total leaf appearance of the OPV ‘BRS Missões’ (39.6 to 59.8°C day leaf-1) as a function of the sowing
date (STRECK et al., 2009b), and 0.626 leaf day-1
(STRECK et al., 2009a), respectively.
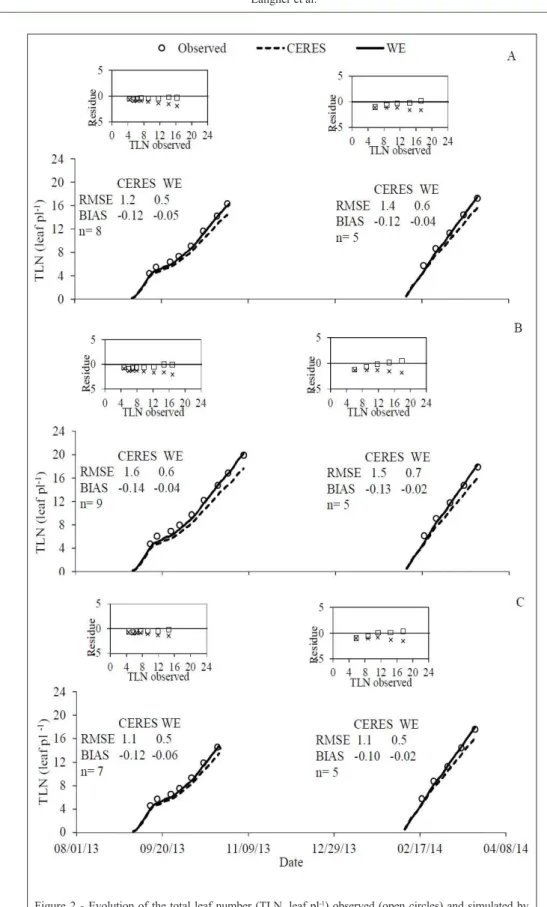
In the Experiment 1, the WE had a better performance with the RMSE value less than one leaf (Figure 2). Models underestimated the observations as shown by residues and the negative BIAS statistics, the higher underestimation was presented by CERES (Figure 2). In the beginning of the crop cycle of the 08/20/2013 sowing date, air temperature was lower (Figure 1A), the leaf
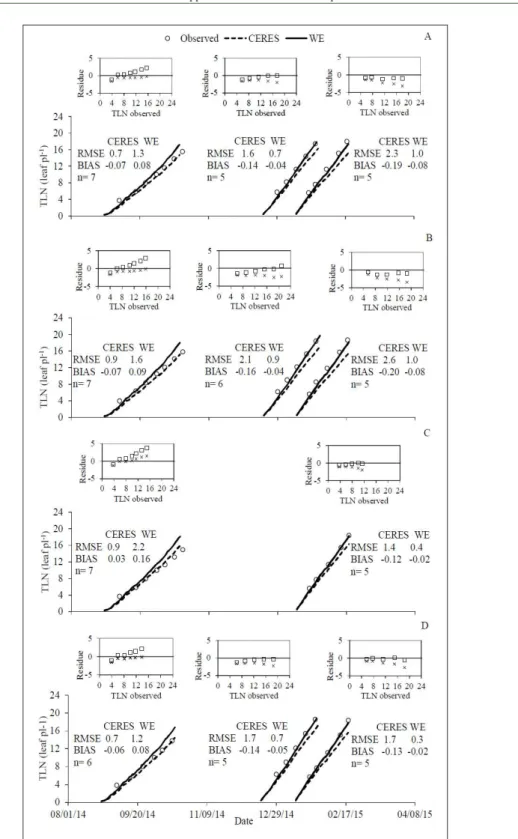
appearance was slower and increased when air became warmer (Figure 2). In the sowing date of 02/03/2014 when air temperature was higher since the beginning of the crop cycle, the leaf appearance rate was faster (Figures 1B and 2). In the Experiment 2, simulations by the WE overestimated the observations of the early sowing data (08/15/2014) for all cultivars with a lower performance than the CERES (Figure 3). Overestimation by WE occurred due to high maximum air temperatures since the beginning of leaf appearance, remaining close to the optimal temperature for maize development during the entire cycle (Figure 1B). The CERES had a better performance because it already presented a tendency of underestimation for the other sowing dates. In the late dates, the WE simulated better the leaf appearance, while the CERES kept the underestimation tendency (Figure 3). In these dates the air temperature was higher (Figure 1B) and the leaf appearance was better represented by the WE. For maize, the WE already presented a better performance in simulating leaf appearance of the OPV ‘BRS Missões’ compared to the linear (STRECK et al., 2010).
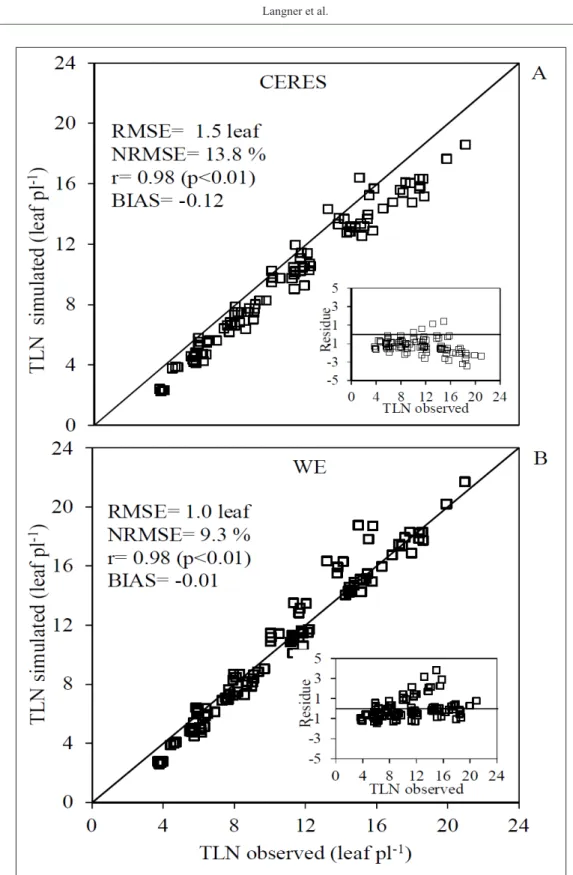
Computed statistics for all cultivars at all sowing dates confirm the best performance of WE to simulate leaf appearance of maize plants (Figure 4). The negative values of BIAS (-0.12 for CERES and -0.01 for WE) indicated that the models underestimate leaf appearance for all cultivars, with the WE presenting a smaller error. The superiority of the WE is confirmed by the NRMSE equal to 9.3% in contrast to 13.8% of the CERES. The r statistic was high for WE and CERES (0.98), both showing high correlation between observed and simulated values (Figure 4A and 4B). The RMSE was smaller
for the WE (1.0 leaf) (Figure 4B) in comparison to CERES simulations (1.5 leaf) (Figure 4A), a close result to the one reported for the ‘BRS Missões’ (RMSE of 1.3 leaf for the WE and 2.3 leaf for the linear (STRECK et al., 2010). For potato, the linear error was 3.7 leaves and the WE error was 2.0 leaves (STRECK et al., 2007). For eucalyptus trees, the RMSE ranged from 7.1 to 10.0 leaves for linear and from 2.7 to 3.7 leaves for the WE (MARTINS & STRECK, 2007). For two olive trees cultivars, the WE presented an error of 3.41 leaves while the linear showed an error of 7.5 leaves (MARTINS et al., 2014).
Our results confirmed the superiority of the WE over the linear also for landrace maize cultivars and extend the research of Streck et al. (2009b, 2010), making it to include the WE model in ecophysiological models for maize in future research , as it has been done for other crops. The WE already was included on the SimulArroz model, and the error observed for rice hybrid and varieties was equal to 0.98 leaf (RIBAS et al., 2017). For gladiolus plants, the WE is part of the PhenoGlad model with an error of 0.5 leaf (UHLMANN et al, 2017). Another example is for cassava plants in which the WE was included in the Simanihot model with a mean error of 6.76 leaves (TIRONI et al., 2017). After calibrated and tested for maize cultivars with a broad genetic variability, the WE may represent an important tool. As examples, WE can be applied to understand the effects of global warming on maize cultivar, and as a practical tool for farmers and extensionists to simulate the leaf appearance of maize and verify the ideal moments for management practices at each development stage.
Table 1 - Phyllochron (°C day leaf-1) and maximum leaf appearance rate (LARmax, leaf day-1) of the cultivars ‘Cinquentinha’, ‘Bico de Ouro’, ‘BRS Planalto’ and ‘AS 1573PRO’.Values between parentheses are the average standard deviations.
Cultivar Phyllochron (°C day leaf-1) LARmax (leaf day-1)
‘Cinquentinha’ 43.1 (± 1.4)ns 0.587 (± 0.016)ns ‘Bico de Ouro’ 41.9 (± 1.1) 0.616 (± 0.024) ‘BRS Planalto’ 40.0 (± 1.3) 0.618 (± 0.012) ‘AS 1573PRO’ 41.8 (± 1.6) 0.602 (± 0.027)
CV (%) 3.24 3.32
ns
Figure 4 - Total leaf number (TLN, leaf pl-1) observed and simulated by CSM-CERES-Maize model (CERES) (A) and by the Wang and Engel model (WE) (B) for the maize cultivars ‘Cinquentinha’, ‘Bico de
Ouro’, ‘BRS Planalto’ and ‘AS 1573PRO’ in the five sowing times used as independent data sets
(08/20/2013, 02/03/2014, 08/15/2014, 12/13/2014 and 01/07/2015). The solid black line is the line 1:1. Residue (TLN simulated minus TLN observed) versus TLN observed in each sowing times is presented in the insertions of each panel. RMSE: Root Mean Square Error; NRMSE: Normalized
CONCLUSION
The simulation of the leaf appearance of landrace and improved maize cultivars is better with the nonlinear model of Wang and Engel compared to the linear model CSM-CERES-Maize.
REFERENCES
CQFS-RS/SC (COMISSÃO DE QUÍMICA E DE FERTILIDADE DO SOLO). Manual de adubação e de calagem para os estados do Rio Grande do Sul e de Santa Catarina. 10.ed. Porto Alegre: SBCS/NRS, 2004. 400p.
ERPEN, L. et al. Estimating cardinal temperatures and modeling the vegetative development of sweet potato. AGRIAMBI, v.17, n.11, p.1230-1238, 2013. Available from: <http://www.scielo.br/ pdf/rbeaa/v17n11/v17n11a15.pdf>. Accessed: July 01, 2016. doi: 10.1590/S1415-43662013001100015.
HODGES, T. Predicting crop phenology. CRC, 1991. 233p.
JONES, C.A.; KINIRY, J.R. CERES-Maize: a simulation model of maize growth and development. College Station. Texas: A & M University, 1986. 194 p.
MARTINS, F.B.; STRECK, N.A. Leaf appearance in seedlings of eucalyptus estimated by two models. Pesquisa Agropecuária Brasileira, v.42, p.1091-1100, 2007. Available from: <http://www. scielo.br/pdf/pab/v42n8/a05v42n8.pdf>. Accessed: July 01, 2016. doi: 10.1590/S0100-204X2007000800005.
MARTINS, F.B. et al.Leaf development in two olive cultivars estimated by two models. Revista Brasileira de Meteorologia, v.29, p.505-514, 2014. Available from: <http://www.scielo.br/scielo. php?script=sci_arttext&pid=S0102-77862014000400004&ln g=pt&tlng=pt>. Accessed: Sept. 18, 2017. doi: 10.1590/0102-778620140020.
MORRIS, M. et al. Impacts of CIMMYT maize breeding research. In: In: EVENSON, R.E.; GULLIN, D. Crop Variety Improvement and Its Effect on Productivity: The Impact of International Agricultural Research, Eds: R.N. CABI Publishing, USA. 2003. Cap.8, p.135-158.
RIBAS, G.G. et al. Number of leaves and phenology of rice hybrids simulated by the SimulArroz model. Brasileira de Engenharia Agrícola e Ambiental, v.21, p.221-226, 2017. Available from: <http://www.scielo.br/scielo.php?script=sci_arttext&pid=S1415-43662017000400221&lng=en&tlng=en>. doi: 10.1590/1807-1929.
STRECK, N.A. et al. Improving predictions of developmental
stages in winter wheat: A modified Wang and Engel model. Agricultural and Forest Meteorology, v.115, p.139-150, 2003.
Available from: <http://www.sciencedirect.com/science/article/ pii/S0168192302002289?via%3Dihub>. doi: 10.1016/S0168-1923(02)00228-9.
STRECK, N.A. et al.Improving predictions of leaf appearance
in field grown potato. Scientia Agricola, v.64, p.12-18, 2007. Available from: <http://www.scielo.br/scielo.php?script=sci_ arttext&pid=S0103-90162007000100002>. doi: 10.1590/S0103-90162007000100002.
STRECK, N.A. et al. Comparing two versions of a non-linear model for simulating leaf number and developmental stages in maize based on air temperature. Ciência Rural, v.39, p.642-648, 2009a. Available from: <http://www.scielo.br/pdf/cr/v39n3/ a89cr787.pdf>. Accessed: July 01, 2016. doi: 10.1590/S0103-84782008005000089.
STRECK, N.A. et al. Base temperature for leaf appearance and phyllochron of the BRS Missões maize variety. Ciência Rural, v.39, p.224-227, 2009b. Available from: <http://www.scielo. br/pdf/cr/v39n1/a35v39n1.pdf>. Accessed: July 01, 2016. doi: 10.1590/S0103-84782009000100035.
STRECK, N.A. et al. Simulating leaf appearance in a maize variety. Bioscience Journal, v. 26, p.384-393, 2010. Available from: <http://www.seer.ufu.br/index.php/biosciencejournal/article/ viewArticle/7108>. Accessed: July 01, 2016.
SOIL SURVEY STAFF. Keys to Soil Taxonomy. Natural resources conservation service. 11.ed. Washington, 2010. 338p.
TIRONI, L.F. et al. SIMANIHOT: a process-based model for simulating growth, development and productivity of cassava. Engenharia Agrícola, v.37, p.471-483, 2017. Available from: <http://www.scielo.br/pdf/eagri/v37n3/1809-4430-eagri-37-03-0471.pdf>. Accessed: Sept. 18, 2017. doi: 10.1590/1809-4430.
UHLMANN, L.O. et al. PhenoGlad: A model for simulating development in Gladiolus. European Journal Agronomy, v.82, p.33–49, 2017. Accessed: Sept. 18, 2017. Available from: < h t t p : / / w w w. s c i e n c e d i r e c t . c o m / s c i e n c e / a r t i c l e / p i i / S116103011630185X>. doi: 10.1016/j.eja.2016.10.001
VIANA, A.A.N. A proteção de cultivares no contexto da ordem econômica mundial. In: BRASIL. Ministério da Agricultura, Pecuária e Abastecimento. Proteção de Cultivares no Brasil/ Ministério da Agricultura, Pecuária e Abastecimento. Secretaria de Desenvolvimento Agropecuário e Cooperativismo. Brasília: Mapa/ACS, 2011.202p.