1 Plant Protection
Corresponding author: annecosta@gmail.com Received: April 13, 2018 Accepted: September 06, 2018
Copyright: All the contents of this journal, except where otherwise noted, is licensed under a Creative Commons Attribution License.
Standard area diagram set for bacterial spot
assessment in fruits of yellow passion fruit
Anne Pinheiro Costa
1, Márcio de Carvalho Pires
2, José Ricardo Peixoto
2,
Luiz Eduardo Bassay Blum
3, Fábio Gelape Faleiro
4Abstract-This study developed and validated a standard area diagram set (SADs) for severity assessment of bacterial spot (Xanthomonas axonopodis pv. passiflorae) in fruits of yellow passion fruit (Passiflora edulis). The SADs consisted of eight severity levels (1%; 3%; 5%; 10%; 21%; 38%; 65%; and 80%). For its validation, 20 raters, who initially estimated the disease severity without the aid of the SADs, were divided into groups (G1 and G3, inexperienced; G2 and G4, experienced). Subsequently, G1 and G2 performed the second evaluation without the proposed SADs, and G3 and G4 completed the second evaluation using the proposed SADs. The accuracy and precision of the assessments were determined by simple linear regression and by the Lin’s
concordance correlation coefficient. The increase in the accuracy was confirmed by the reduction
in the constant and systematic errors, indicating that the estimated severities were close to the
actual values when the SADs was used. Inexperienced raters benefited the most from the use of
the SADs, and 60% and 100% of them presented constant and systematic error-free estimates,
respectively. Precision increased with the increase in the coefficient of determination, the reduction
in absolute errors, and the increase in the reproducibility of the estimates between pairs of raters.
Index terms:Passiflora edulis Sims, Xanthomonas axonopodis pv. passiflorae, phytopathometry, fruits.
Escala diagramática para a avaliação da bacteriose
em frutos do maracujazeiro azedo
Resumo-Este estudo desenvolveu e validou uma escala diagramática para a avaliação da severidade da bacteriose (Xanthomonas axonopodis pv. passiflorae) em frutos do maracujazeiro-azedo (Passiflora edulis). A escala diagramática apresentou oito níveis de severidade (1%, 3%, 5%, 10%, 21%, 38%, 65% e 80%). Para a sua validação, 20 avaliadores foram divididos em grupos (G1 e G3, sem experiência; G2 e G4, com experiência), que inicialmente estimaram a severidade da
doença sem auxílio da escala. Posteriormente, G1 e G2 fizeram outra avaliação sem a escala, e G3
e G4 realizaram a avaliação com a escala proposta. A acurácia e a precisão das estimativas foram
determinadas por regressão linear simples e pelo coeficiente de correlação de concordância de Lin.
O incremento da acurácia foi observado pela redução dos erros constantes e sistemáticos, indicando que as severidades estimadas se aproximaram dos valores reais quando a escala foi utilizada. Os
avaliadores inexperientes foram os mais beneficiados pelo uso da escala, sendo que 60% e 100%
dos avaliadores apresentaram estimativas sem erros constantes e sistemáticos, respectivamente. O
aumento da precisão foi verificado pelo incremento dos coeficientes de determinação, pela redução
dos erros absolutos e pelo aumento da reprodutibilidade das estimativas entre pares de avaliadores.
Termos para indexação: Passiflora edulis Sims, Xanthomonas axonopodis pv. passiflorae,
fitopatometria, frutos.
1Biologist, D.Sc., University of Brasilia, Faculty of Agronomy and Veterinary Medicine, Brasilia-DF, Brazil. E-mail: annecosta@gmail.com. 2Agricultural Engineer, D.Sc., Professor, University of Brasilia, Faculty of Agronomy and Veterinary Medicine, Brasilia-DF, Brazil. E-mails: peixoto@unb.br; mcpires@unb.br
3Agricultural Engineer, Ph.D., Professor, Department of Plant Pathology, University of Brasilia, Institute of Biological Sciences, Brasilia-DF, Brazil. E-mail: luizblum@unb.br
Introduction
Yellow passion fruit (Passiflora edulis Sims) stands out as the most cultivated and commercialized species of the genus Passiflora due to its fruit quality and yield (FALEIRO et al., 2011). However, this species is susceptible to several diseases, such as bacterial spot (Xanthomonas axonopodis pv. passiflorae), which is widespread in all producing regions, depreciating the fruit quality and value and reducing the crop’s production cycle (JUNQUEIRA et al., 2016). Bacterial spot lesions on the fruit are large, with initial green and greasy appearance, which later becomes brown. They are circular or irregular
in shape, with well-defined edges, which can coalesce
and cause larger lesions (FISCHER; REZENDE, 2008).
Initially, lesions are superficial; however, the pathogen can
penetrate the pulp and promote its fermentation, resulting in fruit rotting (PERUCH et al., 2011).
Quantifying disease severity is fundamental in epidemiological studies (DE BEM et al., 2016) for the evaluation of control strategies (MARCUZZO et al., 2016)
and identification of resistance sources (GYAWALI et al.,
2018). In breeding programs of yellow passion fruit, this evaluation has been carried out using descriptive scales (KUDO et al., 2012; BATISTTI et al., 2013; VIANA et al., 2014; NOGUEIRA, 2016). These scales are subjective and do not allow adjusting the visual acuity when evaluating the severity levels (CAMPBELL; MADDEN, 1990),
which impairs the precise quantification of the injured area
(SANTOS et al., 2017). Conversely, diagrammatic scales or standard area diagram set (SADs) are valuable tools
for the identification of variations in disease resistance among genotypes. When applying scales, the accuracy and precision of the disease severity estimates are significantly
improved, resulting in fewer experimental errors (LAGE et al., 2015; DE PAULA et al., 2016; SANTOS et al., 2017). Consequently, heritability estimates for disease resistance are more reliable, which increases the potential gains from selective breeding (VIEIRA et al., 2014).
The use of SADs has contributed to increasing the accuracy and precision of estimates of disease severity caused by Xanthomonas to other plants, such as grapes (NASCIMENTO et al., 2005), peach (CITADIN et al., 2008), common beans (LIMA et al., 2013), orange (BRAIDO et al., 2015), and tomato (DUAN et al., 2015). Despite the great relevance of diseases in yellow passion fruit crops, the only SADs validated for diseases
quantification in this species is the one developed by Fischer
et al. (2009) for the evaluation of anthracnose in fruits. Considering the lack of standardized methods to quantify the bacterial spot severity in this fruit, this work aimed to: (1) develop and validate a SADs for the evaluation of bacterial spot severity in yellow passion fruit; (2) compare the accuracy, precision, and agreement of disease severity estimates, with and without the aid of the SADs; and (3) compare the accuracy, precision, and agreement of the estimates of inexperienced and experienced raters.
Material and methods
Development of the SADs
Fifty fruits of yellow passion fruit (BRS Gigante Amarelo and Yellow Master FB200 commercial cultivars) showing symptoms of bacterial spot were collected at Paraná Farm commercial orchard, located in Nucleo Rural Pipiripau, Planaltina, DF (lat. 47°29’56,92’’ S; long.
15°30’15,08’’ W, and alt. 955 m). The adaxial surface of
each fruit was photographed with a digital camera (Canon Powershot SX40 HS, 12.1 megapixels; Canon Inc., Tóquio, Japão), set at 45 cm height from the fruit level. The resulting images were analyzed for the diseased area (necrotic + chlorotic), using the image analysis software IMAGE J (SCHNEIDER et al., 2012). The percentage of lesion area (% lesion area) was determined by dividing the lesion area by the total fruit area.
The SADs’ upper and lower limits were based on the minimum and maximum values of bacterial spot severity found in the image analysis of the 50 fruits. Intermediate levels were established following logarithmic increments (NUTTER; SCHULTZ, 1995). A standard fruit was used as the template, and diagrams with different severity levels were created using the IMAGE J software. The patterns of lesion distribution detected on the actual fruits were maintained.
Validation of the SADs
The SADs was validated using images of 50 fruits with different intensities of symptoms. Twenty raters (ten with previous experience and ten without previous
experience in disease quantification) were selected and
divided into four groups of five raters (G1 and G3, inexperienced; G2 and G4, experienced). Initially, each group estimated the disease severity, in percentage, for each of the 50 fruit images randomly organized, without the aid of the SADs (non-aided evaluation). Subsequently, the same images were presented to G1 and G2, who performed another non-aided evaluation, and to G3 and G4, who conducted the evaluation using the proposed SADs (SADs-aided evaluation).
The accuracy and precision of the raters were determined by linear regression between the actual severity (independent variable) and the visually estimated severity (dependent variable). The accuracy of estimates of each rater was determined by a t-test applied to the intercept of linear regression (a) to verify if it was significantly
different from 0, and to the slope of the line (b), to test if
it was significantly different from 1 (P ≤ 0.05). Intercept values significantly different from 0 indicate the presence
most accurate raters were those whose estimates provided linear regression equations with values of “a” and “b” not
significantly different from 0 and 1 by the t-test.
The precision of estimates of each rater was obtained by the coefficient of determination of the regression analysis (R2) and the variance of absolute
errors (the difference between estimated and actual severities) (KRANZ, 1988). Absolute errors were
compared by the t-test (P ≤ 0.05). Raters with higher
values of R2 were considered as of higher precision.
Evaluations of the absolute errors considered the criteria
used in disease quantification training programs [Distrain (TOMERLIN; HOWELL, 1988) and Disease.Pro (NUTTER; WORAWITLIKIT, 1989)], which classify
raters as excellent (errors up to 5%) or good (errors up to 10%). The mean maximum error (absolute value) was also recorded for each group, indicating, in absolute value, the difference between the farthest estimate and the actual severity value. The reproducibility or inter-rater reliability was measured using the R2 values for each pair of raters,
based on estimates of non-aided evaluations and SADs-aided evaluations (NUTTER; SCHULTZ, 1995).
Accuracy and precision (agreement) of the estimates of each rater, with and without the use of the SADs, was also determined based on the Lin’s concordance
correlation coefficient (LCCC; ρc). The LCCC combines measures of accuracy and precision to assess the relational fit of pairs of observations to the concordance line (45º) (with intercept = 0 and slope = 1), or 1:1 line, and is defined by ρc= Cb . r. The element Cb is a biascorrection factor
that measures how far the best-fit line deviates from 45°;
therefore, it corresponds to a measure of accuracy. In its turn, r is the correlation coefficient between the estimated severity (Y) and the actual severity (X), which measures the precision (variation) or the scattering of points around
the best-fit line. When the perfect agreement between
estimated and actual severity occurs, the points fall on the concordance line. As a result, r = 1, Cb= 1, and ρc= 1 (LIN, 1989; BOCK et al., 2010).
Linear regressions and absolute errors analyses were performed using the Genes software (v. 1990.2017.37). The LCCC was calculated using the MedCalc software (v. 17.9.7).
Results and discussion
The bacterial spot severity recorded in yellow
passion fruit naturally infected in the field was between
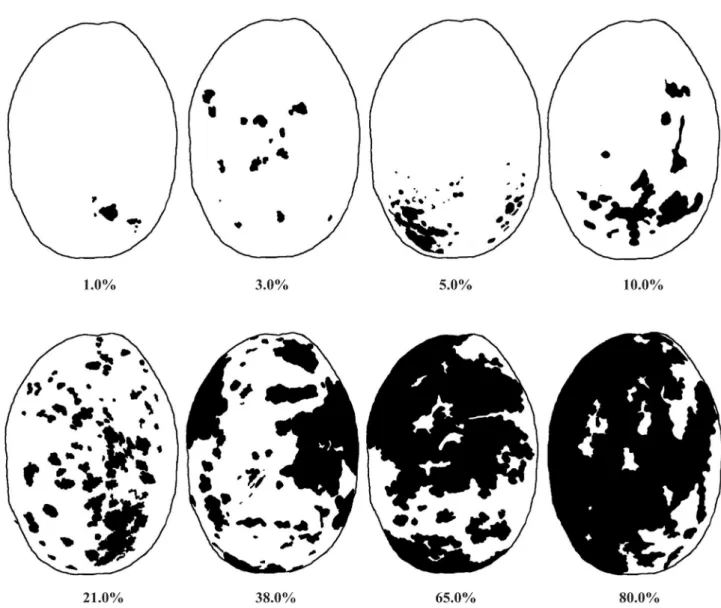
1% and 79.5%. The observed lesions showed typical symptomatic patterns of the disease, with circular or irregular shape, brown color, and in most cases, they covered large areas of the fruit (FISCHER; REZENDE, 2008). From these disease severity ranges, a SADs was proposed, which was divided into eight severity levels
(1%, 3%, 5%, 10%, 21%, 38%, 65%, and 80%) (Figure 1). The high severity levels reported in this study are commonly observed in yellow passion fruit orchards due to the difficult control of this disease and the susceptibility of commercial cultivars to this bacterium (ISHIDA; HALFELD-VIEIRA, 2009). To better represent
the severity values identified for the bacterial spot, the
SADs composed of a larger number of diagrams are frequently used in pathosystems that involve the species
Xanthomonas (NASCIMENTO et al., 2005; LIMA et al., 2013; DUAN et al., 2015), as established in this study.
The accuracy analysis was performed to verify the proximity between the values of estimated severity and actual severity (NUTTER; SCHULTZ, 1995). Figures 2 to 5 show the linear regressions obtained between the actual and estimated severities for all raters in evaluations 1 and 2. The accuracy of the estimates reduced in the second evaluation performed by G1, and the number of
estimates with constant errors [i.e., intercept different
from 0 (P ≤ 0.05)] increased. Conversely, the accuracy of raters who showed constant errors in the first evaluation
in G2 increased in the second non-aided evaluation. In the SADs-aided groups, 60% and 40% of the raters in G3 and G4, respectively, had intercept values equal to 0
(P ≤ 0.05) (Table 1). These results indicate a reduction of constant errors for all disease severity levels verified in
the evaluation 1 (non-aided).
Regarding the slope of the line, 75% of the G1 raters had an improvement in the accuracy levels in the
second evaluation, with a coefficient significantly equal to 1 (P ≤ 0.05). In G2, the number of raters who had an
increase in the accuracy was equal to those whose accuracy was reduced. Among the SADs-aided groups, G3 showed the highest percentage of raters with improvement in
accuracy levels due to the significant reduction in the
systematic errors of the estimates (100% in G3 vs. 50% in
G4). In this sense, inexperienced raters appear to benefit
more by the use of the SADs than those of the other groups since 60% of the raters in G3 did not show systematic and constant errors (Table 1).
Mean R2 values were high in all groups and
evaluations (Table 1). One of the reasons for the raters’ good performance may be the distribution pattern and size of bacterial spot lesions. According to Bock et al. (2010) and González-Domínguez et al. (2014), the accuracy
and precision of estimates are directly influenced by
In the second evaluation, the mean R2 value did
not increase in G1 and reduced in G2. Conversely, the use of the SADs increased the precision in G3 and
G4. This increase was more significant in the group of
inexperienced raters (G3), whose R2 value increase from
0.85 (non-aided) to 0.93 (SADs-aided). In the experienced group (G4), precision increased from 0.91 to 0.94 (Table 1). These results indicate that, with the SADs, estimates were related to the actual value in both groups. They also show a greater increase in the precision for the inexperienced raters when compared with the experienced raters. Different studies have already compared the raters’ performance, indicating the existence of diversity in the individual ability to assess the severity of a particular disease. Studies usually state that the use of the SADs may be more advantageous for inexperienced raters than experienced raters (FISCHER et al., 2009; YADAV et al., 2013; GONZÁLEZ-DOMÍNGUEZ et al., 2014; NUÑEZ et al., 2017). The use of the SADs for disease evaluation makes the assessment more accurate and precise as it guides the raters in the data collection. The SADs does not replace the experience and knowledge of characteristic symptoms of a pathogen or physiological stress. However,
it can improve the efficiency of the inexperienced and
experienced raters by providing a reference point for comparison (VENTURINI et al., 2015).
In addition to the determination coefficient, the
good precision of raters can be detected by determining the absolute or residual error (the difference between estimated and actual severity). Regardless of the rater’s experience, the precision increased with the use of the
SADs, which was confirmed by the lower dispersion of
data in the regression (Figures 2-5) and the reduction of
absolute errors (P ≤ 0.05) (Table 2), resulting in differences
between the SADs-aided and non-aided evaluations in the same group.
The distribution of errors of non-aided evaluations ranged from -12.3 to +32.7 (G1); -20.5 to +17.0 (G2); -37.0 to +31.9 (G3); and -16.8 to +30.0 (G4). In the second non-aided evaluation, errors ranged from -16.5 to +27 (G1) and -20.5 to +27.0 (G2). In SADs-aided evaluations, distribution of errors ranged from -20.5 to +25.7 and -28.4 to +24.2 in G3 and G4, respectively. The mean maximum error of the actual severity, in absolute value, decreased by 20.2% in the second evaluation performed by G1; conversely, in G2, an increase was observed. The mean maximum error reduced with the use of the SADs, corresponding to a 32.5%-lower value for the inexperienced raters and 24.1%-lower value for the experienced raters in relation to the non-aided evaluation (Table 3). The reduction in absolute errors in G3 and G4 demonstrates that the precision of the visual estimates increased with the use of the SADs. This increase indicates an approximation between the estimates of the less-accurate and the more-less-accurate raters and corroborates
studies previously reported (DE PAULA et al., 2016; CORREIA et al., 2017; NUÑEZ et al., 2017; SANTOS et al., 2017), considering that the proposed SADs aims to
standardize the disease quantification.
G1 and G2 raters had greater absolute errors in the second evaluation, resulting in an increase in estimates with errors higher than 10% (-10 to +10) (Table 3). SADs-aided evaluations had a decrease in the percentage of estimates with errors greater than 10% when compared with the non-aided evaluation. Thus, 89.6% (G3) and 93.6% (G4) of the estimates were concentrated within the range of 10%, which is considered as satisfactory in studies on the
SADs validation (NUTTER; WORAWITLIKIT, 1989).
In SADs-aided evaluations, the percentage of estimates within the range of 5% (-5 to +5) was higher in G3 and G4, which indicates that the raters’ estimates were closer to the actual severity value. Although such behavior was also detected in G1, this increase (1.3%) was much more discreet than those observed for the SADs-aided groups (14.8% and 16.9% for G3 and G4, respectively) (Table 3).
The precision of the evaluations was also analyzed by the reproducibility of the estimates among the raters, who had access to the same images sample, with and without the aid of the SADs. According to Belasque Junior et al. (2005), when the R2 value of the comparison
between two raters is close to 1.00, raters’ estimates are
repeated. In the first evaluation, R² values of regressions of estimates between pairs of raters in G3 and G4 ranged from 0.72 to 0.87 (mean 0.80) and from 0.80 to 0.91 (0.85), respectively. In the second evaluation, R² values varied from 0.85 to 0.93 (0.89) in G3, and from 0.85 to 0.96 (0.91), in G4. The use of the SADs provided higher R²
values for 100% and 90% of the combinations in G3 and G4, respectively, evidencing the increase in the precision of the estimates when using the SADs.
The R2 and r coefficients inform on the precision of
an estimate. However, they do not report on the accuracy of a model (PEREIRA et al., 2008). The Lin’s concordance
correlation coefficient (ρc), however, is the product of the elements precision (r) and accuracy (Cb), reflecting the
degree of agreement between estimated and actual values
(LIN, 1989). The Lin’s concordance correlation coefficient confirmed the increments in the accuracy and precision
of the raters, which were previously described for the
SADs-aided evaluation. In the first evaluation, G1 and
G2 had higher ρc values, indicating that the values were closer to the actual values in relation to groups G3 and G4. Nevertheless, when using the SADs, the agreement between the actual and estimated severity values
increased, as confirmed by the approximation between the best-fit line (between actual and estimated severity) and
(G4) when compared with the non-aided evaluations of these groups (Table 4). No increase was observed for the agreement in the groups that performed the double non-aided evaluation (Table 4, Figures 2 and 3).
r and Cbvalues also increased in the SADs-aided evaluations, unlike the results of G1 and G2 (Table 4).
Less accurate and precise raters benefited the most by
the use of the SADs, showing the largest increments in the evaluated parameters. Thus, G3 exhibited a 4.3% and 6.5% increase in accuracy and precision, respectively, while G4 showed a 2.1% (accuracy) and 4.3% (precision)
increase. Conversely, more accurate and/or precise raters did not respond as well to the use of the SADs as those who initially had less accurate and precise estimates. In fact, raters 14, 19, and 20 demonstrated a slight increase in errors (Table 2) and/or no increment or slight loss of accuracy, precision, and agreement (Table 4). These results indicate that the SADs helped standardize the evaluations of the several raters, as also reported by Yadav et al. (2013).
Figure 2. Bacterial spot (Xanthomonas axonopodis pv. passiflorae) severity on fruits of yellow passion fruit (Passiflora
edulis Sims) estimated by inexperienced raters, without the aid of the standard area diagram set in the first (A-E) and
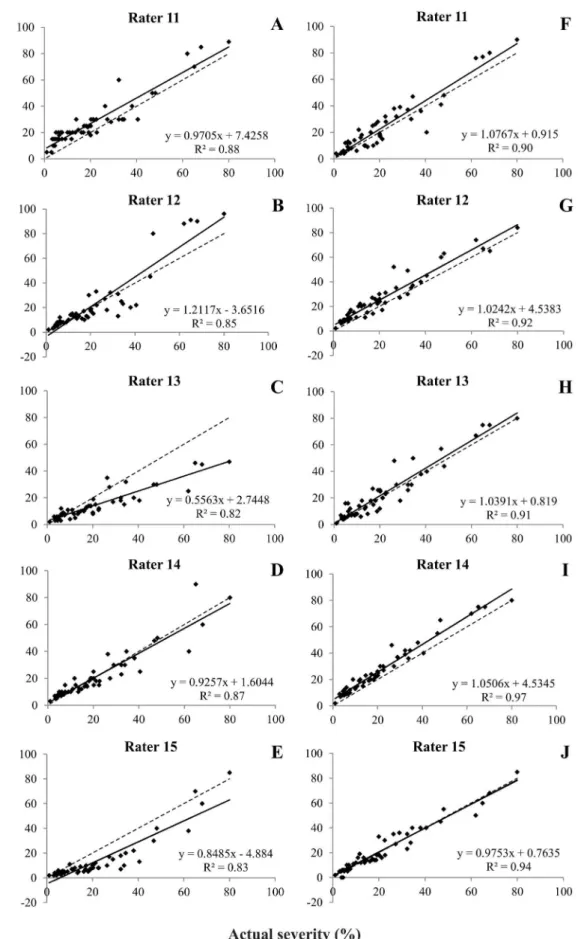
Figure 3. Bacterial spot (Xanthomonas axonopodis pv. passiflorae) severity on fruits of yellow passion fruit (Passiflora
edulis Sims) estimated by experienced raters, without the aid of the standard area diagram set in the first (A-E) and
Figure 4.Bacterial spot (Xanthomonas axonopodis pv. passiflorae) severity on fruits of yellow passion fruit (Passiflora
edulis Sims) estimated by inexperienced raters, without the aid of the standard area diagram set (SADs) in the first
Figure 5. Bacterial spot (Xanthomonas axonopodis pv. passiflorae) severity on fruits of yellow passion fruit (Passiflora
edulis Sims) estimated by experienced raters, without the aid of the standard area diagram set (SADs) in the first
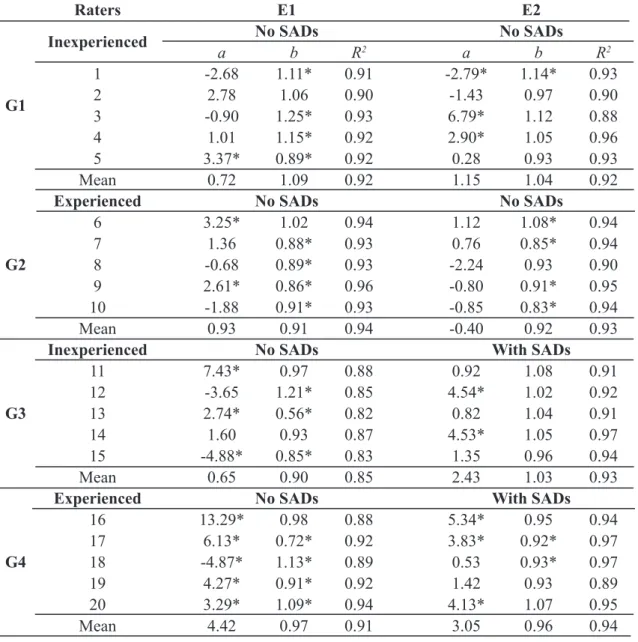
Table 1. Intercepts (a), slope coefficients (b), and coefficients of determination (R2) of linear regression for actual
severity versus estimated severity of bacterial spot (Xanthomonas axonopodis pv. passiflorae) in fruits of yellow pas-sion fruit (Passiflora edulis Sims). Brasilia, DF, Brazil, 2018.
Raters E1 E2
G1
Inexperienced No SADs No SADs
a b R2 a b R2
1 -2.68 1.11* 0.91 -2.79* 1.14* 0.93
2 2.78 1.06 0.90 -1.43 0.97 0.90
3 -0.90 1.25* 0.93 6.79* 1.12 0.88
4 1.01 1.15* 0.92 2.90* 1.05 0.96
5 3.37* 0.89* 0.92 0.28 0.93 0.93
Mean 0.72 1.09 0.92 1.15 1.04 0.92
G2
Experienced No SADs No SADs
6 3.25* 1.02 0.94 1.12 1.08* 0.94
7 1.36 0.88* 0.93 0.76 0.85* 0.94
8 -0.68 0.89* 0.93 -2.24 0.93 0.90
9 2.61* 0.86* 0.96 -0.80 0.91* 0.95
10 -1.88 0.91* 0.93 -0.85 0.83* 0.94
Mean 0.93 0.91 0.94 -0.40 0.92 0.93
G3
Inexperienced No SADs With SADs
11 7.43* 0.97 0.88 0.92 1.08 0.91
12 -3.65 1.21* 0.85 4.54* 1.02 0.92
13 2.74* 0.56* 0.82 0.82 1.04 0.91
14 1.60 0.93 0.87 4.53* 1.05 0.97
15 -4.88* 0.85* 0.83 1.35 0.96 0.94
Mean 0.65 0.90 0.85 2.43 1.03 0.93
G4
Experienced No SADs With SADs
16 13.29* 0.98 0.88 5.34* 0.95 0.94
17 6.13* 0.72* 0.92 3.83* 0.92* 0.97
18 -4.87* 1.13* 0.89 0.53 0.93* 0.97
19 4.27* 0.91* 0.92 1.42 0.93 0.89
20 3.29* 1.09* 0.94 4.13* 1.07 0.95
Mean 4.42 0.97 0.91 3.05 0.96 0.94
E1 = evaluation 1; E2 = evaluation 2
Table 2. Absolute errors (estimated severity - actual severity) of bacterial spot (Xanthomonas axonopodis pv. passiflorae) severity estimates in fruits of yellow passion fruit (Passiflora edulis Sims). Brasilia, DF, Brazil, 2018.
Raters E1 E2
G1
Inexperienced No SADs No SADs
1 5.4 a 4.2 a
2 5.6 a 4.4 a
3 6.0 a 10.1 b
4 5.9 a 4.4 a
5 4.2 a 3.6 a
Mean 5.4 a 5.4 a
G2
Experienced No SADs No SADs
6 5.0 a 4.4 a
7 3.8 a 4.1 a
8 4.3 a 4.9 a
9 3.5 a 3.8 a
10 4.5 a 5.1 a
Mean 4.2 a 4.5 a
G3
Inexperienced No SADs With SADs
11 7.9 b 5.6 a
12 6.1 a 5.8 a
13 7.9 b 4.4 a
14 4.3 a 5.6 a
15 8.7 b 3.4 a
Mean 7.0 b 5.0 a
G4
Experienced No SADs With SADs
16 13.0 b 5.0 a
17 5.2 b 3.1 a
18 5.8 b 2.6 a
19 4.4 a 3.8 a
20 5. 7 a 5.9 a
Mean 6.8 b 4.1 a
E1 = evaluation 1; E2 = evaluation 2
*Different letters in the same row indicate significant differences (Student´s t-test, P ≤ 0.05).
Table 3. Mean maximum error in absolute value (MEAV), at 10% (x ± 10) and 5% (x ± 5) error range of the severity estimates in relation to the actual severity of bacterial spot (Xanthomonas axonopodis pv. passiflorae) in fruits of yellow passion fruit (Passiflora edulis Sims). Brasília, DF, Brasil, 2018.
Evaluation Parameters Groups
1 2 3 4
1
MEAV 25.3 16.0 29.8 23.2
% x ± 5 61.2 70.4 54.0 61.6
% x ± 10 86.8 94.0 74.8 88.4
2
MEAV 20.2 17.9 20.1 17.6
% x ± 5 62.0 68.4 62.0 72.0
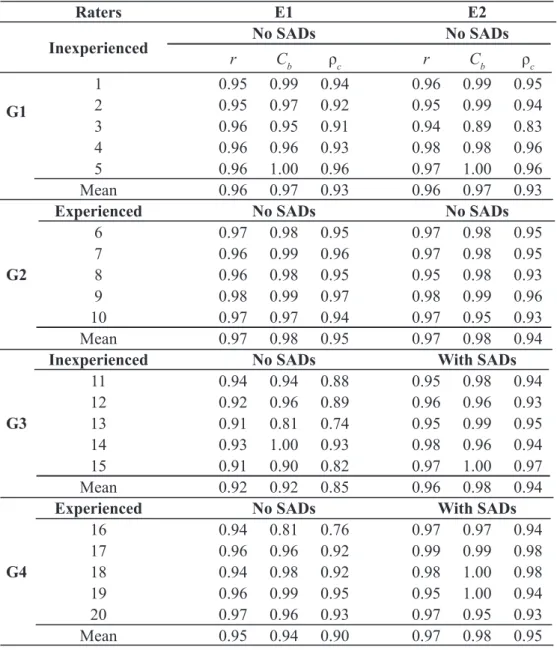
Table 4. Correlation coefficient between estimated severity and actual severity (r), bias correction factor (Cb), and
Lin’s concordance correlation coefficient (ρc) for bacterial spot (Xanthomonas axonopodis pv. passiflorae) severity estimates in fruits of yellow passion fruit (Passiflora edulis Sims). Brasilia, DF, Brazil, 2018.
Raters E1 E2
G1
Inexperienced No SADs No SADs
r Cb ρc r Cb ρc
1 0.95 0.99 0.94 0.96 0.99 0.95
2 0.95 0.97 0.92 0.95 0.99 0.94
3 0.96 0.95 0.91 0.94 0.89 0.83
4 0.96 0.96 0.93 0.98 0.98 0.96
5 0.96 1.00 0.96 0.97 1.00 0.96
Mean 0.96 0.97 0.93 0.96 0.97 0.93
G2
Experienced No SADs No SADs
6 0.97 0.98 0.95 0.97 0.98 0.95
7 0.96 0.99 0.96 0.97 0.98 0.95
8 0.96 0.98 0.95 0.95 0.98 0.93
9 0.98 0.99 0.97 0.98 0.99 0.96
10 0.97 0.97 0.94 0.97 0.95 0.93
Mean 0.97 0.98 0.95 0.97 0.98 0.94
G3
Inexperienced No SADs With SADs
11 0.94 0.94 0.88 0.95 0.98 0.94
12 0.92 0.96 0.89 0.96 0.96 0.93
13 0.91 0.81 0.74 0.95 0.99 0.95
14 0.93 1.00 0.93 0.98 0.96 0.94
15 0.91 0.90 0.82 0.97 1.00 0.97
Mean 0.92 0.92 0.85 0.96 0.98 0.94
G4
Experienced No SADs With SADs
16 0.94 0.81 0.76 0.97 0.97 0.94
17 0.96 0.96 0.92 0.99 0.99 0.98
18 0.94 0.98 0.92 0.98 1.00 0.98
19 0.96 0.99 0.95 0.95 1.00 0.94
20 0.97 0.96 0.93 0.97 0.95 0.93
Mean 0.95 0.94 0.90 0.97 0.98 0.95
Conclusions
The proposed SADs increased the ability of the raters to accurately and precisely estimate the disease
severity, showing to be efficient to increase the agreement
between the estimated values and the actual values and the reproducibility of estimates among raters. Therefore, the SADs can be used in epidemiological studies, in the evaluation of control strategies for this disease, and in studies on the resistance to bacterial spot in plant breeding programs. They can also help reduce the training time of raters, so that accurate and precise estimates are achieved more quickly.
Acknowledgments
This study was financed, in part, by the Coordenação
de Aperfeiçoamento de Pessoal de Nível Superior - Brasil (CAPES) - Finance Code 001. The authors acknowledge the raters for their contribution to the SADs validation. The authors also thank Dr. Ildeu Soares Martins and Dr. Michelle Souza Vilela for their guidance with the statistical analyses.
References
BATISTTI, M.; KRAUSE, W.; BARÉA, M.; ARAUJO,
D. V.; PALÚ, E. G. Resistência à verrugose de cultivares de maracujazeiro amarelo sob diferentes métodos de inoculação. Enciclopédia Biosfera, Goiânia, v.9, n.16,
p.2710-2720, 2013. (1)
BELASQUE JÚNIOR, J.; BASSANEZI.R.B., SPÓSITO,
M.B.; RIBEIRO, L.M.; JESUS JÚNIOR, W.C.; AMORIM,
L. Escalas diagramáticas para avaliação da severidade do cancro cítrico. Fitopatologia Brasileira, Brasília, DF, v.30, n.4, p.387-393, 2005. (1)
BOCK, C.H.; POOLE, G.; PARKER, P.E.; GOTTWALD,
T.R. Plant disease severity estimated visually, by digital photography and image analysis, and by hyperspectral imaging. Critical Reviews in Plant Sciences, London, v.29, p.59-107, 2010. (1)
BRAIDO, R.; GONÇALVES-ZULIANI, A.M.O.; NOCCHI, P.T.R.; BELASQUE JUNIOR, J.; JANEIRO, V.;
BOCK, C.H., NUNES, W.M.C. A standard area diagram
set to aid estimation of the severity of Asiatic citrus canker on ripe sweet orange fruit. European Journal of Plant Pathology, Dordrecht, v.141, p.327–337, 2015. (1)
CAMPBELL, C.L.; MADDEN, L.V. Introduction to
plant disease epidemiology. New York: John Wiley, 1990. 532 p. (1)
CITADIN, I.; ASSMANN, A.P.; MAZARO, S.M.; GOUVEA, A.; DANNER, M.A.; MALAGI, G. Escala diagramática para avaliação da severidade de bacteriose em pessegueiro. Revista Brasileira Fruticultura, Jaboticabal, v.30, n.2, p.327-330, 2008. (1)
CORREIA, K.C.; QUEIROZ, J.V.J.; MARTINS, R.B.; NICOLI, A.; DEL PONTE, E.M.; MICHEREFF, S.J. Development and evaluation of a standard area diagram set for the severity of phomopsis leaf blight on eggplant.
European Journal of Plant Pathology, Dordrecht, v.149, p.269–276, 2017. (1)
CRUZ, C.D. Genes: a software package for analysis in experimental statistics and quantitative genetics. Acta Scientiarum: Agronomy,Maringá, v.35, n.3, p.271-276, 2013. (1)
DE BEM, B.P.; BOGO, A.; EVERHART, S.E.; CASA, R.T.; GONÇALVES, M.J.; MARCON FILHO, J.L.; RUFATO, L.; SILVA, F.N.; ALLEBRANDT, R.; CUNHA, I.C. Effect of four training systems on the temporal dynamics of downy mildew in two grapevine cultivars in southern Brazil. Tropical Plant Pathology,
Brasília, DF, v.41, n.6, p. 370–379, 2016. (1)
DE PAULA, P.V.A.A.; POZZA, E.A.; SANTOS, L.A.; CHAVES, E.; MACIEL, M.P.; PAULA, J.C.A. Diagrammatic scales for assessing brown eye spot (Cercospora coffeicola) in red and yellow coffee cherries.
Journal of Phytophatology, Utrecht, v.164, n.10, p.791-800, 2016. (1)
DUAN, J.; ZHAO, B.; WANG, Y.; YANG, W. Development
and validation of a standard area diagram set to aid estimation of bacterial spot severity on tomato leaves.
European Journal of Plant Pathology, Dordrecht,v.142, p.665–675, 2015. (1)
FALEIRO, F.G.; JUNQUEIRA, N.T.V.; BRAGA, M.F.; OLIVEIRA, E.J.; PEIXOTO, J.R.; COSTA,
A.M. Germoplasma e melhoramento genético do
maracujazeiro: histórico e perspectivas. Planaltina: Embrapa Cerrados, 2011. 36p. (2)
FISCHER, I.H.; ALVES, S.A.M.; ALMEIDA, A.M.; ARRUDA, M.C.; BERTANI, R.M.A.; GARCIA, M.J.M. Elaboração e validação de escala diagramática para
quantificação da severidade da antracnose em frutos
de maracujá amarelo. Summa Phytopathologica,
Piracicaba, v.35, n.3, p.226-228, 2009. (1)
FISCHER, I.H.; REZENDE, J.A.M. Diseases of passion
GONZÁLEZ-DOMÍNGUEZ, E.; MARTINS, R.B.; DEL
PONTE, E.M.; MICHEREFF, S.J.; GARCÍA-JIMÉNEZ,
J.; ARMENGOL, J. Development and validation of a standard area diagram set to aid assessment of severity of loquat scab on fruit. European Journal of Plant Pathology, Dordrecht, v.139, p.413-422, 2014. (1)
GYAWALI, S.; VERMA, R.P.S.; KUMAR, S.; BHARDWAJ, S.C.; GANGWAR, O.P.; SELVAKUMAR, R.; SHEKHAWAT, P.S.; REHMAN, S.;
SHARMA-POUDYAL, D. Seedling and adult-plant stage resistance of a world collection of barley genotypes to stripe rust.
Journal of Phytopathology, Berlin, v.166, n.1, p.18-27, 2018. (1)
HAU, B.; KRANZ, J.; KONIG, R. Fehler beim Schätzen
von Befallsstärken bei Pflanzenkrankheiten. Zeitschrift für Pflanzenkrankheiten und Pflanzenschutz, Stuttgart, v.96, p.649-674, 1989. (1)
ISHIDA, A. K. N.; HALFED-VIEIRA, B. A. Mancha-bacteriana do maracujazeiro (Xanthomonas axonopodis
pv. passiflorae): etiologia e estratégias de controle.Belém: Embrapa Amazônia Oriental, 2009. 23 p. (2)
JUNQUEIRA, N.T.V.; SUSSEL, A.A.B.; JUNQUEIRA, K.P.; ZACARONI, A.B.; BRAGA, M.F. Doenças. In: FALEIRO, F.G.; JUNQUEIRA, N.T.V. (Ed.). Maracujá: o produtor pergunta, a Embrapa responde. Brasília, DF: Embrapa Cerrados, 2016. p. 169-180. (Coleção 500 perguntas, 500 respostas). (2)
KRANZ, J. Measuring plant disease. In: KRANZ, J.; ROTEM, J. (Ed.). Experimental techniques in plant disease epidemiology. Heidelberg: Springer-Verlag, 1988. p. 35-50. (2)
KUDO, A.S.; PEIXOTO, J.R.; JUNQUEIRA, N.T.V.; BLUM, L.E.B. Suscetibilidade de genótipos de maracujazeiro-azedo à septoriose em casa de vegetação.
Revista Brasileira de Fruticultura, Jaboticabal, v.34, n.1, p.200-205, 2012. (1)
LAGE, C.A.C.; MAROUELLI, W.A.; DUARTE, H.S.S.; CAFÉ-FILHO, A.C. Standard area diagrams for
assessment of powdery mildew severity on tomato leaves
and leaflets. Crop Protection, London, v.67, p.26-34, 2015. (1)
LIMA, H.E.; NECHET, K.L.; HALFELD-VIEIRA, B.A.; OLIVEIRA, J.R.; DUARTE, H.S.S.; QUEIROZ, E.S.; OLIVEIRAM F.L. Elaboração e validação de escalas diagramáticas para avaliação da severidade da mancha-bacteriana do feijão-caupi em cultivares com trifólios morfologicamente distintos. Ciência Rural, Santa Maria, v.43, n.10, p.1735-1743, 2013. (1)
LIN, L.I. A concordance correlation coefficient to evaluate
reproducibility. Biometrics, Oxford, v.45, p.255–268, 1989. (1)
MARCUZZO, L.L; DUARTE, T.S.; ROSA NETO,
A.J.; HOFFMANN, F. Efeito de fosfito de potássio e de
fungicidas no controle da cercosporiose (Cercospora
beticola) da beterraba. Summa Phytopathologica, Piracicaba, v.42, n.2, p.186-187, 2016. (1)
NASCIMENTO, A.R.P.; MICHEREFF, S.J.; MARIANO, R.L.R.; GOMES, A.M.A. Elaboração e validação de escala diagramática para cancro bacteriano da videira. Summa Phytopathologica, Piracicaba, v.31, n.1, p.59-64, 2005.
(1)
NOGUEIRA, I. Caracterização agronômica e físico-química de progênies de maracujazeiro azedo (Passiflora edulis Sims) no Distrito Federal. 2016. 113 f. Dissertação (Mestrado em Agronomia) -Universidade de Brasília, Brasília, DF, 2016. (4)
NUÑEZ, A. M. P.; MONTEIRO, F. P.; PACHECO, L. P.; RODRÍGUEZ, G. A. A.; NOGUEIRA, C. C. A.; PINTO, F. A. M. F.; MEDEIROS, F. A. V.; SOUZA, J. T. Development and validation of a diagrammatic scale to assess the severity of black rot of crucifers in Kale.
Journal of Phytopathology, Berlin, v.165, n.3, p.195-203, 2017. (1)
NUTTER JR., F. W.; SCHULTZ, P. M. Improving the
accuracy and precision of disease assessment: selection of methods and use of computer-aided training programs.
Canadian Journal of Plant Pathology, v. 17, n. 2, p. 174-184, 1995. (1)
NUTTER, F.W.; WORAWITLIKIT, O. Disease.Pro: a
PEREIRA, A.B.; NOVA, N.A.V.; RAMOS, V.J.; PEREIRA, A.R. Potato potential yield based on climatic elements and cultivar characteristics. Bragantia, Campinas, v.67, n.2, p.327-334, 2008. (1)
PERUCH, L.A.M.; COLARICCIO, A.; SCHROEDER, A.L. Sintomas e controle das principais doenças do maracujazeiro (Passiflora edulis f. flavicarpa) em Santa Catarina. Agropecuária Catarinense, Florianópolis, v.24, n.2, p.42-45, 2011. (1)
SANTOS, P.H.D.; MUSSI-DIAS, V.; FREIRE, M.G.M.; CARVALHO, B.M.; SILVEIRA, S.F. Diagrammatic scale of severity for postharvest black rot (Ceratocystis paradoxa) in coconut palm fruits. Summa Phytopathologica, Botucatu, v.43, n.4, p.269-275, 2017. (1)
SCHNEIDER, C.A.; RASBAND, W.S.; ELICEIRI, K.W.
NIH Image to ImageJ: 25 years of image analysis. Nature Methods, New York, v.9, p.671-675, 2012. (1)
TOMERLIN, J.R.; HOWELL, T.A. Distrain: a computer
program for training people to estimate disease severity on cereal leaves. Plant Disease, Washington, v.72,
p.455-459, 1988. (1)
VENTURINI, M.T.; SANTOS, L.R.; OLIVEIRA, E.J. Development of a diagrammatic scale for the evaluation of postharvest physiological deterioration in cassava roots.
Pesquisa Agropecuária Brasileira, Brasília, DF, v.50, n.8, p.658-668, 2015. (1)
VIEIRA, R.A.; MESQUINI, R.M.; SILVA, C.N.; HATA, F.T.; TESSMANN, D.J.; SCAPIM, C.A. A new diagrammatic scale for the assessment of northern corn leaf blight. Crop Protection, London, v.56, p.55-57, 2014. (1)
VIANA, C.A.S.; PIRES, M.C.; PEIXOTO, J.R.; JUNQUEIRA, N.T.V.; BLUM, L.E.B. Genótipos de maracujazeiro-azedo com resistência à bacteriose.
Bioscience Journal, Uberlândia, v.30, Supl. 2, p.591-598, 2014. (1)
YADAV, N.V.; VOS, S.M.; BOCK, C.H.; WOOD, B.W.