Vol.52, n. 3: pp.523-530, May-June 2009
ISSN 1516-8913 Printed in Brazil BRAZILIAN ARCHIVES OF
BIOLOGY AND TECHNOLOGY A N I N T E R N A T I O N A L J O U R N A L
Genetic Parameter Estimates in Yellow Passion Fruit Based
on Design I
Gustavo Menezes Gonçalves
1*, Alexandre Pio Viana
1, Messias Gonzaga Pereira
1, Francisco
Valdevino Bezerra Neto
1, Antônio Teixeira do Amaral Júnior
1, Telma Nair Santana
Pereira
1and Tiago José Menezes Gonçalves
21Laboratório de Melhoramento Genético Vegetal; Universidade Estadual do Norte Fluminense; Av. Alberto Lamego, 2000; 28015-620; Campos dos Goytacazes - RJ - Brasil. 2Centro de Ciência e Tecnologia; Universidade Estadual do Norte Fluminense; Av. Alberto Lamego, 2000; 28015-620; Campos dos Goytacazes - RJ - Brasil
ABSTRACT
The aim of this work was to study the genetic parameters, to obtaine the progenies by crossings among the yellow passion fruits cultivars (Passiflora edulis f. flavicarpa), following the Design I. The results of the variance analysis demonstrated large variability to be exploited in the population. The trait number of fruit per plant presented the largest additive genetic variation coefficient, demonstrating that larger gains could be obtained for the trait. In terms of genetic action, number of fruits per plant, skin thickness and number of days by flowering have demonstrated to be characterized by the overdominance. Other important traits seem to have presented larger addictive effect than the dominance, as weight, length and width of fruits. The highest values of the coefficients of heritabilities were obtained for the males and the smallest for the females within males, and for the selection the coefficients should be used in the narrow sense.
Key words: Genetic gain, genetic components, nested design, Passiflora.
INTRODUCTION
Brazil is a large producer of yellow passion fruit with an increasing demand to the processed juice and “in natura” fruit markets. The main limiting factors in yellow passion fruit is the low yield caused by factors that include the lack of high yielding genotypes and the large variability of commercial orchards, which suggest the need for crop genetic improvement.
The improvement of yellow passion fruit is directly related to the fruit, which focus on three main points: improvement aiming to satisfy the
market exigencies (quality), increase of
As the yellow passion fruit is an allogamous plant, it is possible to apply several methods of improvement, either by increasing the frequency of favorable genes or by exploitation of the hybrid vigor (Bruckner, 1997). The frequency of favorable genes can be increased through either mass selection or selection with progeny test, whereas the hybrid vigor is exploited through the
hybrids, synthetic varieties or compounds
(Albuquerque, 2001).
by obtaining predicted genetic gains and preserving a suitable genetic base. The most important genetic parameters are the additive and
non-additive genetic variance components,
hereditability and correlations (Cruz and Carneiro, 2003).
According to Falconer (1987), additive genetic variance is the main cause of similarity among relatives. It is the main determinant of the genetic properties of a population and of the population response to selection.
Hanson (1963) stated that heritability could be defined as the fraction of the selection differential that could be used in a selection. It could be used in the broad or narrow sense.
Design I (Comstock and Robinson, 1948) has been used to estimate the components of genetic variance of a population (Hallauer and Miranda Filho, 1988; Cruz and Carneiro, 2003). The families in this design, frequently used in corn breeding (Hallauer and Miranda Filho, 1988; Eyerabide and Hallauer, 1991; Furtado, 1996) allow the adoption of different selection strategies, such as selection among the males, among females, among females within males and combined selection, when the assessment is made at plot mean or plot total levels. The plots are formed by a group of individuals that are samples of the descendents of a cross (Cruz and Carneiro, 2003).
The present study was carried out to estimate the genetic parameters of yield in a yellow passion fruit population.
MATERIAL AND METHODS
Plants sampled from 113 progenies derived from the crosses following the Design I of Comstock and Robinson (1948) were assessed in a commercial farming area in Campos dos Goytacazes, RJ from May to July 2002. This population consisted of the following materials of
yellow passion fruit (Passiflora edulis f.
flavicarpa): Maguary, Yellow Master and selections of São Francisco do Itabapoana, with inbreeding coefficient of F=0. For this, male donor plant was crossed with a group of five receptor plants (female) to obtain full sib and half
sib progenies. The experiments were performed in Viçosa, MG (20º45’S and 42º53W, altitude 648m, annual average temperature of 19.4ºC) and Miracema, RJ (21º25’S and 42º12’W, altitude
137m, annual average temperature of 23ºC), in
November 2002.
The final assessment was made in May 2004. A randomized complete block design with three replications and with each plot consisting of three plants was used. The progenies (treatments) were grouped into three sets: set 1 - progenies from 01 to 40; set 2 - progenies from 41 to 80 and set 3 - progenies from 81 to 113. Each set formed one treatment group.
The following plant traits were analyzed: a) number of fruit per plant - assessed by counting the number of fruit from the first flowering in each plot and dividing the result by the number of plants; b) fruit weight - the mean value obtained, in grams, by weighing samples of 25 fruits per plot; c) fruit length - mean value obtained in mm, by measuring the longitudinal dimension in samples of 25 fruits per plot; d) fruit width - mean value obtained in mm, by measuring the transversal dimension in samples of 25 fruits per plot; e) skin thickness - mean value obtained, in mm, by measuring the dimension of the skin in the mid-portion of the fruit (cut transversally) in samples of 25 fruits per plot; f) number of days to flowering - obtained by counting the number of days from planting in the field to the opening of the first flower in the plot; g) pulp percentage - mean value obtained, expressed as percentage of the fruit, by weighing the pulp (seeds, aril and juice) in samples of 25 fruits per plot.
The genetic statistical model shown in Table 1 (Furtado, 1996; Cruz and Carneiro, 2003) was used for the analyses of variance for each trait in individual environments. The model shown in Table 2 (Hallauer and Miranda Filho, 1988; Pereira and Amaral Júnior, 2001) was used for the joint analysis over the environments.
Table 1 - Statistical genetic models with their expected mean squares estimates and the F test used in the individual analysis.
SV1/ DF MS E(MS) F
S s-1
R/S s(r-1)
[P] [s(mf-1)] MS4 σ2 + rσ2P MS4/MS1
M/S s(m-1) MS3 σ2 + rσ2F + rfσ2M MS3/MS2
F/M/S sm(f-1) MS2 σ2 + rσ2F MS2/MS1
E s(r-1)(mf-1) MS1 σ2
T smfr-1
1/
S - sets; R - replications; P - progenies; M - males; F - females; E - error; T - total.
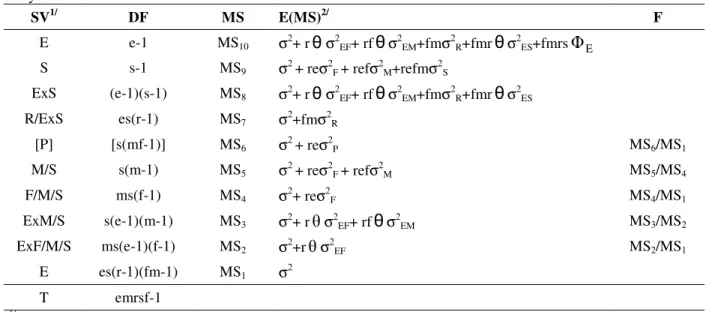
Table 2 - Statistical genetic models with their expected mean squares estimates and the F test used in the joint analysis.
SV1/ DF MS E(MS)2/ F
E e-1 MS10 σ2+ rθσ2EF+ rfθσ2EM+fmσ2R+fmrθσ2ES+fmrs
Φ
E S s-1 MS9 σ2 + reσ2F + refσ2M+refmσ2SExS (e-1)(s-1) MS8 σ2+ rθσ2EF+ rfθσ2EM+fmσ2R+fmrθσ2ES
R/ExS es(r-1) MS7 σ2+fmσ2R
[P] [s(mf-1)] MS6 σ2 + reσ2P MS6/MS1
M/S s(m-1) MS5 σ2 + reσ2F + refσ2M MS5/MS4
F/M/S ms(f-1) MS4 σ2+ reσ2F MS4/MS1
ExM/S s(e-1)(m-1) MS3 σ2+ rθσ2EF+ rfθσ2EM MS3/MS2
ExF/M/S ms(e-1)(f-1) MS2 σ2+rθσ2EF MS2/MS1
E es(r-1)(fm-1) MS1 σ2
T emrsf-1
1/
E – environments; S – sets; R – replications; P – progenies; M – males; F – females; E – error; T – total.
2/
1 e
e θ
−
= ;
1 -e
E Φ
2 i E
∑
=
The mean squares values obtained in the joint analysis of variance of the data from Viçosa and Miracema were used to estimate the components of variance associated to the genetic effects of the
statistical model, which are male effect (σˆ2M) and
female within male effect (
σ
ˆ
2F), by:ref MS MS
σˆ2M = 5 − 4 and
re MS MS
σˆ2 4 1
F
− =
FS and half sibs - HS) according to Furtado (1996) and Cruz and Carneiro (2003), given by:
2 F 2
M σ
σ
COV(FS)= + and COV(HS)=σ2M
By the principle of resemblance among relatives, the covariances between FS and HS can be expressed in terms of additive genetic variance
(σˆ2A) and dominance genetic variance (σˆ2D).
2 D 2 A σ 4 1 σ 2 1
COV(FS)= + and σ2A
4 1
COV(HS)=
The covariances among relatives can be equated with the components of genetic variance:
2 M 2
A 4σˆ
σˆ = and σˆ 4(σˆ σˆ2 )
M 2 F 2
D = −
Similarly, additive genetic variance x environment interaction and dominance genetic variance x environment interaction are expressed by:
2 EM 2
AE 4σˆ
σˆ = and σˆDE2 =4(σˆ2EF−σˆ2EM)
The following parameters can be estimated:
a) Average degree of dominance:
2 A 2 D/σˆ σˆ
2 = ADD
b) Additive genetic variance coefficient:
mˆ )/ σˆ (100 = Vˆ
C a 2A
c) Experimental coefficient of variation:
mˆ )/ QM (100 = Vˆ
C e 1
The broad and narrow senses heritabilities, at the plot mean level, for the joint analysis over environments were estimated for each one of the possible selection alternatives derived from Design I, as described by Furtado (1996) and Cruz and Carneiro (2003):
a) Broad and narrow sense heritabilities for selection based on the male means: selection is carried out between male family means. The
heritabilities in the broad (h2MB) and the narrow
sense (h2MN) are given by:
ref MS f σˆ σˆ h 5 2 F 2 M 2 MB +
= and
ref MS σˆ 4f 1 f h 5 2 A 2 MN + =
b) Broad and narrow sense heritabilities for selection based on the female means: selection was carried out among the female families means, regardless of the male to which they belong. The
heritability in the broad (h2FB) and narrow sense
(h2FN) are given by:
re MS σˆ σˆ 1 -mf 1) -f(m h 6 2 F 2 M 2 FB + = and re MS σˆ 4 1 1 -mf 1 -f -2mf h 6 2 A 2 FN × =
c) Broad and narrow sense heritabilities for selection based on the female within male means: stratified selection was carried out on families of females, where a number of families of each group of females was selected within each male. The
heritabilities in the broad (h2F/MB) and narrow
senses (h2F/MN) are given by:
re MS σˆ 4 1 σˆ 4 1 h 4 2 D 2 Α 2 F/MB +
= and
re MS σˆ 4 1 h 4 2 Α 2 F/MN =
RESULTS AND DISCUSSION
The results of the individual analysis of variance (Table 3) showed significant differences among the treatments (progenies) by the F test (P<0.05) for most studied traits, except pulp percentage in Viçosa and number of days to flowering in Miracema. The genetic variability among the progenies was evaluated as sufficient to allow a successful breeding program.
The progenies degrees of freedom were partitioned into male effects and female within the male effects, according to Design I of Comstock and Robinson (1948). These effects were significant according to the F test for most of the studied traits. In Viçosa, only the pulp percentage trait females within the males effect was not significant (P>0.05), indicating that selection would be effective only among the males for this trait. In Miracema, the number of fruits per plant and number of days to flowering were not significant
for either of the effects studied, except to
Table 3 - Analysis of variance of yield traits2/ in yellow passion fruit.
Mean Squares Environments SV1/ DF
NF FW FL FWI ST NDF PP
[P] 110 457.58** 1952.02** 104.65** 38.98** 3.32** 401.75** 69.51 M/S 20 768.80* 4718.57** 251.89** 87.95** 6.33** 867.75** 112.02* F/M/S 90 388.42** 1337.23** 71.93** 28.10** 2.66** 298.19** 60.06
CVe(%) 44.52 13.81 5.00 4.76 13.08 9.00 22.33
Viçosa
Mean 22.09 199.99 86.29 76.68 7.47 115.19 45.79
[P] 110 306.25* 1071.21** 65.98** 25.56** 1.21** 224.90 M/S 20 421.22 2277.75** 155.98** 47.03** 1.86* 255.61 F/M/S 90 280.71 803.09** 45.98** 20.79** 1.07** 218.07
CVe(%) 47.30 13.52 5.94 4.93 15.10 9.51
Miracema
Mean 32.30 170.37 86.21 74.02 5.39 138.87
[P] 110 504.13** 2330.71** 139.51** 47.53** 3.26** 408.09** M/S 20 851.08* 5958.12** 362.46** 113.18** 6.20** 830.44** F/M/S 90 427.03** 1524.62** 89.96** 32.94** 2.60** 314.24** ExM/S 20 316.98 969.67 43.75 19.92 1.87* 279.52 ExF/M/S 90 247.47** 588.05 27.87 15.58 1.07* 207.68** joint analysis
CVe 47.13 13.75 5.48 4.85 13.98 9.33
Mean 27.11 185.42 86.25 75.37 6.45 126.84
1/
P - progenies; S- sets; M - males; F - females; E - environments. 2/
NF - number of fruits per plant; FW - fruit weight, in grams; FL - fruit length in mm; FWI - fruit width in mm; ST – skin thickness in mm; NDF - number of days to flowering; PP - pulp percentage.
*,** Indicate significance at the 5% and 1% levels of probability by the F test, respectively. CVe(%) - experimental coefficient of variation.
The progenies effects in joint analysis were
significant at the 5% level of probability (F test) for all the traits. Similarly, the male effects and female within male effects were significant for all the studied traits. The genetic variance detected by the joint analysis corresponded to the mean variance in the various environments studied, subtracted from the interaction (Cruz et al., 2004). The results by comparison of average of two experiments, indicated that Miracema was more
flowering inducer, probably due climatic
conditions as temperature and luminosity.
Comparing the average of the two experiments, it was observed that the production in number of fruits per plant was notoriously higher in Miracema (32.30 fruits/plant) than in Viçosa (22.09 fruits/plant). However, the fruits from Viçosa had better quality - displaying highest
environment interaction and female within male x environment interaction for fruit weight, fruit length and width, also for the male x environment interaction for number of fruits per plant and number of days to flowering indicated a similar performance of these traits in both the environments studied. These data suggested that superior genotypes could be recommended
simultaneously for cropping in both the
environments.
The genetic parameters were estimated from the joint analysis of Viçosa and Miracema since the genotype x interaction was no significant for most of the traits. The pulp percentage trait was excluded from the analysis since it was not assessed in Miracema and was not significant in Viçosa.
the additive genetic variance (σˆ2A) for the number of fruits per plant, skin thickness and number of days to flowering, indicated by the larger than the unit average degree of dominance, therefore being also more affected by the environment.
These results suggested the presence of
overdominance in the control of these traits. According to Cruz and Carneiro (2003),
dominance genetic variance could be seen from two points of view: a) first, positively in relation to the chances of success of obtaining heterotic hybrids; b) second, as a disturbing factor in superior genotypes selection from segregant populations, where the gains in population breeding were based on the magnitude of the additive genetic variance.
Table 4 - Genetic parameter estimates for six traits assessed in yellow passion fruit progenies by joint environmental analysis
Genetic parameters2/ Traits1/
2 M
σˆ σˆ2F σˆ2A σˆ2D σˆ2AE σˆ2DE ADD CVˆa(%)
NF 14.39 43.96 57.56 118.29 9.43 46.71 2.03 27.99
FW 150.45 145.83 601.78 0.00 51.80 0.00 0.00 13.23
FL 9.25 11.27 36.99 8.11 2.16 1.55 0.66 7.05
FWI 2.72 3.27 10.89 2.18 0.59 0.91 0.63 4.38
ST 0.12 0.30 0.49 0.71 0.11 0.06 1.70 10.84
NDF 17.52 29.03 70.07 46.05 9.75 35.32 1.15 6.60
1/
NF - number of fruits per plant; FW - fruit weight, in grams; FL - fruit length in mm; FWI - fruit width in mm; ST – skin thickness in mm; NDF - number of days to flowering;
2/ 2
M
σˆ , 2
F
σˆ = estimates of the components of variance associated to genetic effects: male effect and female within male effect,
respectively. 2
A
σˆ e 2
D
σˆ = estimates of the components of variance genetic between individuals: additive genetic variance and genetic
variance due to deviations of dominance, respectively; 2
AE
σˆ e 2
DE
σˆ = estimates of variances: additive genetic X environments and due to deviations of dominance X environments,
respectively;
ADD e
C
V
ˆ
a= average degree of dominance and additive genetic variance coefficient, respectively.The degrees of dominance (ADD) lower than one was detected for fruit weight, fruit length and width, showing that the additive component had greater importance in the expression of these traits. The high magnitude of the additive genetic variance component suggested the covariance among the progenies and their respective relatives, thus it was determinant of the gain to be obtained by the selection.
The dominance variance component (σˆ2D) was
negative for fruit weight and considered null in this study. According to Hallauer and Miranda Filho (1988), as long as different females were crossed with the same male, as in Design I, these females could receive similar pollen grains, thus
the female within the male component (σˆ ) could 2F
be reduced in value, naturally underestimating the deviations of dominance. Further, Gouesnard and
Gallais (1992) reported that the mating system carried out in Design I tended to favor the homozygosis, thus resulting in the overestimation of the additive genetic variance at the cost of decreasing the dominance variance. The value of the female within male component can also be minimized by a higher residual mean square value,
or further by low precision in the σˆ2D estimates by
Design I.
The number of fruits per plant presented the highest coefficient of additive genetic variance
(
C
V
ˆ
a), 27.99%, indicating that expressive gainswhich were higher compared to the value obtained for other traits.
Most of the other traits showed moderate CVˆa
values, indicating that gains could also be obtained, but smaller than for number of fruits. According to Falconer (1987), in practice, the total variance could be divided into additive genetic variance, which was interesting for the breeding programs, and the remainder, which consisted of
non-additive genetic variances and the
environmental variance. Therefore, the coefficient of additive genetic variance is important and expresses the additive genetic standard deviation in percentage of the mean and is an indicator of the level of gain that can be obtained by selection for a given trait.
Table 5 shows the estimates of the heritability coefficients in the broad and the narrow senses, based on the means of the male families, female families and female within the male families.
Table 5 - Broad and narrow sense heritability coefficients based on means of male families, female families and female within male families, in the joint analysis.
Traits1/
(%)
h2 2/ NF FW FL FWI ST NDF
2 MB
h 80.82 89.56 93.94 88.22 86.90 83.13
2 MN
h 59.97 89.56 90.49 85.33 69.83 74.82
2 FB
h 68.85 76.11 86.87 74.42 76.69 67.53
2 FN
h 33.65 76.11 78.15 67.54 44.19 50.61
2 F/MB
h 61.77 59.21 75.19 59.52 68.80 55.43
2 F/MN
h 20.22 59.21 61.67 49.59 28.14 33.45
1/ NF - number of fruits per plant; FW - fruit weight, in grams; FL - fruit length in mm; FWI - fruit width in mm; ST – skin thickness in mm;
NDF - number of days to flowering.
2/ 2
MB
h and h2MN = broad and narrow senses heritabilities at the male family mean level, respectively.
h2FB and h2FN = broad and narrow sense heritabilities at female family mean level, respectively.
h2F/MB and h2F/MN = broad and narrow sense heritability at the female within male mean level, respectively.
Generally, the highest heritability coefficients were obtained for the male families, and the lowest for the females within the male families. It should be pointed out that the estimates of high heritability could occur for the traits with small additive genetic variance, as long as the environmental influence on the trait was small. The reverse is also true. In fact, this may have occurred for the number of fruits per plant, which presented one of the lowest heritability estimates although it had the highest coefficient of additive genetic variation. The presence of a large environmental component might have caused the low heritability estimate since the experiment presented a large coefficient of variation.
Viana et al. (2004), when starting a breeding program for the North and Northeast of Rio de
(92.10%) and variation index higher than one (2.93) for the number of fruits and high heritability for fruit length (82.84%), which indicated a situation favorable to the improvement of these traits in a joint analysis of Campos dos Goytacazes and Macaé environments. In the same
experiments, acidity and juice percentage
presented the lowest heritabilities among the traits, 19.07 and 0.00%, respectively.
RESUMO
Com o objetivo de se estimarem parâmetros genéticos, procedeu-se a obtenção de progênies por cruzamentos entre cultivares de maracujá
amarelo (Passiflora edulis f. flavicarpa) seguindo
o Delineamento I. Os resultados da análise de
variância demonstraram existir grande
variabilidade a ser explorada na população. Número médio de frutos expressou o maior
coeficiente de variação genético aditivo,
demonstrando que maiores ganhos podem ser obtidos para o caráter. Em termos de ação gênica, número de frutos por planta, espessura de casca e
número de dias para o florescimento
demonstraram ser caracterizadas por efeito sobredominante dos genes. Outras características importantes apresentaram efeito aditivo maior do que o dominante, como ocorreu com peso, comprimento e largura de frutos. Os valores dos coeficientes de herdabilidade mais elevados foram obtidos para famílias de machos e os menores para famílias de fêmeas dentro de machos, sendo que para fins de seleção devem ser utilizados os coeficientes no sentido restrito.
REFERENCES
Albuquerque, A. S. (2001), Seleção de genitores e híbridos em maracujazeiro (Passiflora edulis Sims). DSc. Thesis, (Genética e melhoramento de plantas), UFV, Viçosa.
Barbin, D. (1993), Componentes de variância: teoria e aplicações, 2 ed. Piracicaba: FEALQ.
Bruckner, C. H. (1997), Perspectivas do Melhoramento do Maracujazeiro. In: Manica, I. (ed.) Maracujá: temas selecionados, Porto Alegre: Cinco Continentes, p. 25-46.
Comstock, R. E.; Robinson, H. F. (1948), The components of genetic variance in populations of biparental progenies and their use in estimating the average degree of dominance. Biometrics, 4, 254-266. Cruz, C. D.; Regazzi, A. J.; Carneiro, P. C. S. (2004), Modelos biométricos aplicados ao melhoramento genético. 3ed, v.1, Viçosa: UFV.
Cruz, C. D.; Carneiro, P. C. S. (2003), Modelos biométricos aplicados ao melhoramento genético. v2, UFV, Viçosa.
Eyherabide, G. H.; Hallauer, A. R. (1991), Reciprocal full-sib recurrent selection in maize: direct and indirect responses. Crop Science, 31, 952-959. Falconer, D. S.; Mackay, T. F. (1996), Introduction to
quantitative genetics. Longman Group, England. Furtado, M. R. (1996), Alternativas de seleção no
delineamento I de Comstock e Robinson, em milho. DSc. Thesis, (Genética e melhoramento de plantas), UFV, Viçosa.
Gouesnard, B; Gallais, A. (1992), Genetic variance component estimation in a nested mating design with positive assortative mating, and application to maize. Crop Science, 32, 1127-1131.
Hallauer, A. R.; Miranda Filho, J. B. (1988), Quantitative genetics in maize breeding. 2ed, Iowa State University Press, Ames.
Hanson, W. D. (1963), Heritability. In: Hanson, W. D.; Robinson, H. F. (eds.) Statistical genetics and plant breeding. National Academy of Science - National Research Council, Washington, pp.125-139
IBGE, 2005. http://www.sidra.ibge.gov.br in 03/02/2005.
Pereira, M. G.; Amaral Júnior, A. T. (2001), Estimation of genetic components in popcorn based on the nested design. Crop Breeding and Applied Biotechnology, 1: (1), 3-10.
Viana, A. P.; Pereira, T. N. S.; Amaral Júnior, A. T.; Souza, M. M. de; Maldonado, J. F. M. (2004), Parâmetros genéticos em populações de maracujazeiro amarelo. Revista Ceres, 51: (297), 545-555.
![Table 3 - Analysis of variance of yield traits 2/ in yellow passion fruit. Mean Squares Environments SV 1/ DF NF FW FL FWI ST NDF PP [P] 110 457.58** 1952.02** 104.65** 38.98** 3.32** 401.75** 69.51 M/S 20 768.80* 4718.57** 251.89*](https://thumb-eu.123doks.com/thumbv2/123dok_br/15957180.682943/5.892.110.804.146.588/table-analysis-variance-traits-yellow-passion-squares-environments.webp)


