A critical evaluation of the effect of population size and phenotypic
measurement on QTL detection and localization using a large F2 murine
mapping population
Xinmin Li
1,3, Richard J Quigg
1,4, Jian Zhou
1, Shizhong Xu
2, Godfred Masinde
3, Subburaman Mohan
3and David J. Baylink
31
University of Chicago, Division of Biological Sciences, Functional Genomics Facility, Chicago, IL, USA.
2University of California, Department of Botany and Plant Sciences, Riverside, CA, USA.
3
JL Pettis VA Medical Center and Loma Linda University, Musculoskeletal Disease Center, Molecular
Genetics Division, Loma Linda, CA, USA.
4
University of Chicago, Department of Medicine, Section of Nephrology, Chicago, IL, USA.
Abstract
Population size and phenotypic measurement are two key factors determining the detection power of quantitative trait loci (QTL) mapping. We evaluated how these two controllable factors quantitatively affect the detection of QTL and their localization using a large F2 murine mapping population and found that three main points emerged from this study. One finding was that the sensitivity of QTL detection significantly decreased as the population size decreased. The decrease in the percentage logarithm of the odd score (LOD score, which is a statistical measure of the likeli-hood of two loci being lied near each other on a chromosome) can be estimated using the formula 1 - n/N, where n is the smaller and N the larger population size. This empirical formula has several practical implications in QTL map-ping. We also found that a population size of 300 seems to be a threshold for the detection of QTL and their localiza-tion, which challenges the small population sizes commonly-used in published studies, in excess of 60% of which cite population sizes <300. In addition, it seems that the precision of phenotypic measurement has a limited capacity to affect detection power, which means that quantitative traits that cannot be measured precisely can also be used in QTL mapping for the detection of major QTL.
Key words:QTL mapping, mice, detection power, population size, phenotypic measurement. Received: November 23, 2004; Accepted: May 31, 2005.
Introduction
Quantitative trait loci (QTL) mapping has become in-creasingly informative in genomic data integration (Fischer et al., 2003; Vittet al., 2004; Flintet al., 2005), but the number of QTL which can be detected and the precision with which they can be located on the chromosome remain two key issues facing this type of mapping (Churchill and Doerge, 1994; Dupuis and Siegmund, 1999; Lander and Kruglyak, 1995; Liu, 1997). Many factors affect both the number of QTL which can be detected and the precision with which they can be located. Some of these factors are often unknown at the start of a study and beyond experi-mental control, while other factors are known and control-lable. Among the controllable factors, population size, phenotypic measurement and marker density contribute to QTL detection and localization.
One of the most frequently asked questions when de-signing a mapping experiment is ‘What population size should be used?’,i.e., what is the statistical power needed to detect linkage given a certain population size and are N individuals enough to estimate the recombination fraction with a given precision. Theoretically, population size can be estimated based on the statistical power (g), hypothetical recombination fraction (q) and significance level being used (a). Several simulation experiments have been carried out to address the question of population size (Darvasiet al., 1993; Darvasi and Soller, 1997; Belknap, 1998) and formulae have been developed to calculate the population size required for the detection of QTL when assuming that the dominance and standardized allele effects are known (Solleret al., 1976; Lander and Botstein, 1989) but, in prac-tice, population sizes are still difficult to estimate without any assumption. Consequently, time and cost is generally used to determine the population size needed for QTL anal-ysis. We surveyed 71 F2-based murine mapping
experi-www.sbg.org.br
Send correspondence to Xinmin Li. University of Chicago, 5841 S Maryland Ave., 60637 Chicago, IL, USA. E-mail: [email protected].
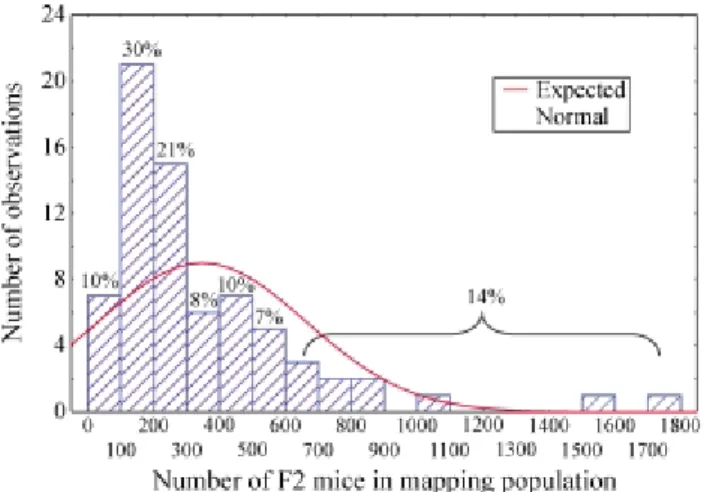
ments published during the past five years, of which 21 (30%) had a population size between 100 and 200 mice, 43 (61%) less than 300, 18 (25%) between 300 and 600, and only 10 (14%) more than 600 mice (Figure 1). This severely biased distribution toward small F2 populations strength-ens the need to practically evaluate the effect of population size on the detection and localization of QTL.
Another important factor for QTL mapping is the pre-cision of phenotypic measurement, because high measure-ment error will reduce the estimated heritability and decrease the detection power. Unfortunately, measurement error is normally mixed with other environmental residuals and cannot be separated from them using current statistical models, because of which we know very little about its ef-fect on the detection of QTL and it is difficult to evaluate the applicability of imprecisely measured quantitative traits to QTL mapping.
The role of marker density in QTL mapping has been widely investigated and several studies have shown that marker density is a function of detection power within a certain density range and has little effect beyond 10 centi-morgans (cM) (Darvasiet al., 1993; Piepho, 2000; Frischet al., 1999).
The objective of the study described in this paper was to use an empirical approach to evaluate the effect of popu-lation size and phenotypic measurement on the detection of QTL. We hypothesized that the effect of population size and the precision of phenotypic measurement on QTL de-tection and localization can be empirically studied by using a large and properly selected mapping population. We tested this hypothesis using an F2 mapping population which we had previously used for genetic dissection of wound healing in mice (Masindeet al., 2001). Our findings challenge the size of populations commonly used in pub-lished studies and provide an empirical guideline for the de-sign of future F2 mapping experiments.
Materials and methods
Experimental data
All the genotype data, phenotypic measurements and wound healing QTL data used in this study were derived from Masinde et al. (2001) who described a murine wound-healing trait mapping experiment using a mapping population of 633 (MRL/MpJ X SJL/J) F2 female mice genotyped with 119 polymorphic markers. The wound-healing phenotype was defined by punching a 2 mm diame-ter hole in the soft exdiame-ternal tissue of one ear and measuring the diameter of the hole after 21 days, the average value be-ing 0.69 ± 0.05 mm.
Four previously identified soft tissue heal (Sth) QTL were selected for this study: Sth1 (LOD sore = 6.8) respon-sible for 5.6% of the phenotypic variation and Sth5 (LOD sore = 4.5) responsible for 4% of the phenotypic variation, representing medium-sized QTL; Sth9 (LOD sore = 15.6) responsible for 13% of the phenotypic variation, represent-ing a large QTL; and Sth10 (LOD sore = 3) responsible for 2.6% of the phenotypic variation, representing a small pre-sumptive QTL.
Data sampling
From the original data set of 633 female mice (geno-type file and corresponding pheno(geno-type file), five data sub-sets of 500, 400, 300, 200 and 100 mice were randomly generated using a computer-assisted selection procedure. Each data sub-set included thirty replicates. For example, to generate a data sub-set of 500 animals, we randomly se-lected 500 mice from the original 633 mice and created new genotype and phenotype files corresponding to the 500 ran-domly selected mice, this random selection procedure be-ing repeated 30 times to generate 30 genotype/phenotype files with each set of files corresponding to a different group of 500 mice. This procedure was repeated for data sub-sets of 400, 300, 200 and 100 mice randomly selected from the original 633 mice, 30 genotype/phenotype files being generated for each data sub-set as described in the previous sentence. Each set of data (a unique genotype file, unique phenotype file and the original linkage map file) was then applied to interval mapping using the MAPQTL (4.0) software (Wageningen, the Netherlands). The total of 150 QTL analyses were performed for the 5 sub-data sets (30 replicates X 5 sub-data sets).
Corruption of phenotypic measurement data
The original ear-hole measurement data were cor-rupted by adding to, or subtracting from, the phenotypic measurement 1, 2, 3, 4, 5, 6, 7 or 8 standard deviations (SD), previously determined to be 0.05 mm (Li et al., 2001). To decide the direction of data corruption we ran-domly allocated either a 1 or a 0 to each of the 633 ear mea-surement data points from the F2 mice. If the randomly allocated number corresponding to data point X was a 1
then the original measurement X would become X plus one standard deviation, or X plus two standard deviations etc., continuing up to X plus eight standard deviations, but if the randomly allocated number was 0 then the original mea-surement X would become X minus one standard deviation, or X minus two standard deviations, etc., continuing up to X minus eight standard deviations. In other words, eight ar-tificial data sets were generated, the first by corrupting the original data set by one standard deviation, the second by corrupting the original data set by two standard deviations and so on up to eight standard deviations. The entire pro-cess from the random allocation of 1’s or 0’s to the produc-tion of the eight artificial data sets was repeated 30 times, generating a total of 240 artificial data sets consisting of 30 replicates for each of eight data sets. Each data set had a unique phenotype file with corrupted data and an original genotype and linkage map which were then applied to QTL mapping. We performed 240 QTL analyses using the cor-rupted data sets.
QTL mapping
Interval mapping was performed to detect any signifi-cant association between ear wound healing and marker loci in the F2 sub-data sets (different population size) and artificial data sets (corrupted phenotypic data) using the MapQTL software version 4 (Wageningen, the Nether-lands). The critical threshold values for significance of as-sociation were determined by the permutation test (Churchill and Doerge 1994; Van Ooijen 1999) to be a LOD score of³3.5 for significant linkage and³2.7 for sug-gestive linkage.
Data analysis
Computations were performed using the Statistca 5.1 (StatSoft Inc., Tulsa, OK) statistical package. The estima-tion of genetic variance used the difference between vari-ances of different populations method in which the F1, P1 and P2populations are non-segregating populations whose variances (VF1, VP1 and VP2) are purely due to
environmen-tal factors, while the F2 population is a segregating popula-tion whose variance (VF2) is determined by the sum of the
genotypic and environmental effects. Therefore, VF2 -(½V + ¼V + ¼V )F1 P1 P2 is an estimate of the
geno-typic variance. The broad-sense heritability is then esti-mated from:
$
H V (½V + ¼V + ¼V ) V
2 F F P P
F
2 1 1 2
2
=
-The average variance from 30 randomly generated data sets (as described above) was used to estimate herita-bility. The coefficient of variation (CV = SD/Mean) was used to evaluate variation of peak LOD score and map posi-tion over 30 replicates.
Results
Effect of population size on QTL detection and localization
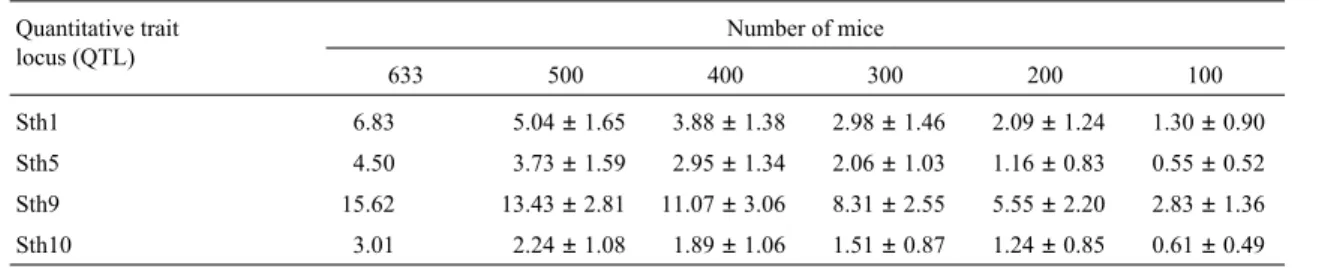
We found that the LOD scores decreased dramati-cally as the population size decreased (Figure 2). When the population size was reduced to 100 none of the four QTL were significant and when the population size was 300 only the large Sth9 QTL was significant (Table 1). The percent-age decrease in the LOD score is a function of the popula-tion size and can be approximately expressed as 1 - n/N, where N is the larger and n is the smaller population size. A comparison of the average percentages of decrease in the LOD score with the decrease of the LOD score predicted from the formula (1 - n/N) showed no significant difference between the two data sets (t = -0.13, p = 0.899). This empir-ically derived formula can be proved theoretempir-ically since the expected LOD score can be approximated by LODn= 0.217nsx
2
a2/se2
and LODN= 0.217Nsx 2
a2/se2
for population sizes n and N, respectively, wheresx2
is the vari-ance of the genotypic indicator variable,ais the additive genetic effect andse2
is the residual variance. The percent-age of LOD score reduction is defined as
LOD LOD LOD LOD LOD n N N n N n N
-=1- = -1
Thus, this ‘empirical formula’ is applicable to F2-design mapping experiments in general. Using this formula the QTL LOD scores for the same phenotype but derived from different population sizes can be converted into an ex-pected LOD score for a fixed population size. In addition, a minimum population size required for a LOD score of 3.5 (the significance threshold) for a particular QTL can be pre-dicted based on the known population size and the LOD score for that QTL (Table 2).
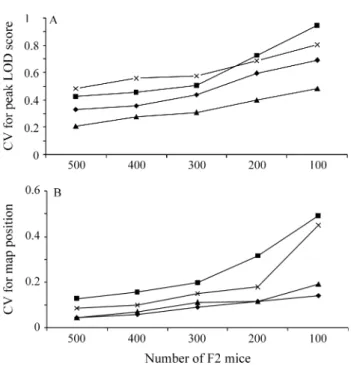
The variation in the peak LOD score over 30 repli-cates increased with decreasing population size (Figure 3A), the effect being much more pronounced for a popula-tion size of less than 300 than it was for a populapopula-tion size of from 500 to 300. Smaller QTL generally have a greater variation in peak LOD score. Variation in peak position over 30 replicates shared a similar trend with that of the peak LOD score, though smaller in magnitude (Figure 3B).
Effect of phenotypic measurement on QTL detection and localization
the number of standard deviations from the original pheno-typic data increased small QTL became insignificant while the medium-sized QTL (Sth1) remained significant up to six standard deviations (h2 = 42%) and the largest QTL
(Sth9) remained significant up to eight standard deviations (h2= 29%).
The decrease in peak LOD score was linearly related to the deviation of the phenotypic measurement, which can
Figure 2- Logarithm of the odd (LOD) score plots for four quantitative traits with different population sizes. Each individual quantitative trait loci (QTL) picture was the average LOD score plots of 30 replicates for each of the five different population sizes. For comparison the plot for each of the QTL from the original data set (blue line) is also included. Horizontal dashed lines indicate significant LOD thresholds and dotted lines presumptive LOD thresh-olds.
Table 1- How the average peak logarithm of the odd (LOD) score decreases with decreasing population sizea
Quantitative trait locus (QTL)
Number of mice
633 500 400 300 200 100
Sth1 6.83 5.04±1.65 3.88±1.38 2.98±1.46 2.09±1.24 1.30±0.90
Sth5 4.50 3.73±1.59 2.95±1.34 2.06±1.03 1.16±0.83 0.55±0.52
Sth9 15.62 13.43±2.81 11.07±3.06 8.31±2.55 5.55±2.20 2.83±1.36
Sth10 3.01 2.24±1.08 1.89±1.06 1.51±0.87 1.24±0.85 0.61±0.49
aData are expressed as means ± standard deviation (SD, n = 30). The threshold LOD score for significance was³3.5.
Table 2- Comparison of the logarithm of the odd (LOD) scores for a population size of 500 with the LOD score converted to 500 from different sample sizes using the empirical formula 1 - n/N, where n is the smaller and N the larger population size.
Quantitative trait locus (QTL)
LOD Score for 500 mice
Converted LOD score for this number of mice Number of micebrequired for a LOD score of 3.5
100 200 300 400 633
Sth1 5.0 6.5 5.2 5.0 4.9 5.4 350
Sth5 3.7 2.8 2.9 3.4 3.7 3.6 473
Sth9 13.4 14.1 13.9 13.9 13.8 12.3 130
Sth10 2.2 3.1 3.1 2.5 2.4 2.4 795
Averagea 6.1 6.6 6.3 6.2 6.2 5.9 437
aNo significant difference between any two of the average LOD scores by t-test.
be expressed as y = 0.0857*x – 0.0608, R2= 0.9962, where x is standard deviation and y is the percentage decrease in LOD score compared to the original data (Figure 5). This formula gave a decrease in LOD score of about 8.6% for each increase of one standard deviation (slope = 0.086). Concomitant with the decrease in LOD score, variation of the peak LOD score (CV) linearly increased as the error in phenotypic measurement was increased (Figure 6A). A nonlinear and small increase was also observed for the vari-ation in chromosomal locvari-ation (Figure 6B).
Comparison of the effect of population size with that of phenotypic measurement on QTL detection and localiza-tion
Our analysis shows that decreased population size had a much greater effect on the peak LOD score than in-creasing the number of standard deviations by which the data was corrupted (Figure 7). Corrupting the original phe-notypic value by three standard deviations was equivalent to reducing the population size from 633 to 500, while six-and-a-half standard deviations was equivalent to reduc-ing the population to 300. On average, decreasreduc-ing the popu-lation by 50 mice had a similar effect on the LOD score as corrupting the phenotypic measurement by one standard deviation. In addition, the effect of phenotypic deviation on the variation of peak LOD score and QTL position over replicates was significantly smaller than that of reducing the population size (Figures 3 and 6).
Discussion
The purpose of this study was to provide a practical appraisal of the effect of population size and phenotypic measurement on QTL detection and localization and to pro-vide an empirical guideline for future experimental design and data interpretation. Several interesting points emerged from this study that are worthy of discussion.
The mapping population used for such a study is a critical issue. We chose the (MRL/MpJ X SJL/J) F2 map-ping population for several reasons: 1) the large population size of 633 F2 mice which is within the top 14% population size surveyed in the literature; 2) high marker density (119) which is almost saturated in this experiment. Further in-crease has little effect on the power of QTL detection (Piepho, 2000); 3) precise phenotypic measurement which has a coefficient of variation of 2.4% when the average hole size is 1.4 mm in diameter and 4.6% when the average size is 0.96 mm in diameter (Liet al., 2001); and 4) wound heal-ing is a typical quantitative trait controlled by multiple genes with complex gene-gene interactions (Masindeet al., 2001). These features have made it a feasible population to evaluate the effect of sample size and phenotypic measure-ment on QTL detection and localization.
Figure 3- Increase of variation in peak logarithm of the odd (LOD) score and quantitative trait loci (QTL) map position between replicates with a decrease in population size. (A) peak LOD score; (B) QTL map position. QTL map position refers to the map position corresponding to the peak LOD score. Variation is expressed as coefficient of variation (CV).
Table 3- How the average peak logarithm of the odd (LOD) score decreases as the number of standard deviations (SD) used to corrupt the data increases. The original 21-day ear-hole measurement data were corrupted by adding to, or subtracting from, the phenotypic measurement 1, 2, 3, 4, 5, 6, 7 or 8 standard deviations (SD), previously determined to be 0.05 mm for a mean of 0.69 mm. (Liet al., 2001).
Uncorrupted data for 633 mice
Number of standard deviations (SD) used to corrupt the data
±1SD (7.2%)a ±2SD (14.5%)a ±3SD (22%)a ±4SD (29%)a ±5SD (36%)a ±6SD (43%)a ±7SD (51%)a ±8SD (58%)a Quantitative trait
locus (QTL)
LOD score LOD scoreb
Sth1 6.83 6.60±0.30 6.12±0.54 5.48±0.72 4.80±0.84 4.14±0.90 3.55±0.92 3.05±0.92 2.62±0.89
Sth5 4.50 4.40±0.26 4.12±0.48 3.74±0.63 3.31±0.72 2.90±0.77 2.52±0.77 2.19±0.76 1.91±0.73
Sth9 15.62 15.1±0.55 13.9±1.02 12.4±1.35 10.8±1.56 9.30±1.66 7.93±1.69 6.77±1.68 5.79±1.63 Sth10 3.01 3.02±0.24 2.89±0.45 2.68±0.61 2.43±0.72 2.17±0.78 1.93±0.81 1.71±0.81 1.53±0.80
a
Percentage deviation from the uncorrupted data for 633 mice.
Population size has a profound effect on the sensitiv-ity of QTL detection and precision of QTL localization. Re-duction in size is linearly associated with decreased LOD score. The percentage decrease can be empirically
calcu-lated from the expression: 1 - n/N. This empirical formula was derived from the reduction of population size from 633®500®400®300®200®100. This range of size covers 77% of the mouse mapping experiments surveyed in this study. Because the LOD score is a function of popula-tion size, the tradipopula-tional LOD score significance threshold (3.5) may be too high for small population. In such popula-tions, medium-sized QTL could not reach the defined threshold of 3.5, resulting in an increased Type II error (not detecting a QTL when there is one). This has clearly been demonstrated in this study: none of the three highly signifi-cant QTL could be declared as signifisignifi-cant at the LOD score of 3.5 when the population size was reduced from 633 to 100. A population size of 300 appears to be a turning point for sensitive and reliable detection of QTL (F2 design). Be-yond this point, the medium effect QTL (Sth1) could not be detected and variation in QTL peak and map position was drastically increased. This empirical ‘threshold’ is much higher than theoretically calculated (Liu, 1997). This find-ing suggests that current mappfind-ing population sizes, which are driven by time and cost (over 60% of F2 mapping ex-periments used less than 300 mice in literature), seem to be
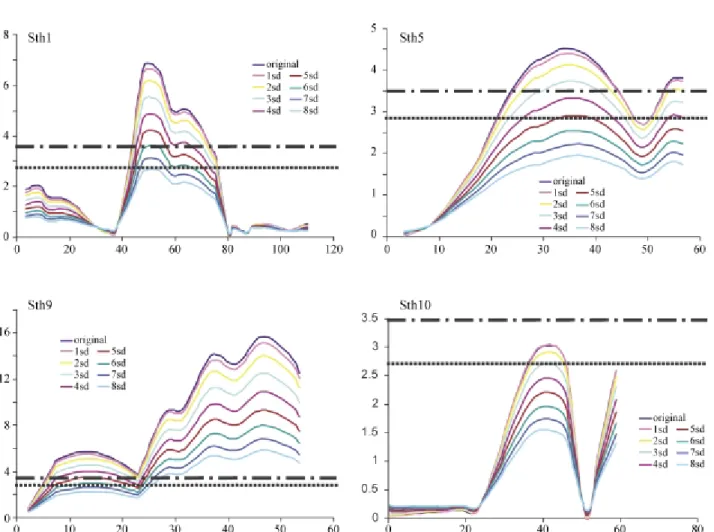
Figure 4- Logarithm of the odd (LOD) score plots as error was systematically introduced into phenotypic measurement. Each individual quantitative trait loci (QTL) picture was the average LOD score plots of 30 replicates for each of the 8 data sets. For comparison the plot for each of the QTL from the origi-nal data set (blue line) is also included. Horizontal dashed lines indicate significant LOD thresholds and dotted lines presumptive LOD thresholds.
too small to be able to reliably detect even a medium-sized QTL.
Based on the quantitative relationship between LOD score and population size we established an empirical for-mula (1 - n/N, where N is the larger and n the smaller sam-ple size) which predicts the percentage samsam-ple-size dependent LOD score decrease. Because this empirical for-mula can be derived theoretically it should be generally ap-plicable to other F2-design mapping studies. This formula can be used to estimate the expected LOD score for a
spe-cific population size (e.g. 500), which means that it can make the LOD scores of the QTL for the same phenotype comparable between different mouse mapping experiments and can also estimate the LOD score using a reasonable population size if there is a practical limitation in setting up a large mapping population, this attribute being particularly useful for mapping studies that are used for initial screening or for confirmation of previous studies.
Previously, it was not known how phenotypic mea-surement affects detection power and to address this ques-tion we conducted the study described in this paper in which we generated 8 artificial data sets by adding a con-stant level of noise to the original phenotypic data set (note that we did not simulate natural noise, a random event). We were rather surprised to find that the detection of QTL is highly tolerant of variation (or errors) in the phenotypic measurement. Increased phenotypic measurement error will lead to a decrease in heritability thereby affecting the power to detect QTL. For the data set analyzed in this study the average ear hole size (a phenotypic measurement) of 633 F2 mice at day 21 was 0.69 ± 0.05 mm, three standard deviations (± 0.15 mm) being equivalent to a 22% (0.15/0.69 = 0.22) deviation from the original measure-ments. This artificial noise reduced the heritability from 89% to 74% but did not significantly affect the four QTL measured. This observation suggests that there is a limited loss of detection power when measurement error increases within a certain heritability range which, in this study, was between 70% and 90%. Identification of the medium sized QTL (Sth1) when the data was corrupted by six standard deviations (a 43% deviation from the original data, heri-tability reduced to 42%) and the large QTL (Sth9) when the data was corrupted by eight standard deviations (a 58% de-viation from the original data, heritability reduced to 29%) further suggests that virtually all quantitative traits can be applied to genetic mapping for identification of major quantitative trait loci, including those that are difficult to measure precisely and have low heritability.
We estimated that, in terms of QTL detection, the ef-fect of reducing the population size by 50 mice is equiva-lent to a variation in phenotypic measurement of one standard deviation (i.e. 7.2% deviation from the original phenotypic value). If this empirical relationship can be ex-trapolated to other mapping populations, it can provide a convenient guide to select a cost- and time-effective com-promise between increasing the F2 population size and im-proving the precision of quantitative trait measurement.
It should be noted that the empirical relationships re-ported here were established through one specific experi-ment (Masindeet al. 2001), which involves a particular genetic architecture governing the phenotypy of interest. Robustness of these relationships across different genetic architecture deserves further evaluation. Thus, extrapola-tion of these empirical relaextrapola-tionships to other mapping pop-ulations should be made with caution. Nevertheless, this
Figure 6- Effect of variation in phenotype on peak logarithm of the odd (LOD) score and quantitative trait loci (QTL) map position. (A) peak LOD score; (B) QTL map position. Standard deviation (x-axis) shows the amount of error introduced into the measurement.
report represents the first attempt to use a real mapping ex-periment to quantitatively evaluate the effect of sample size and phenotypic measurement on major quantitative trait loci mapping efficiency. Our results could serve as a guide to design QTL mapping experiments and aid in the inter-pretation of results.
Acknowledgments
This work was supported by Assistance Award n. DAMD17-99-1-9571. The U.S. Army Medical Research Acquisition Activity, 820 Chandler Street, Fort Detrick MD 21702-5014, is the awarding and administering acqui-sition office. The information contained in this publication does not necessarily reflect the position or the policy of the Government of the United States and no official endorse-ment should be inferred. The authors would like to thank Heather Davidson for her excellent technical support.
References
Belknap JK (1998) Effect of within-strain sample size on QTL de-tection and mapping using recombinant inbred mouse strains. Behav Genet 28:29-38.
Churchill GA and Doerge RW (1994) Empirical threshold values for quantitative trait mapping. Genetics 138:963-971.
Darvasi A and Soller M (1997) A simple method to calculate re-solving power and confidence interval of QTL map location. Behav Genet 27:125-132.
Darvasi A, Weinreb A, Minke V, Weller JL and Soller M (1993) Detecting marker-QTL linkage and estimating QTL gene ef-fect and map location using a saturated genetic map. Genet-ics 134:943-951.
Dupuis J and Siegmund D (1999) Statistical methods for mapping quantitative loci from a dense set of markers. Genetics 151:373-386.
Frisch M, Bohn M and Melchinger AE (1999) Minimum sample size and optimal positioning of flanking markers in
marker-assisted backcrossing for transfer of a target gene. Crop Sci-ence 39:967-975.
Fischer G, Ibrahim SM, Brockmann GA, Pahnke J, Bartocci E, Thiesen HJ, Serrano-Fernandez P and Moller S (2003) Expressionview: Visualization of quantitative trait loci and gene-expression data in Ensembl. Genome Biol 4:R77. Flint J, Valdar W, Shifman S and Mott R (2005) Strategies for
mapping and cloning quantitative trait genes in rodents. Nat Rev Genet 6:271-86.
Lander E and Kruglyak L (1995) Genetics dissection of complex traits: Guidelines for interpreting and reporting linkage re-sults. Nat Genet 11:241-247.
Lander ES and Botstein D (1989) Mapping mendelian factors un-derlying quantitative traits using RFLP linkage maps. Ge-netics 121:185-199.
Li X, Gu W, Masinde G, Hamilton-Ulland M, Xu S, Mohan S and Baylink D (2001) Genetic control of the rate of wound heal-ing in mice. Heredity 86:668-674.
Liu BH (1997) Statistical Genomics: Linkage, Mapping and QTL Analysis. CRC Press, Florida, pp 375.
Masinde G, Li X, Gu W, Heather D, Mohan S and Baylink DJ (2001) Identification of wound healing/regeneration QTLs at multiple time points that explain seventy percent of vari-ance in (MRL/MpJ X SJL/J) F2 population. Genome
Re-search 11:2027-2033.
Piepho HP (2000) Optimal marker density for interval mapping in a backcross population. Heredity 84:437-440.
Soller M, Genizi A and Brody T (1976) On the power of experi-mental designs for the detection of linkage between marker loci and quantitative loci in crosses between inbred lines. Theor Appl Genet 47:35-39.
Van Ooijen JW (1999) LOD significance thresholds for QTL analysis in experimental populations of diploid species. He-redity 83:613-624.
Vitt U, Gietzen D, Stevens K, Wingrove J, Becha S, Bulloch S, Burrill J, Chawla N, Chien J, Crawford M, Ison C, Kearney L, Kwong M, Park J, Policky J, Weiler M, White R, Xu Y, Daniels S, Jacob H, Jensen-Seaman MI, Lazar J, Stuve L and Schmidt J (2004) Identification of candidate disease genes by EST alignments, synteny, and expression and verification of Ensembl genes on rat chromosome 1q43-54. Genome Res14:640-50.