Braz. Arch. Biol. Technol. v.61, no.spe: e18000180 2018
Smart Energy
Vol.61, no.spe: e18000180, 2018
http://dx.doi.org/10.1590/1678-4324-smart-2018000180 ISSN 1678-4324 Online Edition
BRAZILIAN ARCHIVES OF BIOLOGY AND TECHNOLOGY
A N I N T E R N A T I O N A L J O U R N A L
Technical Losses Reduction in Underground Reticulated
Distribution Systems using Artificial Neural Networks and
Smart Grid Features
Mario Sergio Cambraia
1,2, Augusto Ferreira Brandão Júnior
2, Luiz Henrique Leite Rosa
1 1Instituto Federal de São Paulo, São Paulo, São Paulo, Brasil; 2Escola Politécnica da Universidade de São Paulo,São Paulo, São Paulo, Brasil
ABSTRACT
This work presents the methodology, development and testing of an autonomous system, based on Artificial Neural Networks (ANN), for the reduction of technical losses in reticulated underground systems through the optimal control of the capacitor banks (CBs) present in the grid. The proposed methodology includes Smart Grid features, including practical solutions for current transformers positioning in underground networks, collecting field measurements for the Distribution Operation Centre (DOC) and real-time control of field equipment (capacitors banks). The steps of the proposed methodology and the main aspects of the development of the system are also described, as well as the tests performed to prove the results and validate the system.
Key words: smart grids, artificial neural networks, underground reticulated networks, technical losses.
Author of correspondence: [email protected]
INTRODUCTION
Dedicated Underground Reticulated Distribution Systems (URDS) also known as Spot Networks are widely used and provide very high reliability in power supply [1]. These systems are made up of two or more exclusive secondary feeders protected by the network protector, which are connected to the central bus of a single consumer. The use of underground networks in power distribution networks increases the reliability of the system. However, the insertion of new equipment, not provided in the original design, such as sensors, measuring equipment, communication equipment, capacitor banks and others, is difficult, due to the restricted space.
Figure 1 shows consumer cabins powered by 2, 3, and 4 feeders with network protector (NP), which does not allow the reverse power flow from reticulated side (consumers) to the utility side (STD).
Figure 1 - Illustrative of the reticulated underground network
In Brazil, the placement of capacitor banks (CBs) used to reactive power compensation in underground distribution networks became an additional problem mainly after regulatory resolution of the National Electric Energy Agency (ANEEL) Nº 569 of 7/23/2013 [02] that exempts consumers of group B (low voltage consumers) from the billing of reactive surplus due to the low Power Factor (PF) and also amends the ANEEL normative resolution Nº 414 of 09 / 09/2010 - Conditions for the Supply of Electric Energy [3], which in Article 76 indicates the billing of reactive energy for group B as optional for the distribution company.
With this change, low voltage consumers no longer need to correct their reactive energy, which was done to large and medium consumers, and already begins to cause an increase in energy losses in distribution networks. The situation in the underground distribution networks tends to be more critical due to the lack of space for the installation of CBs.
However, in order to achieve the desired goals of reducing technical losses and maintaining system voltage levels, instead of simply installing CBs, correcting the PF at the network point is not enough, but the implementation of the Volt-VAr control systems, an automation systems used in Smart Grids to control the reactive flow and voltage levels in the network is necessary, according to works presented in [04] and [05].
Technical losses reduction using artificial neural networks
Braz. Arch. Biol. Technol. v.61, no.spe: e18000180 2018
3
centers. Thus, in order to make possible the development of the proposed methodology possible, a specific area of the utility network was chosen, where a communication network was implemented between the underground transformers and the Distribution Operation Centre as shown in figure 2.
Figure 2 - Communication of the operations center with the mesh network
The intelligent electronic device (IED) SEL-2411 is currently responsible for the basic automation functions and shall be used for CBs control and to receive measurements / data from current transformers (CTs) installed at specific points.
The automation uses the radio frequency (RF) technology in the free 900 MHz band with the Mesh routing feature, which has distributed intelligence, auto-regenerative for the routes and optimization actions for the treatment of events in the transported data packets. These data, after traveling through the RF networks, enter a digital channel located in the substations and physically connected to the DOC.
The following sections describe in detail the methods and procedures used in the research and development of the proposed system, as well as the results achieved
through simulations.
OBJECTIVES
This work aims to present the methodology for the development of an automation system that aims to reduce energy losses in URDS by means of the systemic control of the reactive energy flow in the distribution lines, using Artificial Intelligence through ANN and the concepts of Smart Grid in the communication of TCs with DOC.
METHODS
simulator called SINAPgrid [06] was used, which enables the integrated analysis of high, medium and low voltage networks and has a module for technical losses calculation in the network. For the case study, the local distribution company provided all the necessary data of the URDS that were inserted in the simulator.
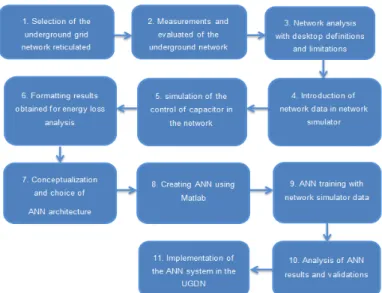
Figure 3 shows the flowchart of the methodology used, illustrating the main steps taken to solve the assumptions.
Figure 3 - Flowchart of the methodology used.
Definition and Analysis of the Pilot Area
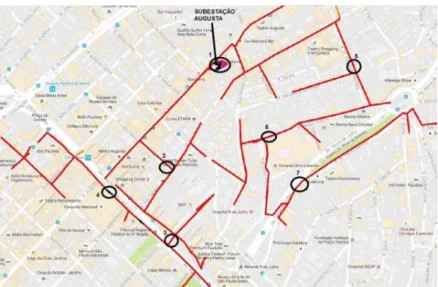
After a viability analysis, the Augusta / Paulista Substation was selected for the studies, a site that has an ideal grid distribution network for the methodology of this work, since the underground distribution network of the city of São Paulo is very complex and extensive, with several configurations and topologies.
Figure 4 shows the electrical network of the study area superimposed on the map of the region of Augusta / Paulista highlighting the location of the Substation.
Figure 4 - Region of Augusta substation with the groupings of the mini-reticulated
Technical losses reduction using artificial neural networks
Braz. Arch. Biol. Technol. v.61, no.spe: e18000180 2018
5
defined within the Augusta region, with 4 current measurements per point of measurement in a total of 7 and 1 in the output of the Substation which has 12 readings of current, totaling 36 currents readings.
Simulation Analysis
The network simulator calculated and provided the results of the power losses in the distribution lines of each test. Each test simulates the input / output of the 12 CBs in the network and all possible combinations for each interval of one hour. For ANN training, 10 trials were selected in each interval that obtained the lowest energy losses, that is, at each hour interval the results of the 10 tests with the most efficient CB configuration were recorded during the whole day and for all days of the week. For these studies, the months of December 2015 (summer) and July 2016 (winter) were used. The purpose of these simulations is to calculate the network technical losses value for all possible capacitor combinations for each hour of the day. The results were prepared and ordered for use in the ANN training stage.
Artificial Neural Networks Training
The data of the 36 currents were used as ANN input data and the CB positions (on or off) considered as ANN outputs.
Having an input data containing variations of 36 current measurements and an output containing variations of the 12 CBs, ANN training can be started, and with the "weights" it will find for the 3360 variations, it can deduce any of the 12 maneuvers of the CBs. The choice of the 10 best results from each time interval (Ex 1 to 2 h, 2 to 3 h) brought greater precision in the results in ANN execution.
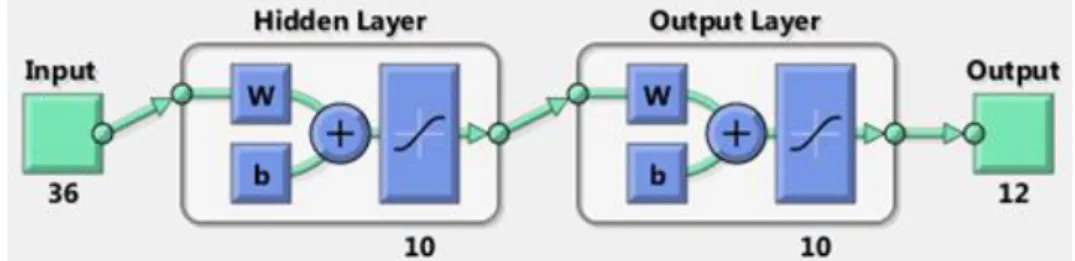
The creation of ANN was done through ToolBoxs of MatLab's advanced calculations program, based on the "Input" and "Output" spreadsheets created in the topic "Data collection", Figure 5 presents an image of the ANN creation screen in Matlab. The type of network created was a Feedforward Backpropagation.
Figure 5 - MatLab ToolBox screen ("Create" button)
Case Study
The underground distribution network of the center of São Paulo has several distribution systems, all of them supplied by different substations. For the URDS the circuits are powered by four distinct medium voltage circuits of 21 kV. The network has a total of 74,803 km of cables of different characteristics. For these tests, the Augusta substation region was chosen with the dedicated reticulated underground distribution. The supply of this system is usually made by 2, 3 or 4 transformers, with capacity of 500 or 750 kVA distributed.
Figure 6 - Load distribution of the studied region.
For the tests of the Augusta substation, the measuring points of each branch that expands the network were strategically chosen, according to the characteristics and the load of the network. In total, 7 measurement points in medium voltage were selected as shown in Figure 7. At these points the current measurements in each of the feeders will be obtained, with 4 current readings per point.
Figure 7 - Voltage measurement points in the underground medium voltage network.
Technical losses reduction using artificial neural networks
Braz. Arch. Biol. Technol. v.61, no.spe: e18000180 2018
7
Figure 8 - Location of capacitor banks
Also, in order to also unify the CB values, several power tests were carried out on the banks, which helped to choose and established the two three-phase powers a 200 kVAr and a 50 kVAr installed on the low voltage side. It was also defined that the CBs should be installed with transformers, aiming that the capacities injected into the network by the CBs were distributed in the four feeding branches of the network.
Figure 9 presents the proposed installation of one of the CBs and the location of current measurements in the primary circuit.
Figure 9 - Illustration of the Current Transformers (CTs) and the Capacitor Bank location in the Reticulated Network.
RESULTS
In order to assess the effectiveness of ANN for the dynamic choice of the CB maneuvers to reduce technical losses in the network, output reports about technical losses were generated at the SINAP grid program at the end of each simulated day.
For each day there were 2 reports of technical losses, one with all banks turned off, no correction all day and one with the banks being smartly activated throughout the day by ANN.
All the days of the week were adjusted at the SINAP grid program, following the parameters of real demand values provided by the power utility, both in summer and winter, making possible to stipulate the values of load and losses throughout the month.
Table 1 present the simulation results of summer and winter losses calculation where
Table 1 - Results of summer and winter losses calculation
Summer Winter
Week D. C. ANN C.D. C. A. RNA
(1) (2) (3) (4)
Sunday 1.597 1.538 1.162 1.123
Monday 4.527 4.382 2.85 2.749
Tuesday 4.337 4.195 2.803 2.703
Wednesday 4.95 4.793 3.001 2.895
Thursday 4.618 4.469 3005 2.899
Friday 4.987 4.83 2.957 2.853
Saturday 2.279 2.194 1.45 1.399
Total 27.294 26.401 17.228 16.621
x 4 week 109.176 105.604 68.912 66.484
DISCUSSION
The responses from ANN at 1-hour intervals proved to be very efficient, in addition to a high accuracy of 99.555% in the hit rate. The interval of 1 hour also considered the variation of the consumption loads and the possible wear of equipment with the intermittent switching of the CBs.
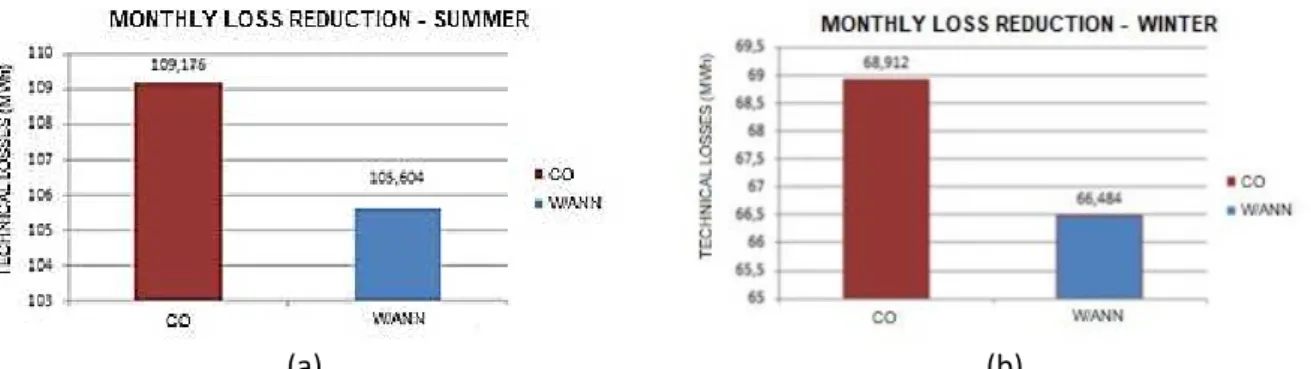
The results of the monthly energy losses, presented and compared in Figures 10 (a) summer and 10 (b) winter, demonstrate the success of the intelligent activation of CBs by ANN.
(a) (b)
Figure 10 - (a) Comparison between the monthly technical losses presented with all the capacitors turned off and the capacitors activated by ANN. (b) Comparison between the monthly technical losses presented with all the capacitors turned off and the capacitors activated by RNA.
CONCLUSION
In the summer month, the decrease in the losses reached 3,572 MWh / month, which corresponds to 3.27% reduction and in the winter month it reached 2,428 MWh / month, equivalent to 3.52% calculated by simulation. The energy gain reached about 40 MWh / year.
Technical losses reduction using artificial neural networks
Braz. Arch. Biol. Technol. v.61, no.spe: e18000180 2018
9
In addition, the system proved to be feasible for field application to control the CBs in real time. After properly trained, it presents its results in seconds after the measurements are entered into the system.
It is worth mentioning that the methodology proposes the ANN training for a given network configuration and loads. In case of changes in the topology of the network or of the installed equipment, new simulations must be carried out with the new network for a new ANN training.
REFERENCES
1. Azevedo FA. Otimização de Rede de Distribuição de Energia Elétrica Subterrânea Reticulada Através de Algoritmos Genéticos [dissertation]. Universidade Federal do Paraná. Curitiba. 2010.
2. AGÊNCIA NACIONAL DE ENERGIA ELÉTRICA. 2013. Aplicação do fator de potência para faturamento do excedente de reativos de unidades consumidoras. Resolução Normativa 569 (July 23), Brasília. Available from: http://www.aneel.gov.br/aplicacoes/ audiencia/arquivo/2012/065/resultado/ren2013569.pdf.
3. AGÊNCIA NACIONAL DE ENERGIA ELÉTRICA. 2010. Condição Geral de Fornecimento de Energia Elétrica. Resolução Normativa 414 (Sep 09), Brasília, DF. Available from: http://www.aneel.gov.br/cedoc/ren2010414comp.pdf.
4. Dabic V, Siew C, Peralta J, Acebedo D. BC Hydro’s Experience on Voltage VAR
Optimization in Distribution System. IEEE, p. 7, 2010.
5. Schneider KP, Weaver T. Volt-VAR Optimization on American Electric Power Feeders in Northeast Columbus. IEEE, p. 8, 2012.
6. SINAPgrid . Available from: http://www.sinapsisenergia.com/produtos/plataforma
-sinapgrid-calculos-avancados-em-redes-eletrica.