Vol.58, n.6: pp. 953-960, November-December 2015 http://dx.doi.org/10.1590/S1516-89132015060366
ISSN 1516-8913 Printed in Brazil
BRAZILIAN ARCHIVES OF BIOLOGY AND TECHNOLOGY
A N I N T E R N A T I O N A L J O U R N A L
Microencapsulation and Storage Stability of Lycopene
Extracted from Tomato Processing Waste
Rahul C. Ranveer
1*, Abhijeet A. Gatade
1, Harshwardhan A. Kamble
1and Akshya K.
Sahoo
21Department of Food Science and Technology. 2Department of Technology; Shivaji University; Maharashtra -
India
ABSTRACT
The aim of this study was to optimize the encapsulation of lycopene using response surface methodology and to determine its stability. The lycopene was extracted from tomato processing industry waste. The extracted pigment was purified by crystallization method. The effect of different process parameters, viz, core to wall ratio, sucrose to gelatin and inlet temperature on encapsulation efficiency (EE) and encapsulation yield (EY) were studied. Structural study of encapsulated material was carried by using scanning electron microscope (SEM). The samples with and without encapsulation were stored under different conditions such as the presence and absence of air, sunlight, at room temperature and under refrigeration. Highest EE (92.6 ± 0.86) and EY (82.2 ± 0.95) were observed when the core to wall ratio was 1:4, sucrose to gelatin ratio was 7:3 and inlet temperature was 1800C. The
SEM analysis showed the encapsulated lycopene was of “bee-net” shaped, whereas lycopene without encapsulation
was like “saw dust”. More than 90% retention was recorded in microencapsulated sample stored in all storage conditions, whereas sample without encapsulation showed less than 5% retention with sample storage conditions after 42 days of storage. The optimization and storage study would be helpful to the lycopene producer to improve storage stability.
Key words: Lycopene, encapsulation, encapsulation efficiency, encapsulation yield, RSM
*Author for correspondence:[email protected]
INTRODUCTION
Lycopene is a red colored natural pigment occurring in tomato, guava, rosehip, watermelon and pink grapefruit, and is one of the major carotenoids in the human diet (Silva et al. 2012;
Srivastva and Srivastva 2015). Regular
consumption of food rich in lycopene helps to reduce the risk of developing several types of cancers, including prostate, cervical and breast cancers in humans (Rao and Agarwal 1999; Downham and Collins 2000; Shuet al. 2006). It reduces low-density lipoprotein oxidation and helps lower cholesterol levels in the blood. In
addition, lycopene can reduce the risk of developing macular degeneration, serum lipid oxidation and cancers of the lung, bladder, cervix and skin (Rao and Agarwal 1999; Silva et al. 2012).
carotenoids can easily rearrange in different geometric isomers and also be oxidized, with the consequent decrease or loss of the colorant and biological properties (Nunes and Mercadante 2007).
Microencapsulation technique has been widely
used to protect food ingredients against
deterioration, volatile losses, or premature interaction with other ingredients. The protective mechanism therein is to form a membrane (wall system) to enclose the droplets or particles of the encapsulated material (core). Various kinds of microencapsulation techniques such as solvent dispersion/evaporation, phase separation
(co-acervation), co-crystallization, interfacial
polymerization etc., have been developed, among which, spray-drying is the most commonly used in food industry due to its continuous production and easiness of industrialization (Jimenez et al. 2004; Rodriguez-Huezoet al. 2004; Hui et al. 2014). In present study, attempts have been made to optimize the encapsulation process by using response surface methodology (RSM) and study storage stability of encapsulated lycopene under different conditions.
MATERIAL AND METHODS
Raw Materials and Chemicals
Fresh tomato processing industry waste was collected from ANS Foods, Sangli, Maharashtra, India.
Extraction and purification of lycopene
The lycopene was extracted as per procedure suggested by the Ranveer et al. (2013) with slight modifications. The dried waste samples were treated with ethanol for 30 min to remove the moisture. Then lycopene extraction was carried out with a mixture of acetone, ethanol and hexane solvents in the ratio of 1:1:2 (Mass: Solvent was 1:7) for 30 min with continuous shaking. Then 3.0 mL of deionized water was added for phase separation. The upper layer was collected and concentrated in rotary vacuum evaporator. This
concentrated extract was dissolved in
dichloromethane/ethanol (1:4) at 50-600C and
cooled gradually in ice bath. This was then refrigerated overnight for crystallization. The crystals were filtered through Whatman No 1 filter paper, washed with cold ethanol and dried in freeze dryer. The crystallization process was
repeated for higher level of purity (Nunes and Mercadante 2007).
Preparation of emulsions and spray-drying
The emulsions used for spray-drying and the operation of spray-drying process were similar to the report described by Shuet al. (2006). Gelatinand sucrose were dissolved in different ratios in hot distilled water. Lycopene solution in acetone was added into this aqueous solution with constant stirring to form a coarse emulsion, which was then homogenized under high pressure homogenizer. The resulting emulsion was spray-dried on spray dryer (Model LU-222, Labultima, Mumbai, India), equipped with a spray-drying chamber, a high speed centrifugal atomizer, cyclone separator, a hot air blower and exhaust blower. The emulsion was fed at 2.0 ml/min into the chamber, atomized with hot air in a co-current flow mode and the spray-dried microcapsules were collected in the cyclone separator fitted with an exhaust blower.
Lycopene purity (content)
Lycopene purity was determined
spectrophotometrically as reported by Schierle et al. (1997) using an UV spectrophotometer
(Shimadzu Co. Ltd., Japan) at λmax = 503 nm.
The purity (or content) was calculated as:
ω = Ad/Em
Where ω = lycopene purity, A = absorbance, d=
dilution factor, E = 3120, which is the extinction
coefficient of lycopene at λ= 503 nm when n
-hexane is used as solvent; m = weight of lycopene sample.
Encapsulation yield (EY)
The EY was calculated as the ratio of the mass of microcapsules obtained and the mass of initial substances added (lycopene, gelatin and sucrose) (Man et al. 1999). The Encapsulation yield was calculated as follows:
Where, MSA = total mass of microcapsules obtained after encapsulation and MSB = total mass of solids before encapsulation.
Encapsulation efficiency (EE)
mg) was dissolved in just sufficient amount of distilled water to form a homogeneous solution. The lycopene in the solution was extracted by
hexane and its mass was determined
spectrophotometrically as described above. The encapsulation efficiency (EE) was calculated as(McNamee et al. 2001):
Where TL = total lycopene and SL = surface lycopene.
SEM analysis
A scanning electron microscope (JSM – 6360,
JEOL, Germany) was used to study the microstructure of encapsulated lycopene sample. The sample was mounted horizontally and vertically using carbon tape on aluminum disc of diameter 3.0 cm and thickness 0.5 cm. The disc containing specimens was placed in vacuum
sublimator sputter coater (JFC – 1600, JEOL,
Germany) and sprayed with platinum. The stub
was placed on a pre-cryogenic electron
microscope specimen holder that was pre-frozen by liquid nitrogen and observed at acceleration voltage 10kV and 20kV (Silva et al. 2012).
Experimental design for response surface methodology and statistical analysis
A central composite rotatable design (CCRD) (Montgomery 2001) was used to investigate the effect of core to wall ratio (A), inlet temperature (B) and sucrose to gelatin ratio (C) on EY and EE. The statistical software package Design –Expert 8.0.7.1 was used to design the experiment. Each factor was investigated at three levels, i.e.,-1, 1, +1 (Table 1). With three factors, a set of 27 runs was designed based on CCRD. The EE and EY were measured as response variables. A quadratic model was then fitted to the data upon regression. The relationship of the independent variables and the response was calculated by the second order polynomial (Eq. 1).
Y is the predicted response, β0 a constant, βi the
linear coefficient, βii the squared coefficient and
βij the cross-product coefficient; k is number of factors. The second-order polynomial coefficients were calculated using the software to estimate the
responses of the dependent variable which were plotted accordingly.
Table 1 - Coded values of independent process variables.
Process Parameters Coded Value Actual Value Core to wall ratio -1, 1, +1 1:2, 1:4, 1:6 Inlet Temperature (0C) -1, 1, +1 160, 170, 180 Sucrose to gelatin ratio -1, 1, +1 6:4, 7:3, 8:2
Stability Studies of microencapsulated lycopene
The samples with and without encapsulation were packed in pre-sterilized glass bottles, which were stored under different storage conditions such as in presence and absence of air, sunlight, at room
temperature (25 ± 20C)and under refrigerated
condition (5 ± 20C). These were analyzed
periodically at regular intervals of seven days for retetion of lycopene content.
RESULTS AND DISCUSSION
Purification of Lycopene
The spectrophotometery results showed
characteristic peaks of lycopene at around 445, 472 and 503 (results not shown). However, the absorbance value at 503 nm with molar extinction coefficient of 1.585 x 10⁵ M-1cm-1was considered as precise since at this wavelength, there was minimum interference from other carotenoids (Zuorro and Lavecchia 2010).Wavelengths such as 445, 472 and 503have also been reported for lycopene (Aghel et al. 2011; Ranveer et al. 2013). The HPLC chromatogram showed two separate peaks, one for internal standard and another for lycopene (data not shown). The peak for lycopene was observed at retention time of 11.5. Similar retention time was reported by Anguelova and Warthesen 2000.
Effect of different parameters on EE and EY
The actual responses (i.e., EE and EY) of
microencapsulated lycopene of independent
The P values were used as a tool to check significance of each of the coefficients, which, in turn, were necessary to understand the pattern of the mutual interactions between the test variables. The smaller the magnitude of the P, the more significant was the corresponding coefficient. Values of P less than 0.05indicated that model terms were significant. The coefficient estimates
and the corresponding P values of EE and EY,
among the test variables used in the study, Ax B (core to wall ratio X outlet temperature), A x C (core to wall ratio X sucrose to gelatin ratio) were the significant model terms. The corresponding second-order response models (see Eqs. 2 and 3) of free and microencapsulated lycopene, found after regression analysis, were as below:
EE = 1.91+ 0.012 x A + 0.008 x B + 0.005 x C – 0.055 x A2 + 0.002 x B2 + 0.020 x C2– 0.013 x AB – 0.006 x AC – 0.004 x BC--- (2) R2 = 0.78
EE = 1.96+ 0.006 x A + 0.012 x B + 0.003 x C – 0.004 x A2 + 0.002 x B2 + 0.035 x C2– 0.006 x AB – 0.002 x AC – 0.0008 x BC--- (3) R2 = 0.74
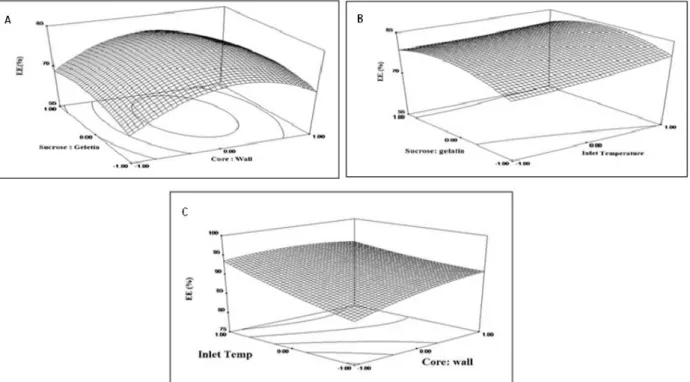
The surface plots of effect of independent
variables on EE and EY as shown in Figures1 and 2 represented the graphical representations of the regression equations, from which the values for different concentration of variables could be predicted. Each graph represented an infinite number of combinations of two variables with the others maintained at zero level. The maximum predicted value was indicated by the surface confined by the smallest ellipse in the contour diagram. Optimized mathematical model of optimal levels of the three independent variables for microencapsulation were: core to wall ratio at 1:4, inlet temperature at 1800C, and sugar to gelatin ratio at 7:3, which showed maximum EE (82.2 ± 0.95) and EY (92.6 ± 0.86).
The maximum EY was recorded when core to wall ratio was 1:4, whereas there was no significant difference EY, when core to wall ratio was 1:2 and 1:6. EE was lower in case of 1:2 ratio (i.e., 69.3 ± 0.61) than 1:6 ratio (i.e., 78.3±0.55). The reason could be associated with the instability of emulsion when core to wall ratio was 1:2; it was found that the emulsion started delaminating at 1:2 ratio. Therefore, 1:4 ratio was optimal choice for effective microencapsulation.
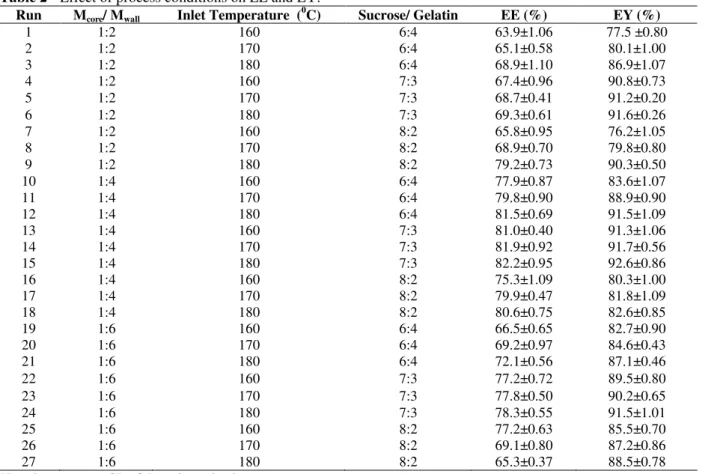
Table 2 - Effect of process conditions on EE and EY. Run Mcore/ Mwall Inlet Temperature (
0
C) Sucrose/ Gelatin EE (%) EY (%)
1 1:2 160 6:4 63.9±1.06 77.5 ±0.80
2 1:2 170 6:4 65.1±0.58 80.1±1.00
3 1:2 180 6:4 68.9±1.10 86.9±1.07
4 1:2 160 7:3 67.4±0.96 90.8±0.73
5 1:2 170 7:3 68.7±0.41 91.2±0.20
6 1:2 180 7:3 69.3±0.61 91.6±0.26
7 1:2 160 8:2 65.8±0.95 76.2±1.05
8 1:2 170 8:2 68.9±0.70 79.8±0.80
9 1:2 180 8:2 79.2±0.73 90.3±0.50
10 1:4 160 6:4 77.9±0.87 83.6±1.07
11 1:4 170 6:4 79.8±0.90 88.9±0.90
12 1:4 180 6:4 81.5±0.69 91.5±1.09
13 1:4 160 7:3 81.0±0.40 91.3±1.06
14 1:4 170 7:3 81.9±0.92 91.7±0.56
15 1:4 180 7:3 82.2±0.95 92.6±0.86
16 1:4 160 8:2 75.3±1.09 80.3±1.00
17 1:4 170 8:2 79.9±0.47 81.8±1.09
18 1:4 180 8:2 80.6±0.75 82.6±0.85
19 1:6 160 6:4 66.5±0.65 82.7±0.90
20 1:6 170 6:4 69.2±0.97 84.6±0.43
21 1:6 180 6:4 72.1±0.56 87.1±0.46
22 1:6 160 7:3 77.2±0.72 89.5±0.80
23 1:6 170 7:3 77.8±0.50 90.2±0.65
24 1:6 180 7:3 78.3±0.55 91.5±1.01
25 1:6 160 8:2 77.2±0.63 85.5±0.70
26 1:6 170 8:2 69.1±0.80 87.2±0.86
27 1:6 180 8:2 65.3±0.37 88.5±0.78
Figure 1 - Effect of independent variables on EE.
Figure 2 - Effect of independent variables on EY.
Both EY and EE increased with increase in temperature from 160 to 1800C. The high inlet temperature (i.e., more than 2000C) could break
responsible for low EE. Shu et al. (2006) reported that increase in temperature increased EY and EE, whereas these decreased dramatically at higher
temperature (2100C). EY and EE were higher
when the sucrose to gelatin ratio was 7:3, whereas lower when ratio was 8:2 and 6:4. The reason for such an observation could be due to significant increase in the viscosity of emulsions at sucrose to gelatin ratio of 8:2 to 6:4, which resulted in bad atomization effect during spray-drying, resulting in the formation of irregular particles with large particle size distribution, which would lead to accumulation of some under-dried particles on the chamber wall (Ozgur and Mustafa 2005).
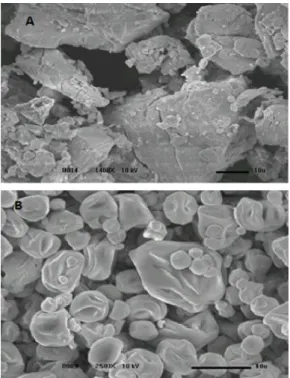
SEM analysis
The lycopene crystals without encapsulation and microencapsulated sample were subjected to SEM analysis (Fig. 3). It could be found that lycopene
without encapsulation appeared like “saw dust”,
whereas microcapsules were spherical (2–15 µm
in diameter with an average of 5 µm), having a
smooth outer surface and a „„bee net‟‟-like inner
structure. The formation of smooth outer percent degradation was observed after 35 days in dark condition. However, encapsulated samples, after 42 days storage in sunlight and dark conditions showed only 30.42 and 10.34% degradation, respectively. These results concluded that sunlight affected the stability of lycopene. Hackett et al. (2004) found that pigment stability decreased with time when stored under fluorescent light at 25 and 50°C. Lee and Chen (2002) reported that the degradation reactions of lycopene were influenced by the factors such as heat, light and oxygen; they also reported that the surface were probably attributed to the addition of sucrose in the formulation, which could retain some water molecules linked to its own structure, filling the internal empty space of the micro-particles, avoiding depressions on the surface. The reason
for formation of „„bee net‟‟-like inner structure
seemed to be associated with the evaporation rate of water from the core of microcapsules during microencapsulation (Shu et al. 2006).
Storage stability study
Lycopene samples, with and without
encapsulations, were subjected to study of storage stability in different storage conditions and results are presented in Figures 4 and 5.
Figure 3 - SEM image of (A) lycopene without encapsulation and (B) microencapsulated Lycopene.
Figure 4 - Retention (%) of lycopene without encapsulation.
Effect of oxygen on storage stability of lycopene
Both the samples, i.e., with and without encapsulation showed better retention of lycopene in the absence of air. The lycopene sample without encapsulation recorded only 5.29 % after 28 days of storage in presence of air and 6.83% after 35 days storage in absence of air. The encapsulated samples after 42 days of storage recorded retention of 67.57 and 71.38% in the presence and absence of air, respectively. It is well known that lycopene degradation occurs in the presence of oxygen by auto-oxidation. Better retention of lycopene was seen in the capsulated samples than in the samples without encapsulation. Anguelova and Warthesen (2000) reported that the presence of oxygen and increased temperature had the most unfavorable effect on lycopene stability as they increased auto-oxidation of lycopene.
Effect of sunlight on storage stability of lycopene
The samples stored in dark conditions showed better retention of lycopene than the samples stored in the presence of sunlight. The sample without encapsulation showed highest degradation (93.75%) after 28 days storage in sunlight, whereas about 94% of lycopene was loss after 144 h of exposure to light.
Effect of temperature on storage stability of lycopene
The encapsulated lycopene sample stored in refrigerated condition showed highest retention (90.56%) than any other samples and sample stored in room temperature showed 75.6% retention after 42 days storage. Less than 5% retention was recorded in lycopene sample without encapsulation. The results concluded that the temperature had significant effect on the storage stability of lycopene. Extracted lycopene rapidly degraded when exposed to light, oxygen and high temperature (Brumann and Grimme 1981).
CONCLUSION
The study showed that crystallization was one of best method for the purification of lycopene. The optimum process conditions, i.e., core to wall ratio was 1:4, inlet temperature 1800C and sucrose to gelatin ratio was 7:3 for encapsulation of lycopene by spray drying method. Stability study indicated
that encapsulated sample stored at refrigerated condition had most lycopene retention than any other sample. This could help to improve the storage stability of lycopene.
ACKNOWLEDGEMENT
The authors gratefully acknowledge the Science and Engineering Research Board (SERB), Government of India, New Delhi for the financial support under the Fast Track scheme for young scientist.
REFERENCES
Aghel N, Ramezani Z, Amirfakhrian S. Isolation and quantification of lycopene from tomato cultivated in Dezfoul, Iran. Jundishapur J Nat Pharmaceticals Pro. 2011; 6(1):9-15.
Anguelova T, Warthesen J. Lycopene stability in tomato powders. J Food Sci. 2000; 65: 67-70.
Brumann T, Grimme LH. Reversed phase high performance liquid chromatography of chlorophylls and carotenoids. Biochem Biophy Acta.1981; 637: 8-17.
Downham A, Collins P. Coloring our foods in the last and next millennium. Int J FoodSci Technol. 2000; 35: 5–22.
Hackett MM, Lee JH, Francis D, Schwartz SJ. Thermal stability and isomerization of lycopene in tomato oleoresins from different varieties. J Food Sci. 2004; 69: 536-541.
Hui G, Ying H, Jun-qing Q, Qiu-yi G, Ying T. Optimization of technological parameters for preparation of lycopene microcapsules. J Food Sci Technol. 2014; 51(7):1318-1325.
Jimenez M, Garcia HS, Beristain CI. Spray-drying microencapsulation and oxidative stability of conjugated linoleic acid. Eur Food Res Technol. 2004; 219: 588-592.
Lee MT, Chen BH. Stability of lycopene during heating and illumination in a model system. Food Chem. 2002; 78:425-432.
Man YC, Irwandi J, Abdullah WJW. Effect of different types of maltodextrin and drying methods on physicochemical and sensory properties of encapsulated durian flavour. J SciFood Agri. 1999;79:1075-1080.
Mercadante AZ, Egeland ES. 2004. Handbook ofCarotenoids, ed. G. Britton; S. Liaaen-Jensen and H. Pfander. Birkhäuser, Basel. 612p.
Montgomery DC. 2005. Design and analysis of experiments. 6thedn. New York: John Wiley and Sons.
Nunes IL, Mercadante AZ. Encapsulation of Lycopene Using Spray-Drying and Molecular Inclusion Processes. Braz Arch Biology Technol. 2007; 50: 893-900.
Ozgur AB, Mustafa BART. Spray drying of sumac flavour using sodium chloride, sucrose, glucose and starch as carriers. J Food Engg. 2005; 69:253-260. Ranveer RC, Patil SN, Sahoo AK. Effect of different
parameters on enzyme-assisted extraction of lycopene from tomato processing waste. Food and Bioprod Process. 2013; 91:370-375.
Rao AV, Agarwal S. Role of lycopene as antioxidant carotenoid in the prevention of chronic diseases: a review. Nutri Res. 1999; 19: 305-323.
Rodriguez-Huezo ME, Pedroza-Islas R, Prado-Barragan LA, Beristain CI, Vernon-Carter EJ. Microencapsulation by spray drying of multiple emulsions containing carotenoids. J Food Sci. 2004; 69: E351-E359.
Schierle J, Bretzel W, Buhler I, Faccin N, Hess D, Steiner K. Content and isomeric ratio of lycopene in food and human blood plasma. Food Chem. 1997; 59: 459-465.
Shu B, Wenli Yu, Yaping Zhao, Xiaoyong Liu. Study on microencapsulation of lycopene by spray-drying. J Food Engg. 2006; 76: 664-669.
Silva DF, Favaro-Trindade CS, Rocha GA, Thomazini M. Microencapsulation of lycopene by gelatin–pectin Complex coacervation. J Food Process Preservation. 2012; 36: 185-190.90
Srivastava S, Srivastava AK. Lycopene; chemistry, biosynthesis, metabolism and degradation under various abiotic parameters. J Food Sci Technol. 2015; 52(1):41-53.
Zuorro A, Lavecchia R. Mild enzymatic method for the extraction of lycopene from tomato paste. Biotechnol and Biotechnological Eq. 2010; 24, 1854-1857.