Relação proteína/energia em dietas para o kinguio (Carassius auratus)
Cristielle Nunes Souto1, Marcos Vinicius Antunes de Lemos1, Graciela Pessoa Martins1, Janaína Gomes Araújo1, Karina Ludovico de Almeida Martinez Lopes2, Igo Gomes Guimarães3
ABSTRACT
The optimal dietary digestible protein to energy ratio is critical for the success of fish farming. Considering that it provides the proper development of the animals, this study was undertaken to evaluate the effects of different dietary digestible protein to energy ratio in diets for goldfish fingerlings. Diets were formulated to contain 28.0, 35.0, 42.0 and 49.0% DP and 3,600 and 3,200 kcal/ kg. The growth parameters evaluated were daily weight gain (DWG), feed intake (FI), feed conversion ratio (FCR), protein efficiency ratio (PER), protein productive value (PPV) and energy retention ratio (ERR) and specific growth rate (SGR). Regardless FI, all the parameters were affected by protein and energy levels and interaction between both factors was observed. The second-order polynomial equation best fitted to the DWG, SGR, FCR, PER and ERR with estimated requirement values of 38.81, 38.85, 41.05, 41.80 and 39.39% DP, respectively, at the 3,200 kcal/kg. A second-order polynomial model was significant only for the ERR data at
the 3,600 kcal/kg with an estimated requirement value of 36.45% DP. Generally, fish fed diets containing 3,200 kcal/kghad better
growth performance than fish fed 3,600 kcal/kg (P<0.01), indicating a higher feed efficiency. A 3,200 kcal/kg diet seems to be the proper DE level for meeting goldfish requirement for highest weight gain. Based on this experimental condition, we recommend the use of DP levels between 38.0-40.0% in diets for goldfish with 3,200 kcal/kg or a dietary protein to energy ratio between 119-125 mg/ kcal DE.
Index terms: Energy requirement, feed intake, growth protein requirement, ornamental fish.
RESUMO
A ótima relação energia/proteína é importante para o sucesso da piscicultura. Considerando que a mesma fornece o adequado desenvolvimento dos animais, este estudo foi realizado para avaliar a relação energia/proteína digestível ótima para alevinos de kinguio. Dietas foram formuladas para conter 28,0; 35,0; 42,0 e 49,0% PD e 3600 e 3200 kcal/kg. Foram avaliados: ganho de peso diário (GPD), consumo de ração aparente (CRA), conversão alimentar aparente (CAA), taxa de eficiência protéica (TEP), valor produtivo protéico (VPP), taxa de retenção de energia (TRE) e taxa de crescimento especifico (TCE). Com exceção do CRA, todos os parâmetros foram afetados pelos níveis de proteína e energia e interação entre os dois fatores foram observados. O modelo que melhor se ajustou aos parâmetros GPD, TCE, CAA, TEP e TRE foi o polinomial de segunda ordem com valores de exigência de 38,81; 38,85; 41,05; 41,80 e 39,39% DP, respectivamente, para o nível de 3200 kcal ED/kg. O modelo polinomial de segunda ordem foi significativo apenas para os dados de TRE no nível de 3600 kcal ED/kg, com valor de exigência 36,45% PD. Os peixes alimentados com dietas contendo 3200 kcal/kg apresentaram melhor desempenho de crescimento do que os alimentados com 3600 kcal/kg (P<0,01), indicando uma maior eficiência alimentar. 3200 kcal/kg ED parece ser o nível adequado encontrado para kinguio para maior ganho de peso. Com base nas condições experimentais deste estudo, recomenda-se a utilização de níveis entre 38,0-40,0% PD em rações para kinguios com 3200 kcal/kg ou uma relação proteína/energia entre 119-125 mg/kcal ED.
Termos para indexação: Requerimento energético, consumo de ração, exigência protéica, peixe ornamental.
(Received in july 25, 2013 and approved in september 18, 2013)
1Laboratório de Pesquisa em Aquicultura/UFG – Campus Jataí – Jataí – GO – Brasil 2Universidade Federal de Goiás/UFG – Departamento de Zootecnia – Jataí – GO – Brasil
3Universidade Federal de Goiás/UFG – Departamento de Zootecnia – Unidade Jatobá – Cx. P. 03 – 75800-000 – Jataí – GO – Brasil – igoguimaraes@gmail.com
INTRODUCTION
Ornamental fish culture is an increasingly growing aquaculture activity in developing countries. This market has been increasing since the 80’s with annual profits around U$ 900 million with fish marketing and three billion dollars with related equipments and feed (FAO, 1999). The Asian countries are responsible for more than half of worldwide production in this
activity while the main consumers are the USA, Japan and Europe particularly Germany, France and United Kingdom (FAO, 1999).
Protein to energy ratios in goldfish... 551
Ciênc. agrotec., Lavras, v. 37, n. 6, p. 550-558, nov./dez., 2013 be performed to test if the diets developed for farmed fish
are adequate for ornamental fish.
The nutrient requirements of ornamental fish are not well established. Commercial diets are based on extrapolation of results obtained with farmed fish (YANONG, 1999; SALES; JANSSENS, 2003). A great diversity of ornamental fish species with different feeding plasticity are fed with the same diets. Additionally, diets exceeding the nutrient requirements may be responsible to reduced water quality inducing the appearance of disease outbreaks.
Optimum dietary protein to energy ratio must be used to formulate fish diets in order to promote adequate growth rates. High energy diets concur for a reduced protein and essential nutrients intake (CHOU; SHIAU, 1996; PEZZATO et al., 2001) and an increase on fat deposition in several fish species (MACGOOGAN; REIGH, 1996; MUKHOPADHYAY; RAY, 1997). On the other hand, diets with low energy content increase the use of protein as an energy source, increasing the feed efficiency ratio and the cost of production. Additionally, the increased nitrogen excretion due to deamination of amino acids in fish metabolism impose a serious problems to environmental sustainability of fish culture, reducing water quality and promoting the eutrophication of the environment.
Although the importance of goldfish on ornamental fish market scenario, until now, just two studies have reported the protein and amino acid requirement for this species (LOCHMANN; PHILLIPS, 1994; FIOGBÉ; KESTEMONT, 1995). However, none have studied the influence of digestible energy level on protein requirement. Thus, this study aimed to determine the digestible protein and energy requirement, and proper dietary protein to energy ratio for goldfish fingerlings based on growth performance and nutrient utilization.
MATERIAL AND METHODS
Experimental diet and diet preparation
Diets were manufactured using conventional feed ingredients in different proportions aiming to obtain different digestible protein and energy levels (Table 1). Thus, four digestible protein levels (28.0, 35.0, 42.0, and 49.0% DP) at two digestible energy levels (3,200 and 3,600 kcal/kg) were tested comprising eight diets. Digestible protein and energy content of feedstuffs were calculated based on apparent digestibility coefficients reported for tilapia (PEZZATO et al., 2002; GUIMARÃES et al., 2008, 2012).
All ingredients were ground until sieve in a mesh diameter of 500 mm. Diets were mechanically mixed with water (25% of dry weight) and the moist mixture was extruded in a 4.0 mm die of a meat grinder. Diets were oven dried until present moisture <100 g/kg, and stored at -18 ºC until further use. At the beginning of the experiment diets were ground and sieved in a mesh diameter according to fish size.
Experimental procedure
Three hundred goldfish with 90 days-old were purchased from a commercial fish farm and acclimatized to the laboratory conditions in two 500 L-aquaria. These fish were fed twice daily with a commercial diet to satiation for two weeks. The feeding trial was conducted in a recirculating system; accumulated feces were removed by siphoning. A homogenous group of 120 goldfish was selected by weight (1.78 ± 0.11 g) and randomly stocked into 24 3L-aquaria.
Each diet was fed to triplicate groups of fish for 45 days. Fish were fed until apparent satiation. The animals were fed at 07:00, 12:00, and 17:00 h. During the feeding trial water quality parameters were maintained in the optimum range for fish rearing (pH 6.8±0.3; dissolved oxygen 5.8±0.7 mg/L and ammonia (NH3) 124.0 μg/L). Water temperature was heater-controlled and kept at 26.0 ± 0.7 ºC. All tanks were maintained under natural photoperiod.
During the experiment, fish mortality was recorded. At the beginning and at the end of the feeding experiment, fish were starved for 24 h, and then weighed by group. Analysis and measurement
SOUTO, C. N. et al.
. 37, n. 6, p. 550-558, nov
./dez., 2013
Table 1 – Composition and proximate analysis of experimental diets.
Ingredients ED/PD levels
3,600/28.0 3,600/35.0 3,600/42.0 3,600/49.0 3,200/28.0 3,200/35.0 3,200/42.0 3,200/49.0
Soybean meal 10.80 - - - 16.00 5.00 - -
CSM-28 14.16 14.16 - - 14.80 16.35 - -
CSM-40 - - - - - - 7.00 -
Corn gluten meal - 7.62 14.16 15.40 - 7.62 14.16 15.46
Fish meal 5.30 5.30 - - 5.30 5.30 - -
Feather meal 25.83 30.64 30.64 - 21.23 25.64 26.64 -
Wheat middlings - 5.70 20.42 50.46 - 5.70 20.42 49.96
Broken rice - - - - - 4.00 - -
Cellulose - - 5.00 5.00 - - 5.00 5.00
Lysine HCl 1.57 3.24 3.46 5.60 1.53 2.55 3.58 5.60
DL - Methionine 0.40 0.52 0.75 1.12 0.40 0.52 0.77 1.12
Triptophan 0.04 - 0.05 0.06 - - 0.04 0.05
Threonine 0.63 0.80 0.80 0.87 0.63 0.80 0.82 0.87
Soybean oil 6.70 5.50 4.20 9.84 1.00 1.00 1.00 2.00
Dicalcium phosphate 1.80 1.80 1.80 1.98 1.80 1.80 1.80 1.98
Limestone 1.11 1.11 1.06 1.11 1.11 1.11 1.11 1.56
Vit C 0.04 0.04 0.04 0.04 0.04 0.04 0.04 0.04
NaCl 0.10 0.10 0.10 0.10 0.10 0.10 0.10 0.10
Vitamin/mineral mixa 0.50 0.50 0.50 0.50 0.50 0.50 0.50 0.50
BHTb 0.02 00.2 0.02 0.02 0.02 0.02 0.02 0.02
Total 100 100 100 100 100 100 100 100
Digestible energy* 3,637.34 3,608.28 3,623.90 3,599.46 3,269.46 3,258.31 3,173.36 3,210.88
Digestible protein* 28.26 35.22 42.25 49.02 28.60 35.64 41.76 49.02
Crude protein 32.82 42.44 49.06 55.47 34.30 42.68 49.39 55.67
Crude fiber 5.08 5.31 5.62 4.87 5.32 5.11 4.50 4.74
Lipid 12.63 12.83 10.86 15.09 6.15 6.12 6.34 7.19
Vitamin and mineral premixa: folic acid 600 mg, biotin 24 mg, choline chloride 54 g, niacin 12000 mg, Ca-D-pantothenate 6000 mg, vitamin A 600000 UI, vitamin B 1
Protein to energy ratios in goldfish... 553
Ciênc. agrotec., Lavras, v. 37, n. 6, p. 550-558, nov./dez., 2013 Calculations and statistical analysis
The following variables were calculated: Specific growth rate (SGR) = (Ln FW – Ln IW)×100/t; Daily weight gain (DWG) = (FW – IW)/t; Feed intake (FI) = Feed consumption (g)/((FW +IW)/2)×t) (WANG et al., 2012); Feed conversion ratio (FCR) = Dry feed fed in g/wet weight gain in g; Protein efficiency ratio (PER) = Wet weight gain in g/protein intake in g; Protein productive value (PPV) = (FW × P1 – IW × P2)/(Id × P); Energy retention ratio (ERR) = (FW × E1 – IW × E2)/(Id × E)
where FW is final body weight, IW is initial body weight, t is experimental duration in days, Id is feed intake of dry matter. P, P1 and P2 represent protein contents in diet, final fish body and initial fish body, respectively. E, E1 and E2 represent energy content in diet, final fish body and initial fish body, respectively.
The experiment followed a completely randomized design arranged in a 2 x 4 factorial scheme with three replicates. Th e data were ver ified for n or mality (Kolmogor ov–Smir nov test) an d homogeneity of variances (Levene’s F test). Data from each treatment were subjected to one-way analysis of variance (ANOVA), two-way ANOVA and corr elation analysis where appropriate. When overall differences were significant (P<0.05), Schefe multiple range test was used to compare th e mean values between in dividual tr eatmen t. Additionally, polynomial regression was evaluated to determine the protein requirement in each dietary digestible energy level. Statistical analysis was performed using SAS softwar e (STATISTICAL ANALYSIS SYSTEM, 1999), version 9.1.
RESULTS AND DISCUSSION
Growth performance of goldfish fed diets containing different levels of digestible protein and energy over 45-day feeding trial is presented in table 2. Regardless the feed intake, all growth parameters evaluated were influenced (P<0.05) by dietary protein and energy levels, and their interaction.
Protein is one of the most studied macronutrient in fish nutrition. However, several factors may influence the quantitative protein requirement for different fish species. Factors including fish size, the use of purified ingredients, the lipid content of diets, the amino acid composition of diets, among others have been described to affect the determination of protein requirement (ELANGOVAN; SHIM, 1997; BUREAU; ENCARNAÇÃO, 2006; VELASCO-SANTAMARÍA; CORREDOR-SANTAMARÍA, 2011;
NRC, 2011). In general, most of the studies conducted with fish have been using purified or semipurified diets to determine the quantitative protein requirement; however, the use of these types of ingredients/diets reduces the palatability of the diets. Thus, we decided to use conventional ingredients to formulate the experimental diets in this study to reduce the effect of the low nutrient intake on estimated requirement.
Although there are reports in the literature regarding the quantitative protein and amino acid requirement for Goldfish, no reports on the effect of different energy concentrations on protein requirement are available. Thus, we observed in this study that the protein requirement of goldfish is greatly affected by the energy content of the diets, thus corroborating with several reports with different fish species (MCGOOGAN; GATLIN, 2000; SATOH et al., 2004; MOLLA and AMIRKOLAIE, 2011). Until we could reference, there is just two studies in the literature reporting the protein and energy requirement for Goldfish, however none have used different energy content.
No effect of increasing levels of protein and/or energy on feed intake of goldfish was observed in this study. This result was un expected sin ce there is evidence to suggest th at fish control feed intake primarily to meet metabolic energy demands, and that con t r ol is closer r ela ted t o th e di gest ible a n d metabolisable energy content of the diet (MORALES et al., 1994; BOUJARD; MÉDALE, 1994). Although there are reports in the literature regarding the effects of nutrients on food intake of fish, a multitude of factors could affect the control of food intake in fish (DE LA HIGUERA, 2001), for example, the great variability on ingredients composition of experimental diets may have affected the palatability in some treatments. The high inclusion of fats and an imal proteins could have increased the feed intake in high energy diets while the presence of high carbohydrate and vegetable proteins content in low energy diets may have not be sufficient to decrease the palatability of the diets. All these factors may have acted in synergism for the non evident effect of energy on feed intake.
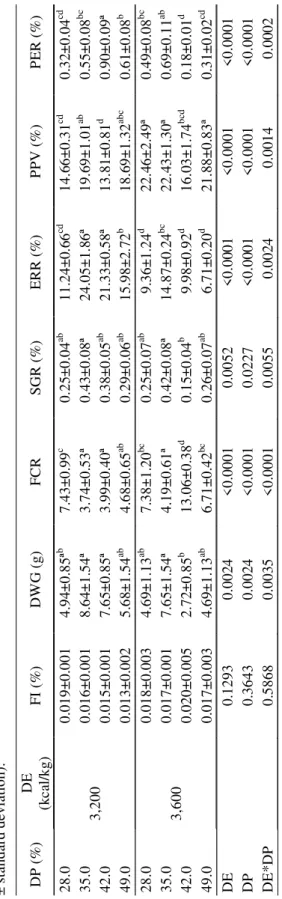
T
able 2 – Growth performance and feed ef
ficiency of goldfish fingerlings fed diets containing dif
ferent digestible protein and
ener
gy levels (n = 3, mean
±
standard deviation). DP
(% ) DE (k ca l/ kg) F I (% ) DW G (g) F C R S G R (% ) E R R (% ) P P V (% ) P E R (% ) 28. 0 3, 200 0. 019± 0. 001 4. 94 ± 0. 85ª b 7. 43± 0. 99 c 0. 25 ± 0. 04 ab 11. 24± 0. 66 cd 14. 66± 0. 31 cd 0. 32 ± 0. 04 cd 35. 0 0. 016± 0. 001 8. 64 ± 1. 54ª 3. 74± 0. 53ª 0. 43 ± 0. 08ª 24. 05± 1. 86ª 19. 69± 1. 01 ab 0. 55 ± 0. 08 bc 42. 0 0. 015± 0. 001 7. 65 ± 0. 85ª 3. 99± 0. 40ª 0. 38 ± 0. 05 ab 21. 33± 0. 58ª 13. 81± 0. 81 d 0. 90 ± 0. 09ª 49. 0 0. 013± 0. 002 5. 68 ± 1. 54 ab 4. 68± 0. 65 ab 0. 29 ± 0. 06 ab 15. 98± 2. 72 b 18. 69± 1. 32 ab c 0. 61 ± 0. 08 b 28. 0 3, 600 0. 018± 0. 003 4. 69 ± 1. 13 ab 7. 38± 1. 20 bc 0. 25 ± 0. 07 ab 9. 36± 1. 24 d 22. 46± 2. 49ª 0. 49 ± 0. 08 bc 35. 0 0. 017± 0. 001 7. 65 ± 1. 54ª 4. 19± 0. 61ª 0. 42 ± 0. 08ª 14. 87± 0. 24 bc 22. 43± 1. 30ª 0. 69 ± 0. 11 ab 42. 0 0. 020± 0. 005 2. 72 ± 0. 85 b 13. 06± 0. 38 d 0. 15 ± 0. 04 b 9. 98± 0. 92 d 16. 03± 1. 74 bcd 0. 18 ± 0. 01 d 49. 0 0. 017± 0. 003 4. 69 ± 1. 13 ab 6. 71± 0. 42 bc 0. 26 ± 0. 07 ab 6. 71± 0. 20 d 21. 88± 0. 83ª 0. 31 ± 0. 02 cd DE 0. 1293 0. 002 4 < 0. 0001 0. 0052 < 0. 00 01 < 0. 000 1 < 0. 000 1 DP 0. 3643 0. 002 4 < 0. 0001 0. 0227 < 0. 00 01 < 0. 000 1 < 0. 000 1 DE *D P 0. 5868 0. 003 5 < 0. 0001 0. 0055 0. 002 4 0. 00 14 0. 00 02
Different superscript letters within a column indicate significant differences at P<0.05 by Schefee test.
At the 3,200 kcal/kg, the linear increase on dietary protein level improved feed efficiency and growth performance of goldfish reaching a peak, and thus reducing significantly. Estimated protein requirement at 3,200 kcal/ kg based on DWG, SGR, PER, FCR and ERR were 38.81, 38.85, 41.80, 41.05, and 39.39%, respectively. However, the estimated protein requirement based on energy retention at the 3,600 kcal/kg level was lower (36.45%) than the 3,200 kcal/kg level.
The highest PPV was observed in fish fed the 28.0/ 3,600 and 35.0/3,600 diets, while the lowest PPV was observed for fish fed the 28.0/3,200 and 42.0/3,200 diets. Generally, fish fed diets containing 3,600 kcal/ kg retained more protein in their bodies compared to the 3,200 kcal/kg level.
At the 3,600 kcal/kg level, the highest growth rates were observed in fish fed diets with 35.0% DP, while the lowest values were observed in fish fed 42.0% DP. The results of feed efficiency showed similar trend to the growth data.
The estimated protein requirement for Goldfish based on growth response seems to be around 39.0% DP at the lowest DE level (3,200 kcal/kg), while Goldfish seemed to grow better when fed a diet with 35.0% at the highest DE level (3,600). These results indicated a possible protein-sparing effect of energy (mainly provided by lipid) in Goldfish. Additionally, the highest PPV values observed in Goldfish fed the highest DE level supports our hypothesis, indicating that fish efficiently used protein when a decrease in DP:DE ratio was attained. This strongly supports the findings of several authors with numerous farmed fish species that the reduction of DP levels with or without concomitant increase in the dietary non protein DE supply lead to improved protein utilization (NRC, 2011).
Protein to energy ratios in goldfish... 555
Ciênc. agrotec., Lavras, v. 37, n. 6, p. 550-558, nov./dez., 2013 Figure 1 – Effect of dietary protein level on the DWG (a), SGR (b), PER (c), FCR (d), ERR (e) of goldfish fed diets containing 3,200 kcal/kg and the effect of the dietary protein level on the ERR (f) of goldfish fed diets containing 3,600 kcal/kg.
If a regression analysis is fitted to those data, a linear ascending regression would probably fit better, indicating th at the pr otein r equiremen t is h igher than th at recommended by Lochman and Phillips (1994) for goldfish. There is strong evidence in several reports that the requirement for maximizing protein gain is higher than that required to maximize weight gain (RODEHUTSCORD et al., 1997; SUSENBETH et al., 1999; HAULER; CARTER, 2001; BUREAU; ENCARNAÇÃO, 2006). Similarly, we observed in our study that Goldfish required a higher amount or DP (between 41.0 and 42.0) to sustain maximum feed utilization which supports previous studies with other farmed fish species.
since the diets with the highest DE levels had a higher lipid content while the low DE diet presented higher starch content. However, it seems that lipid has a more pronounced effect on protein-sparing for goldfish since higher PPV and lower ER were, in general, observed for the diets containing higher lipid content (3,600 kcal/kg). Additionally, it seems that goldfish have the ability to convert energy derived from carbohydrate to lipid synthesis since a higher energy retention was observed in fish fed the low energy diet which is in one hand with data on other fish species that energetic efficiency for protein retention in fish is lower than that for fat deposition (SCHWARZ; KIRCHGESSNER, 1995; RODEHUTSCORD; PFEFFER, 1999; LUPTATSCH et al., 2003). However, we did not evaluate the composition of fish growth due to lack of samples to determine the lipid content.
CONCLUSIONS
A 3,200 kcal/kg diet seems to be the proper DE level for meeting goldfish requirement for highest weight gain. Based on this experimental condition, we recommend the use of DP levels between 38.0-40.0% in diets for goldfish with 3,200 kcal/kg diet or a dietary protein to energy ratio between 119-125 mg/kcal DE. A protein sparing effect by dietary lipid seems to occur in goldfish; however it was not clear if the dietary carbohydrate has the same effect. Furthermore, goldfish seems to be able to use lipid more efficiently than carbohydrates, but more studies are needed in this area since low nitrogen excretion is a quality that ornamental fish feed producers and hobbyists search when choosing a diet.
ACKNOWLEDGEMENTS
The authors are grateful to Dr. Barros and Dr. Pezzato (São Paulo State University) for the support on extruding the experimental diets in their laboratory. The authors are grateful to Dr. Miranda (Chemistry and Biochemistry Institute of Alagoas Federal University) for the support on chemical analysis and performing the gross energy determination.
REFERENCES
AOAC – ASSOCIATION OF OFFICIAL ANALYTICAL CHEMIST. Official methods of analysis of the
association of official analytical chemists. Arlington, 1995, 30p.
BANDYOPADHYAY, P.; SWAIN, S.K.; MISHRA, S. Growth and dietary utilisation in goldfish (Carassius
auratus Linn.) fed diets formulated with various local
agro-produces. Bioresource Technology, Trivandrum, v.96, n.6, p.731-740, 2005.
BLOM, J.H.; DABROWSKI, K. Vitamin C requirements of the Angelfish Pterophylum scalare. Journal of the World Aquaculture Society, Baton Rouge, v.31, n.1, p.115-118, 2000.
BOUJARD, T.; MÉDALE, F. Regulation of voluntary feed intake in juvenile rainbow trout fed by hand or by self-feeders with diets containing two different protein/ energy ratios. Aquatic Living Resources, Cambridge, v.7, n.3, p.211-215, 1994.
BUREAU, D.P.; ENCARNAÇÃO, P.M. Adequatelly determining the amino acid requirements of fish: The case example of lysine. In: Avances en Nutricion Acuicola, VIII Simposium Internacional de Nutricion Acuicola, Mexico, november 2006. p. 29-54.
CHOU, B.S.; SHIAU, S.Y. Optimal dietary lipid level for growth of juvenile hybrid tilapia, Oreochromis niloticus
x Oreochromis aureus. Aquaculture, Amsterdam, v.143,
n.2, p.185-195, 1996.
DE LA HIGUERA, M. Effects of nutritional factors and feed characteristics on feed intake. In: HOULIHAN, D.; BOUJARD, T.; JOBLING, M. Food intake in fish. Willey-Blackwell, 2001. p.250-268.
DENG, D.F. et al. Optimal dietary protein levels for juvenile Pacific threadfin (Polydactylus sexfilis) fed diets with two levels of lipid. Aquaculture, Amsterdam, v.316, n.1-4, p.25-30, 2001.
ELANGOVAN, A.; SHIM, K.F. Growth response of juvenile Barbodes altus fed isocaloric diets with variable protein levels. Aquaculture, Amsterdam, v.158, n.3-4, p.321-329, 1997.
FAO - Food and Agriculture Organization of the United Nations). State of world fisheries and aquaculture, FAO. Rome, 1999. 159p.
FIOGBÉ, E.D.; KESTEMONT, P. An assessment of the protein and amino acid requirement in goldfish
(Carassius auratus) larvae. Journal of Applied
Protein to energy ratios in goldfish... 557
Ciênc. agrotec., Lavras, v. 37, n. 6, p. 550-558, nov./dez., 2013 GUIMARÃES, I.G. et al. Apparent nutrient
digestibility and mineral availability of protein-rich ingredients in extruded diets for Nile tilapia. Revista Brasileira de Zootecnia, Viçosa, v.41, n.8, p.1801-1808, 2012.
HAULER, R.; CARTER, C. Reevaluation of the
quantitative dietary lysine requirement of fish. Review in Fisheries Science, New London, v.9, n.3, p.133-163, 2001.
LIU, X.Y.; WANG, Y.; JI, W.X. Growth, feed utilization and body composition of Asian catfish (Pangasius
hypophthalmus) fed at different dietary protein and lipid
levels. Aquaculture Nutrition, Oxford, v.17, n.5, p.578– 584, 2011.
LOCHMANN, R.T.; PHILLIPS, H. Dietary protein requirement of juvenile golden shiners (Notemigonus
crysoleucas) and goldfish (Carassius auratus) in
aquaria. Aquaculture, Amsterdam, v.128, n.3-4, p.277-285, 1994.
LUPTATSCH, I.; KISSIL, G.W.; SKLAN D. Comparison of energy and protein efficiency among three fish species gilthead sea bream (Sparus aurata), European sea bass (Dicentrarchus labrax) and white grouper
(Epinephelus aeneus): energy expenditure for protein
and lipid deposition. Aquaculture, Amsterdam, v.225, n.1-4, p.175-189, 2003.
MCGOOGAN, B.B.; REIGH, R.C. Apparent digestibility of selected ingredients in red drum (Sciaenops
ocellatus) diets. Aquaculture, Amsterdam, v.141, n.3-4,
p.233-244, 1996.
MCGOOGAN, B.B.; GATLIN, D.M Dietary
manipulations affecting growth and nitrogenous waste production of red drum, Sciaenops ocellatus. II. Effects of energy level and nutrient density at various feeding rates. Aquaculture, Amsterdam, v.182, n.3-4, p.271–285, 2000.
MOHANTA, K.N. et al. Protein requirement of silver barb, Puntius gonionotus fingerlings. Aquaculture Nutrition, Oxford, v.14, n.2, p.143–152, 2008. MOLLA, A.E.; AMIRKOLAIE, A.K. Growth performance of Persian sturgeon fry, Acipenser
persicus, fed diet containing different protein and
energy levels. Journal of Applied Ichthyology, Berlim, v.27, n.2, p.766–770, 2011.
MORALES, A.E. et al. Effects of dietary protein source on growth, feed conversion and energy utilization in raibow trout, Oncorhynchus mykiss. Aquaculture, Amsterdam, v.124, n.1-4, p.117-126, 1994.
MUKHOPADHYAY, N.; RAY, A.K. The apparent total and nutrient digestibility of sal seed (Shorea
robusta) meal in rohu (Labeo rohita), fingerlings.
Aquaculture Research, Oxford, v.28, n.9, p.683-689, 1997.
NRC - NATIONAL RESEARCH COUNCIL. Nutrient requirements of fish and shrimp. National Academy Press, Washington, DC, USA, 2011.
PEZZATO, L.E.; CASTAGNOLLI, N.; ROSSI, F.
Nutrição e alimentação de peixes. Viçosa: Aprenda fácil, 2001. 72p.
PEZZATO, L.E.; et al., Digestibilidade aparente de ingredientes pela tilápia do Nilo (Oreochromis
niloticus). Revista Brasileira de Zootecnia, Viçosa,
v.31, n.4, p.1595-1604, 2002.
RODEHUTSCORD, M. et al. Response of rainbow trout
(Oncorhynchus mykiss) to supplements of individual
essential amino acids in a semipurified diet, including an estimate of the maintenance requirement for essential amino acids. Journal of Nutrition, Pennsylvania, v.127, n.6, p.1166-1175, 1997.
RODEHUTSCORD, M.; PFEFFER, E. Maintenance requirement of digestible energy and efficiency of utilization of digestible energy for retention in rainbow trout, (Oncorhynchus mykiss). Aquaculture,
Amsterdam, v.179, n.1-4, p.95-107, 1999.
SALES, J.; JANSSENS, G.P.J. Nutrient requirements of ornamental fishes. Aquatic Living Resources, Cambridge, v.16, n.1, p.533–540, 2003.
SAS – STATISTICAL ANALYSIS SYSTEM Software. Version 9.1. Cary, North Carolina: SAS Institute Inc., 1999.
SATOH, S. et al. Effects of dietary lipid and phosphorus levels on nitrogen and phosphorus excretion in young yellowtail Seriola quinqueradiata: a preliminary observation. Fisheries Science, Singapore, v.70, n.6, p.1082-1088, 2004.
SCHWARZ, F.J.; KIRCHGESSNER, M. Effects of different diets and levels of feeding on retention and efficiency of utilization of energy and protein by carp
(Cyprinus carpio L.). Journal of Applied Ichthyology,
Berlim, v.11, n.3-4, p.363–366, 1995.
SHEARER, K.D. Experimental design, statistical analysis and modelling of dietary nutrient requirement studies for fish: a critical review. Aquaculture Nutrition, Oxford, v.6, n.2, p.91–102, 2000.
SUSENBETH, A. et al. The effect of energy intake, genotype, and body weight on protein retention in pigs
when dietary lysine is the first-limiting factor. Journal of Animal Science, Champaign, v.77, n11, p.2985-2989, 1999.
TAMARU, C.S.; AKO, H.; PAGUIRIGAN, R. Essential fatty acid profiles of maturation feeds used in
freshwater ornamental fish culture. Hydrobiologia, Brussels, v.358, n.1, p.265-268, 1997.
VELASCO-SANTAMARÍA, Y.; CORREDOR-SANTAMARÍA, W. Nutritional requirements of freshwater ornamental fish: a review. Revista Medicina Veterinaria y Zootecnia, Córdoba, v.16, n.2, p.2458-2469, 2011.
WANG, Y.Y. et al. Effects of dietary protein and lipid levels on growth, feed utilization and body composition
in Pseudobagrus ussuriensis fingerlings. Aquaculture