Dietary Factors in Epidemic Neuropathy
on the Isle of Youth, Cuba1
JOHN GAY,~ CARMEN
PORRATA,~ MANUEL
HERNANDEZ,~
ANA
M.CL~~A,~
Jo& M.ARG~ELLES,~
ALEJANDRINA CABRERA,~ &
LUIS C.SILVA~
444
An epidemic neuropathy thaf broke out in Cuba in late 1991 has exhibited clinical manifes- tafions similar to those of other polyneuropathies of nutritional origin. To investigate ifs possible association with diet, a sfudy zuas conducfed on the Isle of Youth in 1993, at the start of au outbreak there. Thirty-four subjects with cases and 65 controls were interviewed regarding their diets, measured anthropometrically, and evaluated.
As a whole, fhe subjects mith cases demonstrated greater weight loss before the onset of
disease, lower body mass indexes @MI), lower percentages of body fat, and more deficienf diets fhan the control subjects. Analysis of individual varilrbles found associations between occurrence of the disease and the following: weight loss, low BMI, a broad range of specific dietary deficiencies, a sugar intake exceeding 15% of tofal caloric intake, alcohol consumption, and smoking. Also, protecfive associafions were found between absence of the disease and regular consumption of certain foods at or above specified levels.
Multivariate analysis indicated that while smoking and alcohol consumption reinforced the effects of the dietary deficiencies, they did not account for occurrence of the disease by themselves. Overall, the results indicate that diets which are deficient in caloric energy, protein, fat, and fhe micronutrients included in the study, and which reflect an imbalance resulting from a relative excess of sugar, with consequent effects on body weight, are strongly
associated with, and causally related to, the occurrence of epidemic neuropafhy in Cuba.
I
n late 1991 an increase was detected in the number of cases of bilateral op- tic neuropathy in Cuba’s Pinar de1 Rio Province. These cases were characterizedophthalmologically by the presence of
central or cecocentral scotomata, loss of red and green vision, pallor in the tem- poral border of the optic disc, and loss of axonal fibers in the papillomacular bundle. During the course of 1992, cases
‘This article was also published in Spanish in the
Boletin de In Oficinn Sanitaria Panamericana, Vol. 117, No. 5, November 1994. Reprint requests and other correspondence should be addressed to Dr. John Gay at the Instituto de Nutricibn e Higiene de 10s Alimentos, Infanta 1158, La Habana 10300, Cuba. 21nstitute of Nutrition and Food Hygiene, Havana,
Cuba.
3Vice-Rectorate of Research, Superior Institute of Medical Sciences of Havana, Havana, Cuba.
began to be recorded in other provinces, and a change was
observed in
that forms of peripheral neuropathy as well as mixed forms of the disease began to appear. These diverse manifestations were lumpedtogether under the classification “epi-
demic neuropathy” (EN).
From 1 January 1992 through 18 June 1993, 45 584 of these cases were reported in Cuba, indicating an incidence of 418.7 cases per 100 000 inhabitants. The dis- ease is concentrated in the 25-64 year age group, being found only occasionally in other age groups. Slightly over half of all patients have the optic form of the disease (2).
In the etiology of the polyneuropa- thies, among the matters considered are nutritional and toxic factors. However, it is recognized that cases of nutritional or-
igin usually show generalized signs of
undernutrition such as loss of subcuta- neous fat and muscle volume. Such cases
can rarely be ascribed to something as
simple as a single vitamin deficiency, the vast majority appearing to arise instead from several nutrient deficiencies acting together (2, 3).
Recent evolution of the epidemic on
Cuba’s Isle of Youth (Isla de la Juventud), involving a pattern of occurrence similar to that observed in Pinar de1 Rio at the
outset, permitted those conducting the
study reported here to assess the diets of those afflicted prior to onset of the dis- ease. The aim of this study was to eval- uate the hypothesis that the EN epidemic was associated with dietary deficiency.
MATERIALS
AND METHODS
The study was conducted in June 1993.
Thirty-four patients (21 men and 13
women) of the 44 with recorded cases on the Isle of Youth were included in the study population. While all 34 subjects had been diagnosed as having bilateral
optic neuropathy, some also showed
manifestations of peripheral neuropathy. It was not possible to examine the 10
remaining patients because they had
moved away from the area or had changed their address.
Sixty-five control subjects (people not exhibiting any symptoms of the disease) were selected at random from the same residential blocks where cases had been
identified or from adjoining blocks. By
applying a pairing process, the same age
(2 5 years) and sex proportions were
maintained in the case and control pop- ulations.
Measurements were taken of weight,
height (without stretching), and subscap- ular, tricipital, bicipital, and suprailiac skin folds; body mass index (BMI = weight/ height*) was calculated; estimates were made of body composition, i.e., the rel- ative percentages of fat (adipose tissue) and lean mass (fat-free tissue) (4); and
the subjects were classified by weight for height using the standard Cuban refer-
ence tables (5). All measurements were
made by the same technician using the same equipment.
Food consumption data were collected
by performing a semiquantitative study
of intake frequency based on direct in-
dividual interviews (the method most
recommended for case-control studies) (6).
These interviews lasted between 30 and
40 minutes. Addition of a column and
certain open-ended questions to the sur- vey form made it possible to further in- dividualize the survey by recording the
size of the portion normally consumed
by each subject and specifically identi- fying certain foods consumed. This made it possible to reduce certain errors attrib- utable to the standard instrument (7, 8).
The survey retrospectively recorded the frequency of consumption for the 90-day
period immediately preceding appear-
ance of the disease in subjects with cases. In order to avoid possible bias related to the seasonal influence of crops, the ques- tions asked the control subjects applied to the same time period and season as those asked of the subjects with cases.
The survey was designed and per-
formed by two specialized professionals. For operational reasons, there was no way to avoid the interviewers’ knowing which individuals were case subjects and which were controls.
The energy and nutrient content of each
subject’s diet was estimated using the
NUTRISIS program system (9). The rec-
ommended daily amount of energy in-
take was estimated for each individual based on the subject’s sex, age, desirable body weight, and the intensity of habit- ual physical activity in the months pre- ceding onset of the disease (10). The re-
spondents were also asked questions
regarding loss of body weight during the 12 months preceding the appearance of
symptoms. In calculating each subject’s
percentage of recommended nutrient in-
take, the nutritional recommendations for the Cuban population were employed (II).
To evaluate smoking, respondents were queried as to the number of cigars and cigarettes they smoked per day; one cigar
was considered the equivalent of five
cigarettes.
Regarding the anthropometric and di-
etary variables, percentile distributions were computed and the medians for study
cases and control subjects were com-
pared using the Kruskal-Wallis test.
A subject’s weight for height was
deemed low when the value found was below the range considered “acceptable” according to the standard reference tables for the Cuban population (5). The cutoff points for establishing the risk criteria with regard to particular foods were selected on the basis of the consumption or non- consumption of certain foods and the ar- bitrary size of the portions. The cutoff points for daily intake of energy and nu- trients were 50% of the daily recom- mended amounts, as values below these are more consistent with the appearance of deficiency manifestations.
Using these risk criteria, the variables were dichotomized. In order to evaluate the strength of the association between the risk factors being studied and the occur- rence of EN, odds ratios (OR) and their
corresponding confidence intervals (CI)
were calculated for each separate variable. To remove the effect of potentially con-
founding concomitant variables from the
analysis, logistic regression was em-
ployed. Since the hypothesis of interest concerned the effect of low consumption of nutrients, and since deleterious habits
were recognized as elements favoring
processes similar to those being investi-
gated, adjustments were made for the
variables of smoking and alcohol con-
sumption, both of which were also ad-
dressed at the bivariate level (by asking whether the subject did or did not smoke and did or did not consume more than 10 grams of alcohol per day).
RESULTS
The mean age of female study subjects with cases of EN was 44.0 years, with a range of 20 to 64 years, while that of male subjects with cases was 42.7 years, with a range of 25 to 56 years. The mean age of female control subjects was 41.9 years, with a range of 26 to 68 years, while that of male control subjects was 43.3 years, with a range of 23 to 60 years.
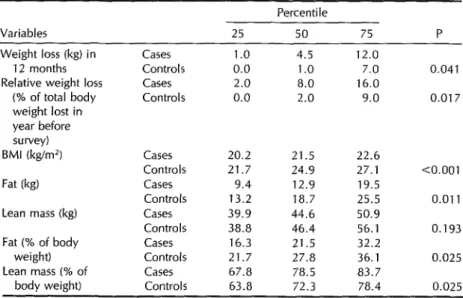
Overall, compared to the control sub- jects the subjects with cases exhibited greater weight loss prior to falling ill, a lower BMI, a lower percentage of body
fat, lower consumption of the various
foods selected with the exception of leafy vegetables, a less varied diet, greater con- sumption of alcohol, and a markedly lower intake of caloric energy and nutrients. As indicated in Tables 1 through 5, all of these differences exhibited statistical sig- nificance.
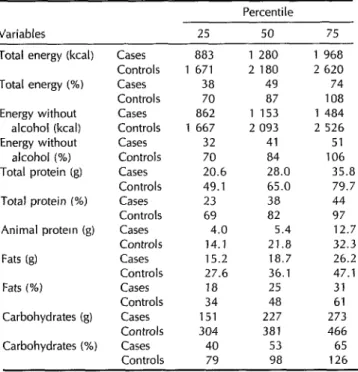
The percentage contributions of total
protein and protein of animal origin to to- tal caloric energy intake (without consid- ering the energy provided by alcohol) were lower among the subjects with cases than among the controls, but the contribution of sugar to this energy intake was higher among the cases (Table 6).
The OR obtained by analyzing each in-
dividual variable indicated possible as-
sociations between occurrence of the dis-
ease and the following: weight loss, a
BMI below 23 kg/m*, low body weight (in terms of weight for height), low intake of bread, low intake of rice, a relatively un-
varied diet, nonconsumption of milk, a
sugar intake accounting for over 15% of total caloric energy, alcohol consumption (over 10 grams per day), and a daily intake at or below 50% of the recommended amount of caloric energy (excluding en- ergy derived from alcohol), protein, fat, or various micronutrients (folic acid, niacin, pyridoxine, riboflavin, thiamine, vitamin A, or vitamin E) (Tables 7-9). In addition, observed associations indicated that con-
Table 1. Anthropometric variables of the study cases (N = 34) and controls (N = 65), showing values obtained for the 25th, 50th, and 75th percentiles of each group and the statistical significance of the differences observed between the medians of the two groups.
Percentile Variables
Weight loss (kg) in 12 months Relative weight loss
(% of total body weight lost in year before survey) BMI(kg/m?
Fat (kg)
Lean mass (kg)
Fat (% of body weight) Lean mass (% of
body weight)
25 50 75 P
Cases 1.0 4.5 12.0
Controls 0.0 1.0 7.0 0.041 Cases 2.0 8.0 16.0
Controls 0.0 2.0 9.0 0.017
Cases 20.2 21.5 22.6
Controls 21.7 24.9 27.1 <O.OOl Cases 9.4 12.9 19.5
Controls 13.2 18.7 25.5 0.011 Cases 39.9 44.6 50.9
Controls 38.8 46.4 56.1 0.193 Cases 16.3 21.5 32.2
Controls 21.7 27.8 36.1 0.025 Cases 67.8 78.5 83.7
Controls 63.8 72.3 78.4 0.025
sumption of the following conferred pro- tection: tubers and starchy roots (>125 g/ day), beans (>120 g/day), oil (>15 g/day), and meat products extended with soy- bean flour (~15 g/day) (Table 8). No as- sociation was found (I’ = 0.501) between the estimated intensity of physical activ- ity and occurrence of the disease.
The median value for the number of cigarettes smoked per day was 20 among the subjects with cases and three among the control subjects (I’ < 0.001). When
smoking was considered by itself, it
emerged as a significant factor associated positively with the disease (OR = 4.25; CI = 1.41 to 13.41). This association in-
creased with the number of cigarettes
smoked, values for those smoking over 20 cigarettes per day (as compared to nonsmokers) being higher (OR = 18.37; CI = 4.40 to 105.27) than for those smok- ing over 10 per day (OR = 11.30; CI = 3.71 to 37.89).
The multivariate analysis showed that
the effect of smoking persisted when the confounding effect attributable to alcohol
consumption was taken into account in
28 Bulletin of PAHO 29(Z), 1995
the model (OR = 3.82; CI = 1.37 to 10.63). However, the effect of alcohol consump- tion disappeared when the data were ad- justed for smoking.
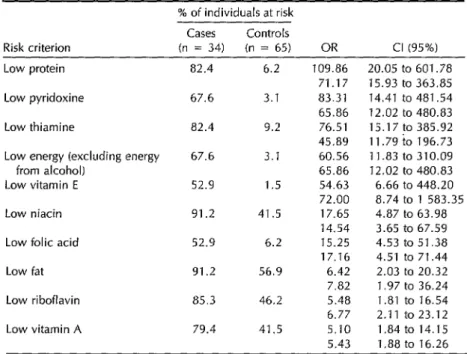
When the nutritional data were in turn adjusted for these two habits, the OR values for intake of protein, caloric en- ergy (excluding energy from alcohol), fat, pyridoxine, thiamine, vitamin E, niacin, folic acid, riboflavin, and vitamin A re- mained substantially in excess of 1.0 (see Table 9). In contrast, the presumed effect of smoking and alcohol use was diluted when the two variables were included in a trivariate model containing any of these
nutritional variables. Specifically, the
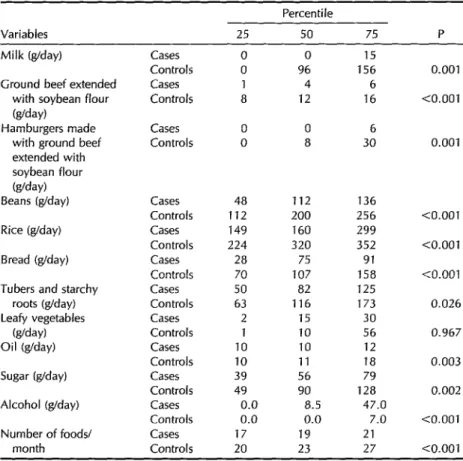
Table 2. Intakes of selected foods by the study cases (N = 34) and controls (N = 65), showing values (in g/day of ready-to-eat foods) obtained for the 25th, 5Oth, and 75th percentiles of each group and the statistical significance of the differences observed between the medians of the two groups.
Variables
Percentile
25 50 75 P
Milk (g/day)
Ground beef extended with soybean flour (g/day)
Hamburgers made with ground beef extended with soybean flour (g/day) Beans (g/day)
Rice (g/day)
Bread (g/day)
Tubers and starchy roots (g/day) Leafy vegetables
(g/day) Oil (g/day)
Sugar (g/day)
Alcohol (g/day)
Number of foods/ month
Cases Controls Cases Controls
Cases 0 0 6 Controls 0 8 30
Cases
Controls Cases Controls Cases Controls Cases Controls Cases Controls Cases Controls Cases Controls Cases Controls Cases Controls
0 0 15
0 96 156
1 4 6
8 12 16
48 112 136 112 200 256 149 160 299 224 320 352
28 75 91
70 107 158 50 82 125 63 116 173
2 15 30
1 10 56
10 10 12
10 11 18
39 56 79
49 90 128 0.0 8.5 47.0 0.0 0.0 7.0
17 19 21
20 23 27
0.001
<O.OOl
0.001
<O.OOl
<O.OOl
<O.OOl
0.026
0.967
0.003
0.002
<O.OOl
<O.OOl
model containing energy, pyridoxine, vi- tamin E, folic acid, or riboflavin.
The OR for vitamin C intake was not
significant when energy intake (exclud-
ing energy from alcohol), smoking, and alcohol consumption were included in the same model. In contrast, low energy in- take (without alcohol) at or below 50% of
the recommended amount continued to
show a significant association with oc-
currence of the disease (OR = 54.88; CI = 10.18 to 295.97) after the data were adjusted for smoking, alcohol consump- tion, and vitamin C intake.
When adjustments were made for pro- tein intake, this eliminated associations
between the disease and deficient cal-
cium and iron intakes (see Table 5) that had been observed when the effects of calcium and iron intakes were assessed
individually without adjustment.
DISCUSSION
AND
CONCLUSIONS
Weight loss has been a frequent find-
ing in neuropathy epidemics similar to
this one (2,12, 23). Within our study pop- ulation, the greater weight loss detected among subjects with cases can be attrib- uted to greater dietary deficiency, as no difference in estimated physical activity was found between cases and controls.
Table 3. Intakes of total caloric energy, caloric energy excluding alcohol, total protein, animal protein, fat, and carbohydrate by the study cases (N = 34) and controls (N = 65), showing amounts (in kcal or g) and percentages of the recommended amounts recorded for the 25th, 5Oth, and 75th percentiles of each group. In every instance the difference between the medians of the two groups was statistically highly significant (P < 0.001). The category “animal protein (%)” was not included because a broad consensus on the recommended dietary intake of animal protein has not been reached, and this value is not generally furnished by most normative literature.
Percentile Variables 25 50 75
Total energy (kcal) Cases 883 1 280 1 968
Controls 1 671 2 180 2 620
Total energy (%) Cases 38 49 74
Controls 70 87 108
Energy without Cases 862 1 153 1 484
alcohol (kcal) Controls 1 667 2 093 2 526
Energy without Cases 32 41 51
alcohol (%) Controls 70 84 106
Total protein (g) Cases 20.6 28.0 35.8
Controls 49.1 65.0 79.7
Total protein (%) Cases 23 38 44
Controls 69 a2 97
Animal protein (g) Cases 4.0 5.4 12.7
Controls 14.1 21.8 32.3
Fats (g) Cases 15.2 18.7 26.2
Controls 27.6 36.1 47.1
Fats (%I Cases 18 25 31
Controls 34 48 61
Carbohydrates (g) Cases 151 227 273
Controls 304 381 466
Carbohydrates (%I Cases 40 53 65
Controls 79 98 126
Physical activity has increased in most of the Cuban population as a result of the economic difficulties currently affect- ing the country, a phenomenon that has taken place together with a decrease in the amount and variety of foods con- sumed. National per capita food availa- bility in 1992 represented only 82% of the estimated caloric energy and 75% of the estimated protein of food available in 1989, with protein providing 9% of the total energy and fat providing 15% (14). How- ever, it should be noted that priority has been given to children in the distribution of certain foods, which may explain the
30 Bdetin of PAHO 29(Z), 1995
low incidence of EN among individuals under 15 years of age.
The toxic action of the cyanogenic glu- cosides contained in foods such as yuca (cassava), cabbage, and beans (15) has been discussed as a possible factor in the
current epidemic neuropathy, based on
experiences elsewhere (16-18). How-
Table 4. Intakes of vitamin B complex components by the study cases (N = 34) and controls (N = 65), showing amounts (in mg or kg) and percentages of the recommended amounts recorded for the Xth, .Wth, and 75th percentiles of each group. In every instance the difference between the medians of the two groups was statistically highly significant (P < 0.001).
Percentile
Variables 25 50 75 Thiamine (mg) Cases 0.27 0.44 0.69
Controls 0.68 0.87 1.06
Thiamine (%) Cases 20 32 44
Controls 57 67 83
Riboflavin (mg) Cases 0.21 0.32 0.47
Controls 0.62 0.82 1.04
Riboflavin (%) Cases 13 19 28
Controls 14 53 66
Pyridoxine (mg) Cases 0.44 0.68 0.95
Controls 1.09 1.37 1.70
Pyridoxine (%) Cases 28 43 58
Controls 78 90 114
Niacin (mg) Cases 2.86 4.81 6.23
Controls 7.58 9.64 12.97
Niacin (%) Cases 16 26 34
Controls 46 54 70
Folic acid ()~g) Cases 77 117 151
Controls 182 224 306
Folic acid (%) Cases 31 47 60
Controls 73 90 122
The widespread introduction of soy-
beans into the Cuban population’s diet
has aroused suspicion among some re-
searchers, because of the neurotoxic ef- fects of possible residues of hexane in extract flours and the adverse influence of certain soybean constituents on intes- tinal absorption (29). However, the pro- tective association found in the present study between soybean intake and being a control subject suggests this suspicion is unfounded.
No food item was ingested in greater amounts by the subjects with cases as opposed to the controls, and hence it was not possible to assign any particular item the attribute of being a potential carrier of some toxic substance.
The median energy intake (including alcohol) of the subjects with cases was similar to the estimated per capita energy
value of the rationed supply of food,
whereas that of the control subjects was similar to the per capita energy intake for the Cuban population in 1992, as esti-
mated using the food balance sheet
method-a method that includes ra-
tioned supplies, public feeding pro-
grams, and food obtained through self-
grown crops and other means (14). The diet of the subjects with cases in this study was low in animal protein. The lack of essential amino acids combined with a low energy intake can be pre- sumed to have increased the catabolism of tissue proteins and favored the loss of body weight. In addition, these circum- stances also appear to have influenced,
among other things, the methylation re-
actions that lead to the synthesis of my- elin, detoxification of cyanide (20), and synthesis of taurine (21). Also, a com-
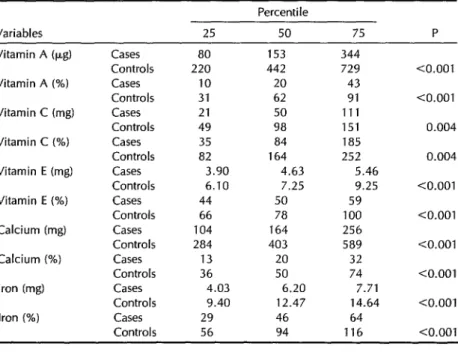
Table 5. Intakes of vitamins A, C, and E, of calcium, and of iron by the study
cases (N = 34) and controls (N = 65), showing amounts (in mg or kg) and
percentages of the recommended amounts recorded for the 25th, 5Oth, and 75th percentiles of each group and the statistical significance of the differences observed between the medians of the two groups.
Variables 25
Percentile
50 75 P
Vitamin A (pg) Vitamin A (%) Vitamin C (mg) Vitamin C (%) Vitamin E (mg) Vitamin E (%) Calcium (mg) Calcium (%) Iron (mg) Iron (%)
Cases 80 153 344
Controls 220 442 729
Cases 10 20 43
Controls 31 62 91
Cases 21 50 111
Controls 49 98 151
Cases 35 84 185
Controls 82 164 252
Cases 3.90 4.63 5.46
Controls 6.10 7.25 9.25
Cases 44 50 59
Controls 66 78 100
Cases 104 164 256
Controls 284 403 589
Cases 13 20 32
Controls 36 50 74
Cases 4.03 6.20 7.71
Controls 9.40 12.47 14.64
Cases 29 46 64
Controls 56 94 116
10.001
<O.OOl
0.004
0.004
<O.OOl
<O.OOl
<O.OOl
<O.OOl
<O.OOl
<O.OOl
Table 6. A comparison of the percentages of total caloric intake derived from different sources (excluding alcohol) by the 25th, 5oth, and 75th percentiles of the study cases (N = 34) and controls (N = 65) and the statistical significance of the differences observed between the medians of the two groups.
Percentile
Variables 25 50 75 P
Energy (excluding alcohol-derived energy) from:
Total protein (%) Animal protein (%)
Fat (%)
Cases 7.8 10.2 11.8
Controls 10.9 11.8 13.6 0.00
Cases 1.4 2.5 ' 3.6
Controls 2.9 4.6 5.5 -co.00
Cases 14.6 15.8 21.0
1
1
Controls 12.9 14.8 18.6 0.206
Carbohydrate (%) Cases 67.8 74.4 77.4
Controls 68.8 72.1 75.4 0.280
Sugar (%) Cases 15.5 19.5 23.6
Controls 12.6 15.4 21.4 0.041
Table 7. Percentages of cases and controls at risk because of their low body mass index, low body weight for height, or loss of weight; odds ratios (OR) and confidence intervals (Cl) are shown for the differences observed.
% of individuals at risk Cases Controls
Risk criterion (n = 34) (n = 65) OR Cl (95%) BMI < 23 kg/m2 76.5 30.8 7.31 2.56 to 21.54 Low body weight (weight for
height) 67.6 27.7 5.46 2.02 to 15.09 Loss of weight (in 12-month period) 79.4 56.9 2.92 1 .Ol to 8.71
Table 8. Percentages of cases and controls at risk (*) or protected (t) by their reported intakes of the selected foods indicated; odds ratios (OR) and confidence intervals (Cl) are shown for the differences observed.
% of individuals at risk (*) or protected (t) Cases Controls
Risk criterion (n = 34) (n = 65) OR Cl (95%) Bread ~105 g/day* 85.3 49.2 5.98 1.87 to 20.41 Rice <160 g/day* 55.9 18.5 5.59 2.01 to 15.88 <18 foods/month* 50.0 16.9 4.91 1.74to 14.10 Nonconsumption of milk* 70.6 33.8 4.69 1.74 to 12.91 Sugar >15% of energy* 73.5 49.2 2.86 1.06 to 7.91 Alcohol 710 g/day* 47.1 24.6 2.72 1.03 t0 7.28
Leafy vegetables >30 g/day+ 20.6 33.8 0.51 0.17to 1.49 Tubers and starchy roots >125
g/day+ 17.6 41.5 0.30 0.1oto 0.91 Ground beef extended with
soybean flour > 15 g/day+ ii.8 33.8 0.26 0.07 to 0.92 Hamburgers made with ground beef
extended with soybean flour >15
g/day* 8.8 33.8 0.19 0.04 to 0.76 Oil >15 g/day+ 11.8 40.0 0.20 0.05 to 0.70 Beans >120 g/day+ 32.4 69.2 0.21 0.08 to 0.57
bined decrease in the intake of trypto- intake or interference with the absorp-
phan and pyridoxine compromises the tion, deposit, metabolism, and excretion
synthesis of niacin (22). All these effects of multiple nutrients such as folic acid,
favor the appearance of neuropathies of methionine, niacin, thiamine, zinc, and
nutritional origin. vitamins A, B,, and E (2, 23).
The greater consumption of alcohol ob- served among the study subjects with cases increased the risk of undesirable collateral manifestations. That is because the net effect of chronic alcohol ingestion is reduction in the tissue concentrations of ATP, increased weight loss, and the
appearance of micronutrient deficien-
cies-whether as a result of limited food
Dietary deficiencies have been identi- fied as a factor in the pathogenesis of both optic and peripheral neuropathies. The importance of vitamin deficiencies in
these neuropathies is widely recognized (2, 3, 24). By the 1940s Beam (25) had already noted that amblyopia was prob- ably due to vitamin, mineral, and protein deficiencies; intoxications of a chemical
Table 9. Percentages of cases and controls deemed at risk because their reported intakes of the listed nutrients were at or below 50% of the recommended amounts. (The 50% values were estimated for each subject, based on that subject’s sex, age, desirable body weight, etc.) For each variable, the OR and Cl on the bottom line represent figures obtained when working with that variable alone, while the figure on the top line represents the result of a multivariate analysis in which values were adjusted for smoking and alcohol consumption.
% of individuals at risk Cases Controls
Risk criterion (n = 34) (n = 65) OR Cl (95%) Low protein 82.4 6.2 109.86 20.05 to 601.78
71.17 15.93 t0 363.85 Low pyridoxine 67.6 3.1 83.31 14.41 t0 481.54 65.86 12.02 t0 480.83 Low thiamine 82.4 9.2 76.51 15.17 t0 385.92 45.89 11.79to 196.73 Low energy (excluding energy 67.6 3.1 60.56 ii .a3 t0 310.09 from alcohol) 65.86 12.02 t0 480.83 Low vitamin E 52.9 1.5 54.63 6.66 t0 448.20 72.00 a.74 t0 i 583.35 Low niacin 91.2 41.5 17.65 4.87 t0 63.98
14.54 3.65 to 67.59 Low folic acid 52.9 6.2 15.25 4.53 t0 51.38 17.16 4.51 to 71.44 Low fat 91.2 56.9 6.42 2.03 to 20.32
7.82 1.97 to 36.24 Low riboflavin 85.3 46.2 5.48 1.81 to 16.54 6.77 2.11 to 23.12 Low vitamin A 79.4 41.5 5.10 1.84 t0 14.15 5.43 1.88 to 16.26
and biological nature; and the effect of intense physical activity combined with insufficient energy intake (25).
The relatively high sugar content in the diet of the subjects with cases, together with their relatively low intake of thia-
mine and high consumption of alcohol,
could be expected to increase the likeli- hood of clinical manifestations of thia- mine deficiency (26). However, the clin- ical pictures of these subjects did not
precisely match those of cases involving thiamine deficiency alone.
The subjects with cases had markedly
lower average intakes of niacin, ribo-
flavin, pyridoxine, and folic acid than did
the control subjects. Niacin and ribo-
flavin, in addition to thiamine, partici- pate in cellular metabolism of glucose,
the primary source of energy for nerve cells. Also, pyridoxine is the cofactor in the decarboxylation reactions that lead to synthesis of the central and peripheral
nervous system neurotransmitters. In ad-
dition, pyridoxine and folic acid partici- pate in key functions of sulfur compound
metabolism necessary for methylation re-
actions that lead to synthesis of myelin and to cyanide detoxification (27).
The clinical manifestations of EN in
Cuba include weight loss, blurred vision, photophobia, gradual loss of visual acu-
ity, neurosensorial auditory loss, dys-
phonia, dysphagia, sensory ataxia, pain
in the extremities, increased urinary fre-
quency, weakness in the legs, dyses-
thesias and paresthesias (primarily in the ankles), and a burning sensation on the
soles of the feet (I). References to these clinical manifestations appear in the lit- erature, together with references to man- ifestations of combined dietary deficien- cies involving the B complex vitamins that include cheilosis, glossitis, angular sto- matitis, and pellagroid cutaneous altera- tions (2).
The average intake levels of B complex vitamins that were found for the subjects with cases (less than 50% of the recom- mended daily intakes) are consistent with
the appearance of multiple deficiency
manifestations.
Also, in studies of neuropathies of nu- tritional origin, combined vitamin A and
B complex deficiencies have been re-
ported (23, 25). In our survey, vitamin A intake among the subjects with cases av- eraged only 20% of the recommended daily intake.
In addition, vitamin E intake among
the subjects with cases was low. This nu- trient, in conjunction with selenium and vitamin C, prevents peroxidation of lip- ids in the cell membranes. In vitamin E
deficiency, neuroaxonal dystrophy-type
neuropathies can occur (28, 29).
The diet-related results observed in the subjects with cases in this study are com- patible with the distal axonal lesions found in biopsies of the sural nerves of patients studied in other provinces. These latter lesions may be of nutritional, toxic, or metabolic origin (I).
The noxious effect of tobacco on the optic nerve is attributed to an inability to detoxify cyanide to thiocyanate with for- mation of other products that may inter- fere with myelinization and the turnover of myelin (30). This alteration may also be provoked by inadequate nutrition in- volving proteins and a number of differ- ent vitamins (31). In our study, diet may have played a major role in the associa- tion observed between smoking and EN, which increased with the number of cig- arettes smoked per day.
Following adjustment of the data for
smoking and alcohol consumption, the
results of the multivariate analysis showed that the association between EN and nu- trition remained unconditionally present.
This finding strongly supported the as-
sumption that, although these deleteri-
ous habits reinforced the effect of dietary deficiency, they were not sufficient to ac- count for the association between dietary deficiency and occurrence of the disease by themselves.
The favorable response of most Cu-
bans with EN to vitamin treatment (1, 24)
supports the principal hypothesis ad-
vanced in this study. The study results also permit the conclusion that a diet de- ficient in caloric energy, protein, fat, and the various micronutrients studied-and unbalanced by a relative excess of sugar, with consequent effects on body weight- is strongly associated with EN and bears a causal relationship to it.
Acknowledgments. We are grateful to
Raisa Moreno for her technical anthro- pometry work and to those who helped implement the study on the Isle of Youth, particularly Dr. Elena Vidaillet and tech- nician Jose Arcia.
REFERENCES
Llanos G, Asher D, Brown P, et al. Neu- ropatia epidemica en Cuba. Bol Epidemiol OF’S 1992;12:7-10.
Victor M. Polyneuropathy due to nutri- tional deficiency and alcoholism. In: Dyck PJ, Thomas PK, Lambert E, Bunge R, eds. Volume 1: peripheral neuropathy. 2nd ed. Philadelphia: WB Saunders; 1984:1-43. Roman GC. Mielopatia y mieloneuropa- tias ti-opicales. Bol Oficina Sanit Panam 1986;101:452-462.
Durnin JVGA, Womersley J. Body fat as- sessed from total body density and its
estimation from skinfold thickness: mea-
surements on 481 men and women aged from 16 to 72 years. BY 1 Nutr 1974;32:77- 97.
5. Berdasco A, Romero JM. Valores criticos de peso para la talla en poblacion cubana adulta. Rev Cubana Med 1991;30:26-37. 6. Willett W. Nutritional epidemiology. New
York: Oxford University Press; 1990:159- 181. (Monographs in epidemiology and biostatistics; vol 15).
7. Friedenreich CM, Slimani N, Riboli E. Measurement of past diet: review of pre- vious and proposed methods. Epidemiol Rev 1992;14:177-196.
8. Sempos CT. Some limitations of semi- quantitative food frequency question- naires. Am 1 Epidemiol 1992;135:1127-1136. 9. Rodriguez A, Prieto Y, Suarez A, Ar-
giielles JM, Mateo de Acosta G, Rodri- guez M. Sistema de programas por com- putacion para calculos dieteticos y de recomendaciones nutricionales. Rev Cu- bana Aliment Nufr 1987;1:47-54.
10. Organization Mundial de la Salud. Nece- sidades de energfa y de proteinas. Geneva: OMS; 1985. (Technical report series, 724). 11. Porrata C, Hernfindez M, Argiielles JM, Proenza M. Recomendaciones nutricio- nales para la poblacion cubana. Rev Cu- bana Alimenf Nutr 1992;6:132-141.
12. Bonhomme F, Agatston H. Belgian oph- thalmology during the war. Am ] Ophfhal- mol 1946;29:674-684.
13. Mitchell JB, Black JA. Malnutrition in re- leased prisoners-of-war and internees at Singapore. Lancet 1946;251(6433):855-862. 14. Grupo Operativo National. Neuropatfa epi-
de’mica en Cuba. Havana: Centro National de Informacibn de Ciencias Medicas; 199344-45.
15. Rosling H. Cassava toxicity and food securify: a report for UNICEF. 2nd ed. Uppsala: African Household Food Security Pro- gramme; 1988:5-33.
16. Osuntokun BO, Monekrosso GL, Wilson J. Relationship of degenerative tropical neuropathy to diet: report of a field sur- vey. Br Med J 1969;1:547-550.
17. TylleskHr T, Banea M, Bikangi N, Fresco L, Persson LA, Rosling H. Epidemiolog- ical evidence from Zaire for a dietary etiol- ogy of konzo, an upper motor neuron disease. Bull World Health Organ 1991; 69:581-589.
18. Howlett WI’, Brubaker GR, Mlingi N, Rosling H. Konzo, an epidemic upper
motor neuron disease studied in Tanza- nia. Brain 1990;113:223-235.
19. Aykroyd WR, Doughty J. Las leguminosas en la nufricidn humana. Rome: Organiza- cion de las Naciones Unidas para la Agri- cultura y la Alimentacion (FAO); 1982:34- 41. (Food and nutrition study 20). 20. Foulds WS, Pettigrew AR. Bases bioqui-
micas en las ambliopias de1 nervio optic0 de origen toxico. In: Perkins ES, Hill DW, eds. Fundamenfos cientqicos de offalmologia. Havana: Editorial Cientifico Tecnica; 1981: 65-69.
21. Hayes KC. A review of the biological function of taurine. Nufr Rev 1986;34:161- 165.
22. Horwitt MK, Harper AE, Henderson LM. Niacin-tryptophan relationships for eval- uating niacin equivalents. Am J Clin Nufr 1981;34:423-427.
23. Reinus JF, Heymsfield SB, Wiskind R, et al. Ethanol: relative fuel values and met- abolic effects in vivo. Metabolism 1989; 38:125-135.
24. Hoyt CS. Vitamin metabolism and ther- apy in ophthalmology. Surv Opkfkalmol 1979;24:177- 190.
25. Beam AD. Amblyopia due to dietary de- ficiency. Am J Opkfkalmol 1947;30:66-72. 26. Haas RH. Thiamine and the brain. Annu
Rev Nufr 1988;8:483-515.
27. Bender DA. Vitamin B,: requirements and recommendations. Eur 1 Clin Nufr 1989; 43:289-309.
28. Farrel PM. Deficiency states, pharmaco- logical effects, and nutrient requirements. In: Machlin LJ, ed. Vitamin E, a compre- hensive freafise. New York: Marcel Dekker; 1980:520-620.
29. Sokol RJ, Guggenheim MA, Iannaccone ST, et al. Improved neurologic function after long-term correction of vitamin E de- ficiency in children with chronic choles- tasis. N Engi J Med 1985;313:1580-1586. 30. Bronte-Stewart J, Pettigrew AR, Foulds
WS. Toxic optic neuropathy and its ex- perimental production. Trans Opktkalmol Sot UK 1976;96:355-358.
31. Oku H, Fukushima K, Miyata M, Wak- akura M, Ishikawa S. Cyanide with vi- tamin B,, deficiency as the cause of ex- perimental tobacco amblyopia. Acfa Sot Opktkalmol Jap 1991;95:158-164.