Ciência e Agrotecnologia 41(4):367-377, Jul/Aug. 2017
2017 | Lavras | Editora UFLA | www.editora.ufla.br | www.scielo.br/cagro
http://dx.doi.org/10.1590/1413-70542017414003317
Canola yield under different irrigation frequencies and nitrogen
levels in the Brazilian Cerrado
Produtividade de canola sob diferentes frequências de irrigação e doses de nitrogênio na região do Cerrado Brasileiro
Arthur Carniato Sanches1*, Eder Pereira Gomes2, Edéria Pereira Gomes Azevedo3
1Universidade de São Paulo/USP, Escola Superior de Agricultura Luiz de Queiroz/ESALQ, Departamento de Engenharia de Biossistemas, Piracicaba, SP, Brasil 2Universidade Federal da Grande Dourados/UFGD, Departamento de Agricultura, Dourados, MS, Brasil
3Diretoria de Agricultura e Meio Ambiente, Lençóis Paulista, SP, Brasil *Corresponding author: [email protected]
Received in February 14, 2017 and approved in July 5, 2017
ABSTRACT
In the Brazilian Cerrado, canola is grown in the off-season. During this period, rainfall is insufficient to ensure the maximum crop yield, and irrigation is needed. Canola has a high demand for nitrogen; thus, the application of this nutrient is essential for obtaining a good crop yield. Therefore, a study was conducted at the Federal University of Grande Dourados in 2012 and 2013 using a randomized block split-plot design with four repetition treatments in the plot that consisted of three irrigation frequencies (no irrigation, weekly irrigation and irrigation three times per week). Subplots received different doses of nitrogen: 0, 30, 60, 90 and 120 kg ha- 1 in 2012 and 0, 60, 120,
180 and 240 kg ha-1 in 2013. In both periods, the irrigation frequencies significantly affected plant height, dry weight, grain yield, thousand
grain weight and oil content. The nitrogen levels significantly affected dry weight, thousand grain weight and oil content in 2012, as well as plant height, number of pods, dry weight, grain yield and oil yield in 2013. The highest yields were obtained when irrigation was performed three times per week, corresponding to 3,001.84 kg ha-1 in 2012 and 2,516.7 kg ha-1 in 2013.
Index terms: Brassica napus L.;oil seeds; tensiometry.
RESUMO
No Cerrado brasileiro, a canola está sendo cultivada na estação seca, sendo que durante este período a precipitação não é suficiente para garantir o máximo rendimento da cultura, por isso há necessidade de irrigação. A canola tem uma alta demanda de nitrogênio, portanto, a aplicação deste nutriente é essencial para a obtenção de um bom rendimento. Assim, foi realizado um estudo na Universidade Federal de Grande Dourados, em 2012 e 2013, utilizando-se um delineamento de blocos ao acaso com quatro repetições, os tratamentos na parcela composta por três frequências de irrigação (sem irrigação, irrigação semanal e irrigação três vezes por semana). As subparcelas receberam diferentes doses de nitrogênio: 0, 30, 60, 90 e 120 kg ha-1 em 2012; E 0, 60, 120, 180 e 240 kg ha-1 em 2013. Em ambos os períodos, as
frequências de irrigação afetaram significativamente a altura da planta, o peso seco, o rendimento de grãos, o peso de mil grãos e o teor de óleo. Os níveis de nitrogênio afetaram significativamente o peso seco, o peso de mil grãos e o teor de óleo em 2012, assim como a altura da planta, o número de vagens, o peso seco, o rendimento de grãos e o rendimento de óleo em 2013. Os maiores rendimentos foram obtidos quando a irrigação foi realizada três vezes por semana, correspondendo a 3.001,84 kg ha-1 em 2012 e 2.516,7 kg ha-1 em 2013.
Termos para indexação: Brassica napus L.;sementes oleaginosas; tensiometria.
INTRODUCTION
Canola (Brassica napus L.) from the family of crucifers is the third most cultivated oilseed crop worldwide, after palm and soybean (Istanbulluoglu et al., 2010; Mousavi-Avval et al., 2011; Takashima et al., 2013). Canola can be used for human food, in industry or even as green manure (Pavlista et al., 2011; Sprague et al., 2014). In Europe, canola is mainly used for industrial purposes such as biodiesel production. In Brazil, however, canola is used for food production (Milazzo et al., 2013)
and livestock feeding, as bran or grains (Bergamin et al., 2011; França et al., 2011; Woyengo et al., 2016).
Canola is grown in Brazil, consisting of an area of 46,300 hectares concentrated mainly in the southern region, which accounts for 94% of the country’s production (Bergmann et al., 2013). In 2014/2015, crop production was 52,000 tons, with an average yield of 1,168 kg ha-1 (CONAB, 2015).
the literature reports values of 2.5 to 3.8 g (Dogan et al., 2011; Kamkar et al., 2011).
Nitrogen is essential to achieve canola yield potential (Hamzei; Soltani, 2012; Kaefer et al., 2014; Kamkar et al., 2011). With higher doses of nitrogen, 60 kg ha-1,
El-Howeity and Asfour (2012) obtained a higher number of pods per plant and of thousand grain weight. According to Beaudette et al. (2010), the best yield results are achieved with a nitrogen levelof 80 kg N ha-1, whereas Dogan et al.
(2011) and Kamkar et al. (2011) obtained higher yields with levels above 180 kg N ha-1 under irrigation.
Canola is sensitive to water stress during periods of flowering and grain filling (Dogan et al., 2011; Mohammadi; Rokhzadi, 2012). Research studies have shown a reduction in the number of pods per plant, in thousand grain weight and in yield due to water stress approximately 34, 35 and 20-45%, respectively, in two consecutive years (Faraji et al., 2009; Tohidi-Moghadam et al., 2009).
Under irrigation, some studies show that canola grain yield can vary between200 kg ha-1 and 3,200 kg ha-1 (Faraji
et al., 2009; Pavlista et al., 2011; Tohidi-Moghadam et al., 2009). However, other authors have reported yields above 4,000 kg ha-1 (Dogan et al., 2011; Kamkar et al., 2011).
As few research studies have been performed with canola grown off-season in the Brazilian center-west region, we assessed crop yield potential under different irrigation frequencies and nitrogen levels over two years.
MATERIAL AND METHODS
The experiment was conducted at the Experimental Station of Irrigation, Faculty of Agricultural Sciences at the Federal University of Grande Dourados, from May to September, 2012 and repeated from May to September, 2013.
The city of Dourados is located in southern Mato Grosso do Sul at a 430 m altitude (Boeni et al., 2014), 22º 13’ 16” south latitude and 54º 17’ 01” west longitude. According to Köppen, the region has a Cwa climate, i.e., humid mesothermal with hot summers and dry winters(Salton et al., 2014). The temperatures in the coldest month are below 18 °C, and those in the hottest month are over 22 °C. Average annual rainfall ranges from 1,250 mm to 1,500 mm.
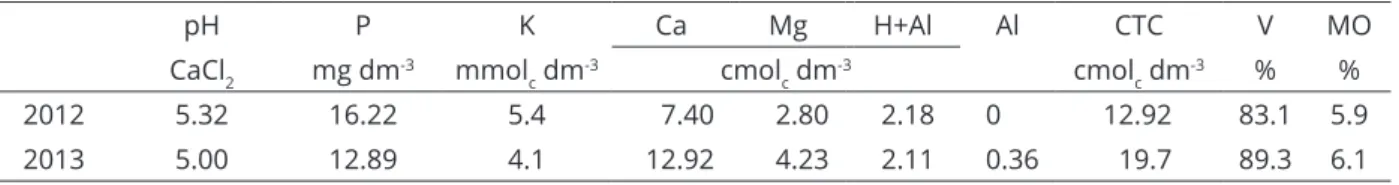
The soil was classified as red distroferric oxisol (Santos et al., 2013) at the Laboratory of Soil Science, Faculty of Agricultural Sciences, Federal University of Grande Dourados, with a soil sample from the 0.00-0.20 m layer. Chemical analysis included an examination of the pH level, macro- and micronutrients, cation-exchange capacity at pH 7 and base saturation index (Table 1).
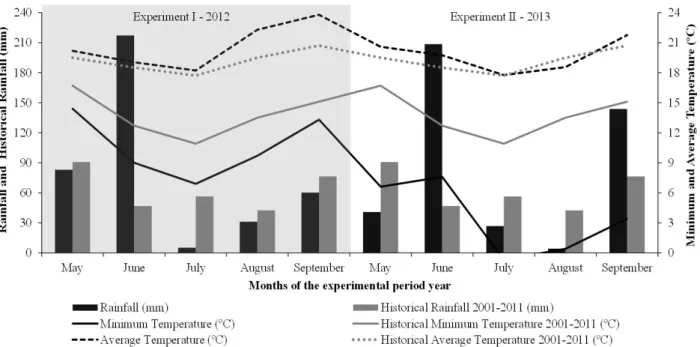
The environmental conditions were monitored by an automatic weather station located at the Embrapa Agropecuária Oust, in Dourados. Daily data of meteorological variables, such as minimum and average temperature (°C) and precipitation (mm) (Figure 1) were collected and compared with historical averages of meteorological information provided by Embrapa Agropecuária Oeste for the period of 2001 to 2011. Precipitation levels were higher than historical averages in June of 2012 and 2013 and in September of 2013. Total precipitation from May to September in both years was 563.4 mm, 307.2 mm in 2012 and 256.2 in 2013.
Average temperatures during crop development did not exceed 28 °C in 2012 and 26.2 °C in 2013, which were below the upper temperature limit for canola 29.5 °C (Kutcher; Warland; Brandt, 2010; Robertson et al., 2013). However, minimum temperatures below zero, -0.5 and -0.7 °C, were found 78 and 79 days after sowing in 2013, corresponding to the full-flowering period. The lower temperature limit for this developmental stage is 6.4 °C (Singh et al., 2008).
We used a randomized block split plot design with four repetitions, totaling 60 experimental plots. Three irrigation frequencies (without irrigation - SI, weekly irrigation - IS, irrigation three times per week - I3S) were used in the plots, whereas the subplots received five nitrogen levels (DN): 0, 30, 60, 90 and 120 kg ha-1 in 2012
and 0, 60, 120, 180 and 240 kg ha-1 in 2013. Urea was used
as a nitrogen source.
The plots were 3 m long x 1.8 m wide (5.4 m2) with
four plantation lines, 0.45 m between rows and 0.17 m between plants. The available plot size was the two central rows discarding 0.5 m from the ends, 1.8 m2 (0.9 mx 2 m); the remainder of the experimental plot was defined as the borders. Plots were 1.5 m apart.
Table 1: Chemical analysis of the soil at layer 0-0.20 m.
pH P K Ca Mg H+Al Al CTC V MO
CaCl2 mg dm-3 mmol
c dm
-3 cmol
c dm
-3 cmol
c dm
-3 % %
2012 5.32 16.22 5.4 7.40 2.80 2.18 0 12.92 83.1 5.9
Canola yield under different irrigation frequencies and nitrogen levels in the Brazilian Cerrado 369
We used Hyola 61, an early spring hybrid well suited for direct harvesting. Direct seeding was performed on May 7, 2012 and 2013. Sowing fertilization was implemented according to soil analysis for yielding 2.000 kg ha-1 using 200 kg ha-1 fertilizer
10-15-15.
After emergence and plant establishment, manual pruning was performed 21 days after sowing (DAS 21), when plants had two fully expanded true leaves (Chavarria et al., 2011). Nitrogen fertilization was performed when plants had four true leaves (24 DAS).
Weed control was done by hand, and insect control was performed annually through two applications of a benzoylurea insecticide and one application of pyrethroid; both dosages were 80 ml ha-1 to control Diabrotica speciosa (South American rootworm) and defoliate caterpillars.
The plots were irrigated by drip tapes installed between plant rows. Irrigation management was conducted by reading the water tension in soil tensiometers installed at a depth of 0.20 m. Irrigation depth (LI) was determined by the difference between volumetric water content at field capacity (Ѳcc), tension
corresponding with 10 kPa and current soil moisture (Ѳa) multiplied by the effective root depth, 0.40 m. Ѳa
values were estimated by the soil water retention curve adjusted by the Filgueiras (2016) equation:
where Ѳa = current soil moisture (cm
3 cm-3) and s
a = current
soil water tension (kPa).
Readings of soil water tension were made on Mondays, Wednesdays and Fridays. All treatments received 20 mm of irrigation before starting the treatments.
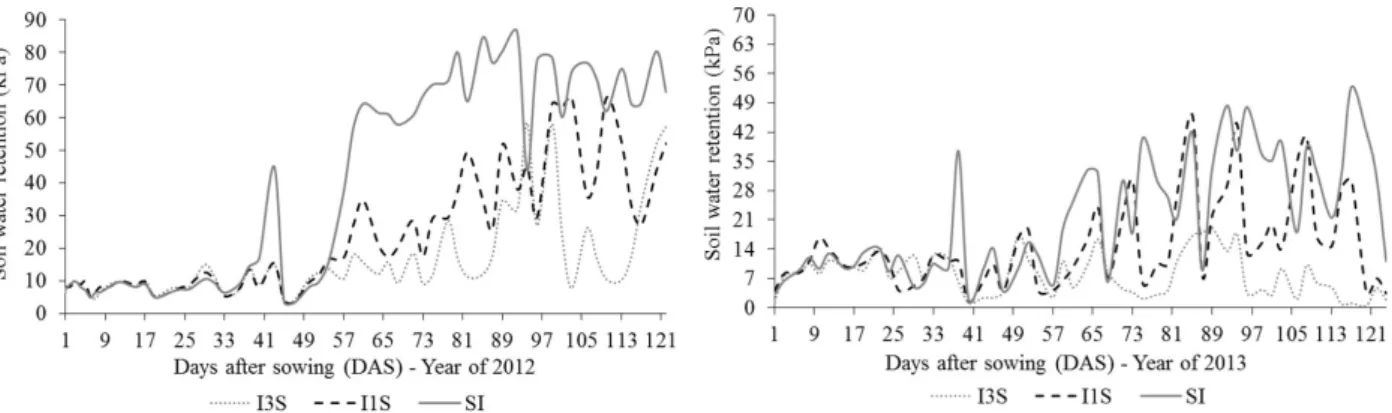
Values of soil water tensions during treatments differed throughout the experiment (Figure 2). In treatments where irrigation was performed more frequently, three times a week (I3S), and soil water tension remained close to field capacity. In non-irrigated (SI) treatments, water deficit increased soil water tension, which means a higher depletion of water in the soil especially after crop full flowering, when rainfall decreased (Figure 1 and Table 2).
During the experimental period, the plots irrigated three times per week received more irrigation procedures, 29 in 2012 and 18 in 2013 (Table 2).
In 2012, the deepest irrigation, 166.3 mm, was found in the third stage of crop development, between the stage of full flowering and physiological maturity. The bulk of natural precipitation in both 2012 and 2013 was recorded between sowing and crop flowering (Table 2).
Figure 1: Precipitation values (mm), values of minimum, average and maximum temperature (°C) during the experimentalperiod of canola and their historical averages for 2001-2011.
(
)
(
)
(
)
2 0.026 19.322
0.589 0.200
0.200 ; 0.99 0.01
1 0.5485 a
a R e P
θ
s
−
= + = 〈
+
Most cultures are more sensitive to water stress between flowering and grain filling (Dogan et al., 2011; Dogan; Kirnak; Copur, 2007; Hamzei; Soltani, 2012).
At the end of each experimental cycle we evaluated the morphological components, namely, plant height (cm), number of branches and aboveground dry weight (g plant-1), and the productive components, namely, number
of pods, thousand grain weight (g), grain yield (kg ha-1),
oil content of grain (%) and oil yield (kg ha-1).
The components were subjected to an analysis of variance at 5% probability. In cases of significant differences, we applied the Tukey test for irrigation frequencies and conducted a regression analysis for nitrogen levels.
RESULTS AND DISCUSSION
All components were affected by different irrigation frequencies except for the number of branches
and the number of pods in 2012 (p>0.01). When the influence of nitrogen on morphological components was analyzed, only dry matter was affected in 2012, and the number of branches was not affected in 2013. Productive components, thousand grain weight and oil content were affected by nitrogen rates in 2012, and the opposite occurred in 2013.
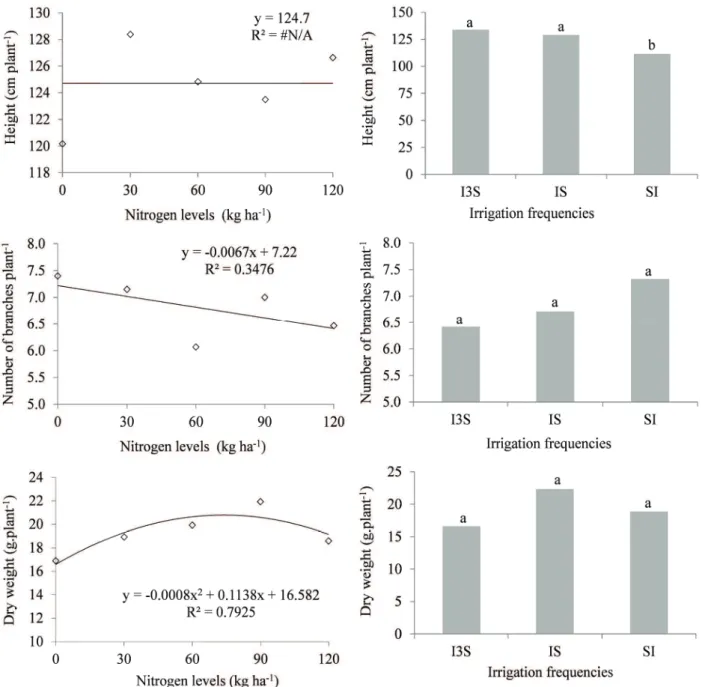
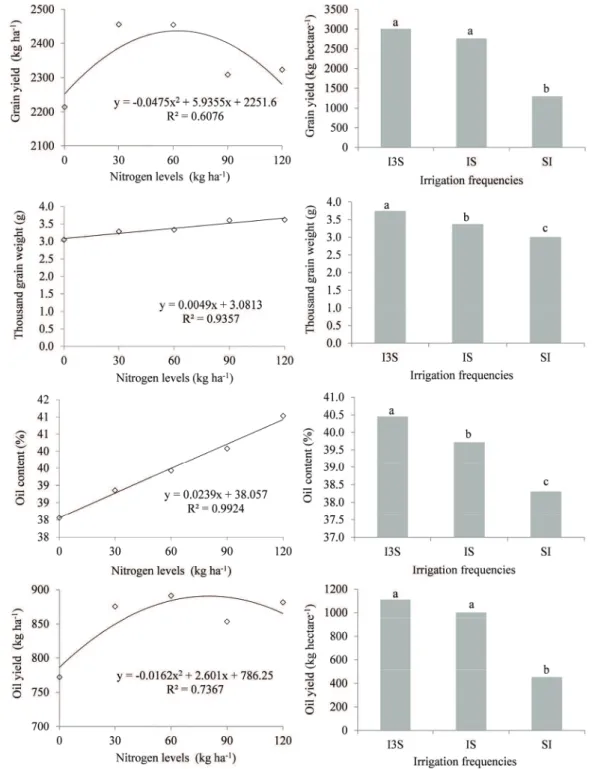
Morphological and productive components of canola are generally affected by irrigation (Figure 3). Bilibio et al. (2011), Dogan et al. (2011), Kamkar et al. (2011) and Sharghi et al. (2011) studied the effects of different levels of water stress (0, 30 and 60% of canola crop evapotranspiration) and found that number of branches, number of pods, dry weight, yield and oil content were significantly affected. Istanbulluoglu et al. (2010) evaluated the effect of supplemental irrigation applied at different stages of canola development and found
Figure 2: Values of soil water tension in the canola crop considering different irrigation frequencies in experiment 1 (2012) and experiment 2 (2013).
Table 2: Irrigation depths (mm) and rainfall during the experiment. UFGD, Dourados-MS, 2012/2013.
DAS Phenological (stages) (mm)I3S (nº)EI (mm)IS (nº)EI (mm)P
2012
01 - 67 Phase I 83.4 12 37.1 3 303.6
68 - 89 Phase II 95.3 8 102.8 4 1.6
90 - 114 Phase III 166.3 9 117.8 4 2
Total 345 29 257.7 11 307.2
2013
01 - 67 Phase I 55.9 11 48.2 6 225.4
68 - 89 Phase II 41.2 4 23.9 2 26.6
90 - 114 Phase III 19.5 3 95.3 4 4.2
Total 116.5 18 167.3 12 256.2
Canola yield under diff erent irrigation frequencies and nitrogen levels in the Brazilian Cerrado 371
signifi cant differences in morphological components, yield and oil content but not in thousand grain weight.
The overall averages for morphological components in 2012 were as follows: plant height: 124.31 cm, number of branches: 6.81, dry weight of shoots: 19.24 g plant-1
or 7271.73 kg ha-1. Overall averages for productive
components were: number of pods: 156.71 plant-1, yield:
2351.21 kg ha-1, thousand grain weight: 3.37 g, oil content
39.49% and oil yield: 854.81 kg ha-1. Already, in 2013,
the overall averages for morphological components were as follows: plant height: 93.96 cm, number of branches: 26.46; dry weight of shoots: 71.74 g plant-1 or 27,102.09
kg ha-1. The overall averages for productive components
were as follows: number of pods: 399.26 plant-1, yield:
1513.79 kg ha-1, thousand grain weight: 2.70 g, oil content
19.30%, oil yield: 406.39 kg ha-1.
The averages found in both years closely match the results of Bilibio et al. (2011) in a study of canola under
different levels of water deficit. The authors obtained the following average components: plant height: 117.53 cm plant-1, number of branches: 9.76 plant-1, number of pods:
353.85 plant-1, dry weight: 41.53 g plant-1, yield: 7.89 g
plant-1 equivalent to 3.156 kg ha-1 and oil content: 37.75%. The data also agree with the findings of Dogan et al. (2011) in a study conducted with supplemental irrigation. The authors found average plant heights of 147.7 and 164 cm in the first year and 141.3 and 159 cm in the second year of the experiment. The authors also found a thousand grain weight ranging from 2.8 to 3.3 g in 2006-2007 and from 2.5 to 3.2 g in 2008-2009. Productivity in 2006-2007 was 1,094 to 3,944 kg ha-1, and that in 2008-2009 was 1,333
to 3,880 kg ha-1. The lower values refer to non-irrigated
treatments, whereas the larger values refer to treatments receiving supplemental irrigation corresponding to 100% of Class A pan evaporation.
Regarding different levels of nitrogen, we found significant differences in dry weight, thousand grain weight and oil content in 2012 (Table 3). In 2013, the components plant height, number of pods, dry weight and yield were significantly influenced by different levels of nitrogen (Figure 3 and Figure 4).
Beaudette et al. (2010) evaluated the effect of different cropping systems and nitrogen levels (0, 40, 80 and 120 kg N ha-1) on the yield of four canola cultivars in
Canada. The highest productivity was obtained at a level of 80 kg ha-1, equivalent to 2.800 kg ha-1. However, unlike us,
those authors found that the oil content of grain decreased as the amount of nitrogen increased, which was offset by an increase in crop yield.
Hamzei and Soltani, (2012) evaluated the effect of different regimes of irrigation and nitrogen levels on the dry weight of shoots and the yields of canola in Iran. The authors found that the parameters were significantly influenced by the different treatments applied: 80 kg N ha-1,
120 kg N ha-1 and 160 kg N ha-1. The application of 120
kg N ha-1 provided maximum grain yield, 3.250 kg ha-1.
Werner et al. (2013) evaluated the effect of different levels of nitrogen ranging from 0 to 75 kg N ha-1 on the
vegetative and productive components of canola in Paraná, Brazil. The authors found no significant difference between parameters except for the oil content of grain, which decreased with increasing nitrogen levels.
Significant interactions between irrigation frequencies and nitrogen levels were found only for thousand grain weight and oil content in 2012 and for the number of pods in 2013. Kamkar et al. (2011) found a significant interaction for different irrigation regimes and nitrogen levels only for grain yield.
Through regression analysis for different nitrogen levels applied in 2012, we found that variation in dry weight (g plant-1) can be explained by a quadratic model,
as shown in Figure 4, indicating that dry weight increased as the nitrogen level increased. The highest dry weight was obtained with 90 kg nitrogen ha-1, equivalent to an average
dry weight of 21.91 g plant-1.
Variation in the thousand grain weight and oil content at different nitrogen levels can be explained by linear regression (Figure 4). The thousand grain weight increased by 0.0049 grams for each unit change in nitrogen level, while the oil content of grains increased by 0.0239% for each unit change.
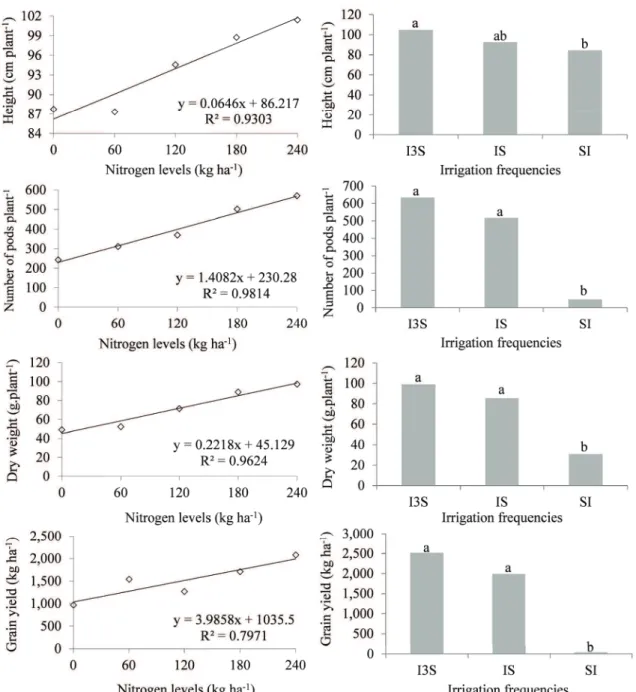
In addition, regression analysis regarding different nitrogen levels applied in 2013 showed that changes in plant height, number of pods, dry weight and yield can be explained by a linear regression regarding the treatments, as shown in Figure 5. Plant height increased by 0.0646 cm for each unit change in nitrogen level, while the number of pods increased by 1.4082 pods plant-1 for each unit change. Finally,
dry weight had an increase of 0.2218 grams for each unit change in nitrogen level, while yield increased by 3.9858 kg of grains for each unit change. Beaudette et al (2010) found a linear equation between grain yield and levels of nitrogen in a study conducted in Canada. The highest yield was 2,800 kg ha-1, obtained with 80 kg ha-1 of nitrogen.
Conjoint analysis of the experiments carried out in 2012 and 2013 (Table 3) showed no significant effect on the variables of plant height and yield. However, there was a significant difference between 2012 and 2013 for the number of branches, number of pods, dry weight of shoots and thousand grain weight. Dogan et al. (2011) found no significant difference between the years 2006-2007 and 2008-2009 with supplementary irrigation for plant height and yield of canola in Turkey. Sharghi et al. (2011) found no significant difference in grain yield and number of grains per pod of canola subjected to two irrigation schemes (irrigation after evaporation of 60 mm of water in Tank Class A and discontinuation of irrigation at flowering) for two years, 2008-2009 and 2009-2010, in Iran.
The highest average yield of canola, 2,613.83 k ha-1, was obtained with irrigation, especially when the
irrigation was applied more frequently, i.e., three times a week. Similar results were obtained by Hamzei and Soltani (2012), who found higher yields of canola, 3,640 kg ha-1
and 3,960 kg ha-1 with 4,500 m3 and 7,500 m3 of water ha-1,
respectively, compared to a yield of 2,130 kg ha-1 with 3,000
m3 of water ha-1. Istanbulluoglu et al. (2010) observed higher
Canola yield under different irrigation frequencies and nitrogen levels in the Brazilian Cerrado 373
Year Irrigation Nitrogen levels
I3S IS NI 0 60 120
Plant height (cm)
2012 133.41a 129.50a 107.50b 119.83a 124.41a 126.16a
2013 104.00a 86.75ab 78.91b 87.75a 87.33a 94.58a
Average 2 years 118.70a 108.12a 93.20b 103.79a 105.87a 110.37a
Number of branches
2012 6.36aB 6.46aB 7.10aA 7.40aB 6.06aB 6.46aB
2013 27.08aA 38.91aA 8.50bA 19.33aA 28.41aA 26.750aA
Average 2 years 16.72b 22.69a 7.80c 13.36a 17.24a 16.60a
Number of pods
2012 141.16aB 177.88aB 153.05aA 158.56aB 161.51aB 152.01aB
2013 501.25aA 385.41aA 37.66bB 242.91bA 311.25abA 370.16aA
Average 2 years 321.20a 281.65a 95.35b 200.74b 236.38ab 261.09a
Dry weight (g plant-1)
2012 16.25bB 20.80aB 18.34abA 16.89bB 19.92aB 18.59abB
2013 74.04aA 75.12aA 23.44bA 49.01aA 52.25aA 71.33aA
Average 2 years 45.14a 47.96a 20.89b 32.95b 36.08ab 44.96a
Yield (kg ha-1)
2012 2999.33a 2730.42a 1262.04b 2214.21a 2454.42a 2323.15a
2013 2228.33a 1520.37a 30.92b 968.61b 1541.75a 1269.25ab
Average 2 years 2613.83a 2125.39b 646.48c 1591.41b 1998.09a 1796.20ab
Thousand grain weight (g)
2012 3.71aA 3.32bA 2.94cA 3.04c 3.33b 3.61a
2013 3.77aA 3.30aA 0.90bB 2.53a 2.97a 2.47a
Average 2 years 3.74a 3.31a 1.92b 2.78a 3.15a 3.04a
Oil content (%)
2012 40.64aA 39.56bA 38.31cA 38.05c 39.42b 41.03a
2013 28.44aA 28.83aA 0.00bB 19.77a 20.14a 17.36a
Average 2 years 34.54a 34.19a 19.15b 28.91a 29.78a 29.19a
Oil yield (kg ha-1)
2012 1115.50a 986.75a 442.77b 772.14a 891.29a 881.60a
2013 581.95a 440.34a 0.00b 258.36b 424.82a 339.11ab
Average 2 years 848.73a 713.55a 221.38b 515.25b 658.05a 610.35ab
Table 3: Morphological and productive components of canola cultivation in two years.
On the other hand, the lowest yield (30.92 kg ha-1)
was obtained in non-irrigated plots during the second year. This is due to reduced water stress as a result of natural rainfall and the occurrence of frost during fl owering;
these are the factors that compromised grain yield in this treatment. Takashima et al. (2013) also found that the occurrence of frost during fl owering is one of the main factors limiting canola development in Argentina.
Canola yield under diff erent irrigation frequencies and nitrogen levels in the Brazilian Cerrado 375
Figure 5: Effect of different nitrogen levels and irrigation frequencies on the morphological components of canola.
CONCLUSIONS
Additional irrigation should be used in the Brazilian Cerrado to ensure a maximum yield potential of canola, as the highest grain yield in this study, 2,999.33 kg ha-1, was
obtained through irrigation performed three times a week. Canola yields demonstrated a positive result with increasing levels of nitrogen, which shows the importance of using
this nitrogen for achieving high levels of grain yield and oil. Considering two years of evaluation, the highest grain yield was obtained with 60 kg ha-1 of nitrogen.
ACKNOWLEDGMENTS
FRANÇA, J. et al. Avaliação de ingredientes convencionais e
alternativos em rações de cães e gatos. Revista Brasileira de Zootecnia, 40:222-231, 2011.
HAMZEI, J.; SOLTANI, J. Deficit irrigation of rapeseed for water-saving: Effects on biomass accumulation, light interception and radiation use efficiency under different N rates. Agriculture, Ecosystems & Environment, 155:153-160, 2012.
ISTANBULLUOGLU, A. et al. Effects of deficit irrigation regimes on the yield and growth of oilseed rape (Brassica napus L.).
Biosystems Engineering, 105(3):388-394, 2010.
KAEFER, J. E. et al. Produtividade de grãos e componentes
de produção da canola de acordo com fontes e doses de nitrogênio. Pesquisa Agropecuária Brasileira, 49(4):273-280, 2014.
KAMKAR, B. et al. The effects of irrigation regimes and nitrogen rates on some agronomic traits of canola under a
semiarid environment. Agricultural Water Management,
98(6):1005-1012, 2011.
KUTCHER, H. R.; WARLAND, J. S.; BRANDT, S. A. Temperature and precipitation effects on canola yields in Saskatchewan,
Canada. Agricultural and Forest Meteorology,
150(2):161-165, 2010.
MILAZZO, M. F. et al. Brassica biodiesels: Past, present and
future. Renewable and Sustainable Energy Reviews,
18:350-389, 2013.
MOHAMMADI, K.; ROKHZADI, A. An integrated fertilization system of canola (Brassica napus L.) production under
different crop rotations. Industrial Crops and Products,
37(1):264-269, 2012.
MOUSAVI-AVVAL, S. H. et al. Energy flow modeling and sensitivity analysis of inputs for canola production in Iran.
Journal of Cleaner Production, 19(13):1464-1470, 2011.
PAVLISTA, A. D. et al. Adaptability of irrigated spring canola oil
production to the US High Plains. Industrial Crops and
Products, 33(1):165-169, 2011.
ROBERTSON, S. M. et al. Estimating yield response to temperature and identifying critical temperatures for
annual crops in the Canadian prairie region. Canadian Journal of Plant Science, 93(6):1237-1247, 2013.
SALTON, J. C. et al. Integrated crop-livestock system in tropical Brazil: Toward a sustainable production system.
Agriculture, Ecosystems & Environment, 190:70-79, 2014.
REFERENCES
BEAUDETTE, C. et al. Tree-based intercropping does not compromise canola (Brassica napus L.) seed oil yield
and reduces soil nitrous oxide emissions. Agriculture, Ecosystems & Environment, 139(1):33-39, 2010.
BERGAMIN, G. T. et al. Fontes protéicas vegetais na alimentação
da carpa húngara. Ciência Rural, 41(9):1660-1666, 2011.
BERGMANN, J. et al. Biodiesel production in Brazil and
alternative biomass feedstocks. Renewable and Sustainable Energy Reviews, 21:411-420, 2013.
BILIBIO, C. et al. Effect of different levels of water deficit on rapeseed (Brassica napus L.) crop. Ciência e Agrotecnologia,
35(4):672-684, 2011.
BOENI, M. et al. Organic matter composition in density fractions of Cerrado Ferralsols as revealed by CPMAS 13C NMR: Influence of pastureland, cropland and integrated crop-livestock. Agriculture, Ecosystems & Environment,
190:80-86, 2014.
CHAVARRIA, G. et al. Índice de área foliar em canola cultivada sob variações de espaçamento e de densidade de
semeadura. Ciência Rural, 41(12):2084-2089, 2011.
COMPANHIA NACIONAL DE ABASTECIMENTO - CONAB. Acompanhamento da Safra Brasileira Grãos. Nono Levantamento, 2:109, 2015.
DOGAN, E. et al. Supplemental irrigation effect on canola yield components under semiarid climatic conditions.
Agricultural Water Management, 98(9):1403-1408, 2011.
DOGAN, E.; KIRNAK, H.; COPUR, O. Deficit irrigations during soybean reproductive stages and CROPGRO-soybean simulations under semi-arid climatic conditions. Field Crops Research, 103(2):154-159, 2007.
EL-HOWEITY, M. A.; ASFOUR, M. M. Response of some varieties of canola plant (Brassica napus L.) cultivated in a newly reclaimed desert to plant growth promoting rhizobacteria
and mineral nitrogen fertilizer. Annals of Agricultural Sciences, 57(2):129-136, 2012.
FARAJI, A. et al. Seed yield and water use efficiency of canola (Brassica napus L.) as affected by high temperature stress and supplemental irrigation. Agricultural Water
Management, 96(1):132-140, 2009.
Canola yield under different irrigation frequencies and nitrogen levels in the Brazilian Cerrado 377
SANTOS, H. G. dos et al. Sistema brasileiro de classificação de solos. 3. ed. Brasília-DF: Embrapa, 353p, 2013.
SHARGHI, Y. et al. Yield and yield components of six canola (Brassica napus L.) cultivars affected by planting date and
water deficit stress. African Journal of Biotechnology,
10(46):9309-9313, 2011.
SINGH, S. K. et al. Assessment of cold and heat tolerance of winter-grown canola (Brassica napus L.) cultivars by
pollen-based parameters. Journal of Agronomy and Crop Science, 194(3):225-236, 2008.
SPRAGUE, S. J. et al. Crop and livestock production for dual-purpose winter canola (Brassica napus) in the high-rainfall zone of south-eastern Australia. Field Crops Research, 156:30-39, 2014.
TAKASHIMA, N. E. et al. Environmental factors affecting yield
variability in spring and winter rapeseed genotypes
cultivated in the southeastern Argentine Pampas.
European Journal of Agronomy, 48:88-100, 2013.
TOHIDI-MOGHADAM, H. R. et al. Response of six oilseed rape genotypes to water stress and hydrogel application 1.
Pesquisa Agropecuaria Tropical, 39(3):243-250, 2009. WERNER, O. V. et al. Nitrogen and sulfur applied to the coverage
of a canola crop in no-tillage system. African Journal of Agricultural Research, 8(17):1799-1803, 2013.