Revista Brasileira de
Engenharia Agrícola e Ambiental
Campina Grande, PB, UAEA/UFCG – http://www.agriambi.com.br
v.20, n.9, p.856-861, 2016
Productive performance and industrial quality
of wheat genotypes grown in two environments
Omar Possatto Junior
1, Marcos V. Faria
2, Marcelo C. Mendes
2,
Evandrei S. Rossi
1, Rodrigo Oliboni
3& Amarilis L. Barcellos
3DOI: http://dx.doi.org/10.1590/1807-1929/agriambi.v20n9p856-861
A B S T R A C T
Wheat flour can be allocated for manufacturing various products, but each purpose requires specificities defined by the industrial quality. The objective of this study was to evaluate the performance of experimental lines and commercial cultivars of wheat, in South and Southeast of Brazil and to identify genotypes with favorable characteristics of industrial quality. Twenty lines in the stage of cultivation and use and three commercial cultivars were evaluated for grain yield components (hectoliter weight and thousand-grain weight) and features related to the industrial quality of the flour (protein, flour stability, sedimentation with sodium dodecyl sulfate and color). The genotypes CRX/CD104//ALC, LAJ96010/JSP//ALC and CRX/ALC// ALC showed favorable characteristics for biscuit production, while the genotypes ORL97061/ ORL00241//CD104, SUZ6/WEAVER//TUI/3/SUP/4/CD104, ORL99396/ORL97061// SUP, CRX/CD104//ALC, ORL98231/IOR00131//ÔNIX, ORL94346/ALC//AVT/3/ÔNIX, CEP0033/ÔNIX/3/ÔNIX*2//TC14/2*SPEAR, Campo Real/VAN//ÔNIX, ORL97061/CD 104 and PMP/ORL98231//CRX have aptitude for baking. The evaluations were efficient for the classification and selection of genotypes in the wheat breeding program.
Desempenho produtivo e qualidade industrial
de genótipos de trigo cultivados em dois ambientes
R E S U M O
A farinha de trigo pode ser destinada à fabricação de diversos produtos porém para cada finalidade são exigidas especificidades definidas pela qualidade industrial. Objetivou-se, com este estudo, avaliar o desempenho de linhagens experimentais e cultivares comerciais de trigo nas regiões Sul e Sudeste do Brasil e identificar genótipos com características favoráveis à qualidade industrial. Foram avaliadas 20 linhagens em fase de cultivo e uso e três cultivares comerciais. Avaliaram-se os componentes de produtividade de grãos (massa hectolitro e de mil grãos) e as características relacionadas à qualidade industrial da farinha como proteína, estabilidade, sedimentação com dodecil sulfato de sódio e cor. Os genótipos CRX/CD104// ALC, LAJ96010/JSP//ALC e CRX/ALC//ALC exibiram atributos favoráveis à produção de biscoito enquanto os genótipos ORL97061/ORL00241//CD104, SUZ6/WEAVER//TUI/3/ SUP/4/CD104, ORL99396/ORL97061//SUP, CRX/CD104//ALC, ORL98231/IOR00131// ÔNIX, ORL94346/ALC//AVT/3/ÔNIX, CEP0033/ÔNIX/3/ÔNIX*2//TC14/2*SPEAR, Campo Real/VAN//ÔNIX, ORL97061/CD 104 e PMP/ORL98231//CRX expressam aptidão para panificação. As avaliações realizadas foram eficientes para classificação e seleção dos genótipos no programa de melhoramento genético da cultura do trigo.
Key words:
Triticum aestivum L. wheat breeding flour quality
Palavras-chave:
Triticum aestivum L. melhoramento genético qualidade da farinha
1 Universidade Estadual de Maringá/Programa de Pós-Graduação em Genética e Melhoramento de Plantas. Maringá, PR. E-mail: [email protected]
(Corresponding author); [email protected]
2 Universidade Estadual do Centro-Oeste/Departamento de Agronomia/Programa de Pós-graduação em Agronomia. Guarapuava, PR. E-mail:
[email protected]; [email protected]
3 OR Melhoramento de Sementes. Passo Fundo, RS. E-mail: [email protected]; [email protected]
Introduction
Wheat can be destined to the manufacturing of various food products such as breads, cakes and biscuits, but each purpose requires a specific type of flour, which is defined by the industrial quality (Brasil, 2010).
Wheat flour quality depends on genetic factors, genes that synthesize proteins with high molecular weight, gluten strength and environmental factors, such as geographic coordinates (altitude, latitude and longitude), rainfall and temperature, which interfere with the physiological responses of the crop (Monteiro, 2009).
Wheat grains may have from 6 to 21% of proteins, in which gliadin and glutenin are responsible for the functional characteristics of the dough, since they form gluten after moistening. After kneaded, gluten forms a viscoelastic dough that is insoluble in water and has the capacity to retain the CO2 from fermentation, promoting the expansion of the dough (Gutkoski et al., 2007).
Protein content and quality have direct action on the industrial quality of the flour (Costa et al., 2008). Flour quality is evaluated through a series of characteristics, such as thousand-grain weight, hectoliter weight, protein content, mixography, sedimentation with sodium dodecyl sulfate (SDS) and color. The evaluation of these characteristics is low-cost and provides estimates of the industrial quality of wheat flours (Gutkoski et al., 2011a).
This study aimed to evaluate the performance of experimental lines and commercial cultivars of wheat in the South and Southeast regions of Brazil and to identify genotypes with favorable characteristics for the industrial quality of the flour.
Material and Methods
Two field experiments were carried out; the first one in Nova Fátima-PR (23º 25' 56" S; 50º 33' 50" W; 673 m) and the second one in Cruzália-SP (22º 44' 08" S; 50º 47' 37" W; 318 m), both belonging to the region 3 of wheat adaptation (hot region, moderately dry and with low altitude < 800 m).
The same biological materials relative to 20 lines, in cultivation value and use (CVU) stage, and three controls (Table 1) were evaluated in each cultivation environment. The lines were obtained from crosses and selections directed to the region 3 of wheat adaptation. The control genotypes were Quartzo, Topázio and Ametista, for having high yield, resistance to the main diseases and considered as bread-type and improver (grains of genotypes with high protein content, gluten strength and stability).
The experiments were conducted in a randomized block design (RBD), with three replicates, the plots consisted of seven 4.0-m long rows spaced by 0.17 m, and sowing was performed in a no-till system.
Basal fertilization was performed according to soil analysis and top-dressing fertilization with 120 kg ha-1 of nitrogen (N)
in the form of urea. The experiments were harvested with a plot harvester (Wintersteiger®).
Thousand-grain weight (TGW) was obtained on a precision scale and the hectoliter weight (HW) on a hectoliter scale of
one quarter of liter (Motomco®). For the estimate of grain yield (GY), the mass of the plots was measured on a precision scale and transformed to kg ha-1, with correction of moisture
to 13% (Brasil, 2009).
The industrial quality analyses of the flour were performed using a 1-kg grain sample collected in each plot, from which a 200-g subsample was obtained and ground in a mill (Cyclone Sample Mill) with rotation of 10,000 RPM.
Protein content in the grains was determined using the device NIR Inframatic 9200, which determines the amount of protein through near-infrared radiation, with wavelength of 780-2,500 nm (AACC, 2000).
Mixograph analysis was performed using a Swanson mixer (National Manufacturing Division). The amounts of flour and water were determined through formulas, following the methodology of AACC (2000).
First, flour absorption of the plots was determined in percentage, through Eq. 1.
Table 1. Genealogy of lines and commercial controls of wheat
Line Genealogy
L 1 ORL97061/ORL00241//CD104 L 2 SUZ6/WEAVER//TUI/3/SUP/4/CD104 L 3 ORL99396/ORL97061//SUP L 4 ÔNIX/3/ALC/ÔNIX//ÔNIX/4/SUP
L 5 CRX/CD104//ALC
L 6 CRX/CD104//ALC
L 7 ALC/ÔNIX//VAN/4/ÔNIX/3/ALCÔNIX//ÔNIX L 8 ALC/ÔNIX//VAN/4/ÔNIX/3/ALC/ÔNIX//ÔNIX L 9 ORL98231's'/TAU//ALC/3/ALC
L 10 ORL98231/IOR00131//ÔNIX
L 11 ORL00353/ABA
L 12 BR35/ROND//95305/3/ALC/4/ALC L 13 LAJ96010/JSP//ALC
L 14 CD104/IOR9817//PMP
L 15 CRX/ALC//ALC
L 16 ORL94346/ALC//AVT/3/ÔNIX
L 17 CEP0033/ÔNIX/3/ÔNIX*2//TC14/2*SPEAR L 18 Campo Real/VAN//ÔNIX
L 19 ORL97061/CD 104
L 20 PMP/ORL98231//CRX Quartzo ONIX/AVANTE
Topázio PAMPEANO"S"/ABALONE Ametista PF950351/ABA//ÔNIX
abs%=protein 1.5 43.6× +
Then, the amount of flour (AF) was calculated using Eq. 2.
(
)
(
)
100 14
AF 100
100 flour moisture
−
= ×
−
Lastly, the amount of water (AW) was calculated using Eq. 3.
(
)
abs%
AW 10 10 AF
100
= × + −
The test of sedimentation with sodium dodecyl sulfate (SDS) required the preparation of two solutions (A and B). Solution A consisted of 20 g of sodium lauryl-sulfate for 1 L of distilled water and solution B consisted of 10 mL of 90% lactic (1)
(2)
acid for 80 mL of distilled water. The reagent was obtained through the mixture of 1 L of solution A and 20 mL of solution B, according to the methodology of AACC (2000).
After obtaining the reagent, the analysis was performed in a 100 mL graduated cylinder, by mixing 3.2 g of flour and 50 mL of distilled water, with agitation for 2 and 4 min. 4 min after agitation, 50 mL of reagent were added. The graduated cylinder was slowly inverted, at 6, 8 and 10 min, and placed on a support for the reading of the sedimented material, at 20 and 25 min.
Color was determined using the chroma meter device Minolta® CR 310. According to the 14-22 method of the AACC
(2000), two readings were performed per sample. The samples were evaluated for luminosity from zero (black) to 100 (white), chromaticity coordinate a*, whose negative value represents tendency to the green color and positive value, a tendency to the red color, and chromaticity coordinate b*, whose negative value shows tendency to the blue color and positive value to the yellow color.
The data were subjected to individual analysis of variance. Joint analysis of variance was performed after confirmation of homoscedasticity through the Hartley test and normality of errors. The means were grouped through the Scott Knott test (p < 0.05) using the computational program GENES (Cruz, 2013).
Results and Discussion
The joint analysis of variance indicates, for genotypes, environments and the interaction of genotypes x environments, that there was significant effect on the indicated variables (Table 2). The coefficients of variation were adequate for all evaluated characteristics, demonstrating good experimental precision (Brasil, 2010).
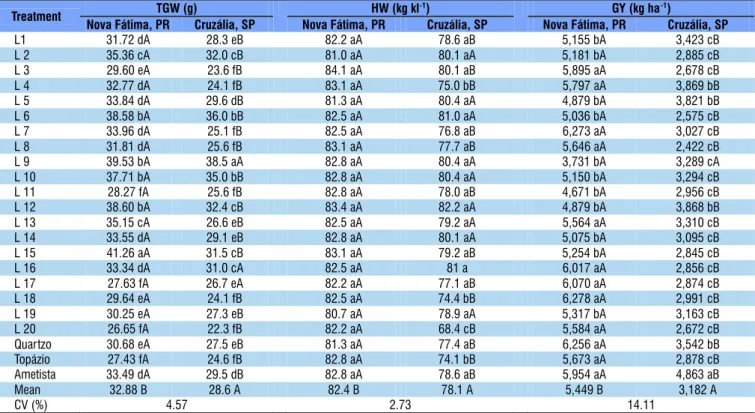
For the thousand-grain weight (TGW) in Nova Fátima, the genotype L15 stood out and it was statistically superior to the others. In Cruzália, the genotype L9 stood out and showed the highest TGW; these genotypes demonstrate good grain filling (Table 3).
Most of the genotypes showed better TGW in the environment of Nova Fátima; however, the genotypes L9, L16 and L17 did not differ statistically for the cultivation environments, demonstrating that the environment did not influence the gain in TGW for these genotypes, i.e., there was no significant interaction between the environment and these genotypes (Table 3). This fact is explained by the genetic divergence between the genotypes and by the interaction of genotypes x environments, as reported by Silva et al. (2011).
For hectoliter weight (HW), in Nova Fátima, there was no significant difference between the genotypes. In Cruzália, the genotype L20 showed the lowest value of HW, significantly differing from the others (Table 3). The same genotype also showed the lowest TGW.
According to the Normative Instruction Nº 39 of the Ministry of Agriculture, Livestock and Supply – MAPA (Brasil, 2010), wheats with HW value above 78.0 kg kl-1 are classified as
type 1; thus, only eight genotypes in Cruzália are not classified as type 1; all genotypes in Nova Fátima are classified as type 1 (Table 3).
HW is an important measurement in the wheat crop, since it is directly associated with baking quality. Schmidt et al. (2009) reported correlation between HW and the falling number, inferring that wheats with high HW have better industrial quality, and observed great variation of HW among wheat genotypes that represent the main wheat regions in South Brazil.
Despite the genetic differences of the genotypes, the variation in HW is also influenced by environmental factors such as N availability, number of grains per ear, number of tillers and rainfall during physiological maturation, among others (Rossi et al., 2013).
As to grain yield, most of the genotypes were superior in Nova Fátima; however, the genotype L9 did not differ statistically between the environments, but with low GY. Possibly, this genotype does not respond to the better environmental condition observed in Nova Fátima (Table 3).
In Cruzália, SP, the cultivar Ametista stood out with the highest GY (4,863 kg ha-1), significantly surpassing the others.
The genotypes L4, L5, L12 and Quartzo did not differ and remained in the second classification group. In Nova Fátima-PR, the genotypes L3, L4, L7, L8, L13, L16, L17, L18 and L20 showed the highest GY, but did not differ from the controls Quartzo, Ametista and Topázio (Table 3).
The higher GY in Nova Fátima can be influenced by the altitude, since the cold and humid region is found at higher altitudes, which promotes favorable condition to the definition of the number of grains per area, one of the main GY components. This condition is obtained by the relationship between solar radiation and temperature (photothermal quotient) in the period from before anthesis until after flowering, making the environments with high altitudes favorable to wheat cultivation, showing higher GY and low variability between seasons (Monteiro, 2009).
Regarding proteins (PROT), the wheat produced by all genotypes cultivated in Cruzália-SP showed higher protein contents, with variation of 13.7 to 16.9%. The genotypes L8
*,**Significant at 0.05 and 0.01 probability level; SV – Source of variation; DF – Degree of freedom; CV – Coefficient of variation
SV DF Mean square
TGW HW GY PROT FS SDS L* a* b*
Block 4 16.26 6.4 1,532,538.62 0.38 0.82 16.49 2.18 0.51 2.28
Genotype (G) 22 94.50* 15.03** 973,870.08** 2.78** 74.00** 337.25** 5.5** 0.78** 3.54** Environment (E) (A) 1 695.74* 626.13** 177,310,004.52** 96.66** 1,085.84** 665.28** 55.37** 3.92** 39.78** G x E 22 9.51** 14.08** 1,033,157.11** 0.39* 43.02** 90.99** 1.27** 0.31** 0.44**
Error 88 1.99 4.79 371,070.47 0.21 0.8 4.4 0.26 0.08 0.19
CV% 4.57 2.73 14.11 3.15 7.16 3.41 0.59 12.36 3.98
Table 2. Summary of the joint analysis of variance of thousand-grain weight (TGW), hectoliter weight (HW), grain yield
Means followed by equal letters, uppercase in rows and lowercase in columns, for each characteristic, constitute a statistically homogeneous group by the Scott Knott test (p < 0.05)
Treatment TGW (g) HW (kg kl
-1) GY (kg ha-1)
Nova Fátima, PR Cruzália, SP Nova Fátima, PR Cruzália, SP Nova Fátima, PR Cruzália, SP
L1 31.72 dA 28.3 eB 82.2 aA 78.6 aB 5,155 bA 3,423 cB
L 2 35.36 cA 32.0 cB 81.0 aA 80.1 aA 5,181 bA 2,885 cB
L 3 29.60 eA 23.6 fB 84.1 aA 80.1 aB 5,895 aA 2,678 cB
L 4 32.77 dA 24.1 fB 83.1 aA 75.0 bB 5,797 aA 3,869 bB
L 5 33.84 dA 29.6 dB 81.3 aA 80.4 aA 4,879 bA 3,821 bB
L 6 38.58 bA 36.0 bB 82.5 aA 81.0 aA 5,036 bA 2,575 cB
L 7 33.96 dA 25.1 fB 82.5 aA 76.8 aB 6,273 aA 3,027 cB
L 8 31.81 dA 25.6 fB 83.1 aA 77.7 aB 5,646 aA 2,422 cB
L 9 39.53 bA 38.5 aA 82.8 aA 80.4 aA 3,731 bA 3,289 cA
L 10 37.71 bA 35.0 bB 82.8 aA 80.4 aA 5,150 bA 3,294 cB
L 11 28.27 fA 25.6 fB 82.8 aA 78.0 aB 4,671 bA 2,956 cB
L 12 38.60 bA 32.4 cB 83.4 aA 82.2 aA 4,879 bA 3,868 bB
L 13 35.15 cA 26.6 eB 82.5 aA 79.2 aA 5,564 aA 3,310 cB
L 14 33.55 dA 29.1 eB 82.8 aA 80.1 aA 5,075 bA 3,095 cB
L 15 41.26 aA 31.5 cB 83.1 aA 79.2 aB 5,254 bA 2,845 cB
L 16 33.34 dA 31.0 cA 82.5 aA 81 a 6,017 aA 2,856 cB
L 17 27.63 fA 26.7 eA 82.2 aA 77.1 aB 6,070 aA 2,874 cB
L 18 29.64 eA 24.1 fB 82.5 aA 74.4 bB 6,278 aA 2,991 cB
L 19 30.25 eA 27.3 eB 80.7 aA 78.9 aA 5,317 bA 3,163 cB
L 20 26.65 fA 22.3 fB 82.2 aA 68.4 cB 5,584 aA 2,672 cB
Quartzo 30.68 eA 27.5 eB 81.3 aA 77.4 aB 6,256 aA 3,542 bB
Topázio 27.43 fA 24.6 fB 82.8 aA 74.1 bB 5,673 aA 2,878 cB
Ametista 33.49 dA 29.5 dB 82.8 aA 78.6 aB 5,954 aA 4,863 aB
Mean 32.88 B 28.6 A 82.4 B 78.1 A 5,449 B 3,182 A
CV (%) 4.57 2.73 14.11
Table 3. Means of thousand-grain weight (TGW), hectoliter weight (HW) and grain yield (GY) of 23 wheat genotypes
evaluated in two cultivation environments
Means followed by the same letters, uppercase in rows and lowercase in columns, for each characteristic, constitute a statistically homogeneous group by the Scott Knott test (p < 0.05)
Treatment PROT (%) FS (min) SDS (mL)
Nova Fátima, PR Cruzália, SP Nova Fátima, PR Cruzália, SP Nova Fátima, PR Cruzália, SP
L1 14.20 aB 15.67 bA 17.43 aA 17.17 aA 66.00 cB 84.67 aA
L 2 14.43 aB 15.83 bA 17.17 aA 17.27 aA 58.33 dB 67.67 cA
L 3 13.20 bB 15.60 bA 5.93 cB 16.37 aA 60.00 dB 86.33 aA
L 4 13.70 aB 15.27 bA 16.30 aA 15.90 a A 49.00 fB 58.33 eA
L 5 13.93 aB 14.77 cA 6.27 cA 6.60 bA 51.67 eB 56.00 fA
L 6 13.97 aB 15.17 cA 17.63 aA 17.83 aA 55.33 dA 54.00 fA
L 7 14.00 aB 15.77 bA 7.30 cB 17.10 aA 63.33 cA 59.00 eB
L 8 13.47 bB 16.27 aA 6.03 cB 16.53 aA 58.33 dA 58.67 eA
L 9 13.80 aB 15.80 bA 6.67 cA 7.63 bA 70.67 bA 66.67 cB
L 10 14.47 aB 16.90 aA 17.23 aA 17.03 aA 75.00 aA 71.67 bA
L 11 14.53 aB 15.83 bA 6.93 cB 17.27 aA 61.00 cA 60.67 eA
L 12 12.67 cB 14.33 dA 5.43 cB 17.50 aA 50.00 fA 50.67 gA
L 13 12.83 bB 14.20 dA 7.33 cA 7.27 bA 52.00 eB 56.00 fA
L 14 13.27 bB 14.27 dA 6.27 cB 17.83 aA 56.33 dA 56.00 fA
L 15 12.03 cB 13.70 dA 6.83 cA 6.83 bA 48.67 fA 50.00 gA
L 16 13.73 aB 15.47 bA 14.93 bB 17.40 aA 57.67 dA 60.00 eA
L 17 13.23 bB 15.67 bA 6.30 cB 17.37 aA 69.33 bA 72.00 bA
L 18 14.30 aB 16.60 aA 8.13 cB 16.50 aA 58.67 dB 65.67 dA
L 19 14.33 aB 15.63 bA 6.57 cB 17.33 aA 64.67 cA 60.33 eB
L 20 13.63 aB 15.00 cA 17.20 aA 16.47 aA 57.00 dB 72.67 bA
Quartzo 13.13 bB 15.00 cA 5.73 cB 17.07 aA 53.00 eB 62.33 dA
Topázio 14.67 aB 16.07 bA 6.33 cB 17.10 aA 64.33 cA 64.00 dA
Ametista 14.30 aB 15.53 bA 7.47 cB 17.10 aA 65.00 cB 73.00 bA
Mean 13.73 B 15.40 A 9.71 B 15.32 A 59.36 B 63.75 A
CV (%) 3.14 8.98 3.40
Table 4. Means of protein (PROT), flour stability (FS) and volume of sedimentation (SDS) of 23 wheat genotypes
evaluated in two environments
(16.27%), L10 (16.9%) and L18 (16.6%) stood out and showed high protein content, surpassing the controls and the other genotypes (Table 4).
In Nova Fátima, PR, the values of protein, although inferior to those produced in Cruzália, SP, are promising, because they are above 12%, which are adequate for the manufacture of breads (Gutkoski et al., 2007) (Table 4).
For flours destined to baking, the protein content is extremely important, since gluten is an amorphous protein. Studies have described that the protein content is related to baking quality (Pruska-Kedzior et al., 2008; Gutkoski et al., 2011b). However, Schmidt et al. (2009) observed genotypes with low protein content that were classified as improver and genotypes with high protein content and low quality. These results demonstrate that both quantity and quality of the protein (molecular weight) are important for baking quality.
For flour stability (FS) in Nova Fátima, only six genotypes stood out, statistically differing from the controls; in Cruzália, 16 genotypes and the controls showed stability higher than 15 min.
According to the classification established by the Normative Instruction Nº39 of the MAPA (Brasil, 2010) for FS, 7 genotypes in Nova Fátima-PR and 19 in Cruzália, SP, can be classified as “bread-type” (above 10 min) or “improver” (above 14 min). However, for confirmation, it is necessary to evaluate gluten strength (220 and 300 10-4J) and falling number (above
220 and 250 s), respectively, in these genotypes (Brasil, 2010). According to Gutkoski et al. (2007), flour stability has high correlation with gluten strength.
Genotypes whose flour has high stability are recommended for baking, since the viscoelastic properties are important for the dough growth; therefore, gluten must remain stable during the kneading (Gutkoski et al., 2007).
When the flour is destined to the manufacturing of cakes, its viscoelastic properties are different and must have stability and low gluten strength (Gutkoski et al., 2011a). Considering these aspects, the genotypes L5, L13 and L15 have characteristics of FS and SDS favorable to this purpose (Table 4).
Flours with volume of SDS above 50 mL are favorable to baking (Mittelmann et al., 2000). Among the evaluated genotypes, only L4 and L15 have SDS below 50 mL (Table 4). In Nova Fátima-PR, the genotype L10 differed statistically from the controls and the others, with SDS volume of 15.64 mL above the mean of the environment. In Cruzália, SP, the genotypes L1 and L3 were superior to the others, with SDS volumes of 84.67 and 86.33 mL, respectively, statistically higher than the controls (Table 4).
According to Table 4, the genotypes with lower protein content showed low values of FS and SDS, such as L13 and L15. However, there are genotypes that have low protein contents and high values of FS and SDS (L1, L10 and L20), indicating that protein quantity and quality must be analyzed.
The SDS volume indicates the quality of wheat proteins and the higher the volume the more glutenins of high molecular weight are detected in the flour (Graybosch et al., 1995). Thus, the analysis of SDS allows the breeder to analyze the protein quality of the genotypes maintaining in the program only those genotypes with capacity to synthesize proteins of high molecular weight.
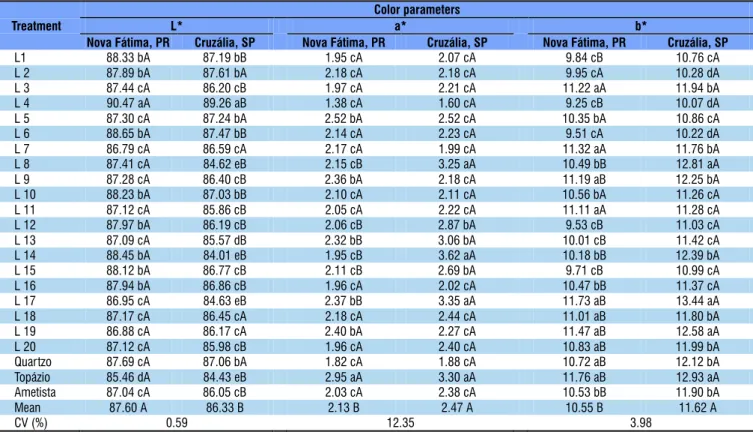
In regard to color, the flours were not very clear. This inconvenience was due to the low luminosity (L*). The utilized mill did not allow the separation of the endosperm of the husk or the germ, a practice performed in industrial mills (Gutkoski et al., 2011a).
L* is significantly compromised by foreign particles including wheat husk bran (Coultate, 2004). According to Ortolan et al. (2010), flours with L* equal to or higher than 93 are considered as white. In the discussed data, flours with L* equal to or higher than 87 correspond to white flour, because
Means followed by equal letters, uppercase in rows and lowercase in columns, for each characteristic, constitute a statistically homogeneous group by the Scott-Knott test (p < 0.05)
Treatment
Color parameters
L* a* b*
Nova Fátima, PR Cruzália, SP Nova Fátima, PR Cruzália, SP Nova Fátima, PR Cruzália, SP
L1 88.33 bA 87.19 bB 1.95 cA 2.07 cA 9.84 cB 10.76 cA
L 2 87.89 bA 87.61 bA 2.18 cA 2.18 cA 9.95 cA 10.28 dA
L 3 87.44 cA 86.20 cB 1.97 cA 2.21 cA 11.22 aA 11.94 bA
L 4 90.47 aA 89.26 aB 1.38 cA 1.60 cA 9.25 cB 10.07 dA
L 5 87.30 cA 87.24 bA 2.52 bA 2.52 cA 10.35 bA 10.86 cA
L 6 88.65 bA 87.47 bB 2.14 cA 2.23 cA 9.51 cA 10.22 dA
L 7 86.79 cA 86.59 cA 2.17 cA 1.99 cA 11.32 aA 11.76 bA
L 8 87.41 cA 84.62 eB 2.15 cB 3.25 aA 10.49 bB 12.81 aA
L 9 87.28 cA 86.40 cB 2.36 bA 2.18 cA 11.19 aB 12.25 bA
L 10 88.23 bA 87.03 bB 2.10 cA 2.11 cA 10.56 bA 11.26 cA
L 11 87.12 cA 85.86 cB 2.05 cA 2.22 cA 11.11 aA 11.28 cA
L 12 87.97 bA 86.19 cB 2.06 cB 2.87 bA 9.53 cB 11.03 cA
L 13 87.09 cA 85.57 dB 2.32 bB 3.06 bA 10.01 cB 11.42 cA
L 14 88.45 bA 84.01 eB 1.95 cB 3.62 aA 10.18 bB 12.39 bA
L 15 88.12 bA 86.77 cB 2.11 cB 2.69 bA 9.71 cB 10.99 cA
L 16 87.94 bA 86.86 cB 1.96 cA 2.02 cA 10.47 bB 11.37 cA
L 17 86.95 cA 84.63 eB 2.37 bB 3.35 aA 11.73 aB 13.44 aA
L 18 87.17 cA 86.45 cA 2.18 cA 2.44 cA 11.01 aB 11.80 bA
L 19 86.88 cA 86.17 cA 2.40 bA 2.27 cA 11.47 aB 12.58 aA
L 20 87.12 cA 85.98 cB 1.96 cA 2.40 cA 10.83 aB 11.99 bA
Quartzo 87.69 cA 87.06 bA 1.82 cA 1.88 cA 10.72 aB 12.12 bA
Topázio 85.46 dA 84.43 eB 2.95 aA 3.30 aA 11.76 aB 12.93 aA
Ametista 87.04 cA 86.05 cB 2.03 cA 2.38 cA 10.53 bB 11.90 bA
Mean 87.60 A 86.33 B 2.13 B 2.47 A 10.55 B 11.62 A
CV (%) 0.59 12.35 3.98
Table 5. Means of color parameters, L* (luminosity), a* and b* (coordinates), of the flour of 23 wheat genotypes
the mill was not industrial; however, this lower L* does not affect the rheological properties of the flour.
Most of the genotypes in Nova Fátima-PR showed L* values above 87, which are preferred by the consumers for the manufacturing of breads (Gutkoski et al., 2011a). In Cruzália, the values were lower, but the genotypes showed L* close to the minimum of 87 (Table 5).
For the chromaticity coordinates a* and b*, all the values were positive, evidencing a tendency to red and yellow, respectively. For the values of a* and b*, the closer they are to zero, the whiter the flour is (Ortolan et al., 2010). According to these authors, values of a* lower than 0.5 and b* lower than 8 correspond to the production of white flour.
Darker flours can be considered by the consumers as of low quality, but not always color is related to the physical-chemical quality of wheat flours (Coultate, 2004). According to Gutkoski et al. (2011a), the L* of the flour is dependent on genotype and on the degree of extraction of the flour, which was confirmed in the experiment, since the quality standards were better in Cruzália-SP.
Conclusions
1. The genotypes showed better industrial quality when cultivated in Cruzália.
2. The genotypes CRX/CD104//ALC, LAJ96010/JSP//ALC and CRX/ALC//ALC showed favorable characteristics for the production of biscuit.
3. The genotypes ORL97061/ORL00241//CD104, SUZ6/ WEAVER//TUI/3/SUP/4/CD104, ORL99396/ORL97061// SUP, CRX/CD104//ALC, ORL98231/IOR00131//ÔNIX, ORL94346/ALC//AVT/3/ÔNIX, CEP0033/ÔNIX/3/ÔNIX*2// TC14/2*SPEAR, Campo Real/VAN//ÔNIX, ORL97061/CD 104 and PMP/ORL98231//CRX showed aptitude for obtaining flours with baking quality.
4. The genotype L4 must be highlighted because it showed the highest values of L* in both environments and lowest values of a* and b*, which are close to the ideal values for a totally white flour.
5. The evaluations were efficient for the classification and selection of the genotypes in the breeding program.
Literature Cited
AACC - American Association of Cereal Chemists. Official methods
of analysis.Saint Paul: Plenum, 2000. 1200p.
Brasil. Ministério da Agricultura, Pecuária e Abastecimento. Regras para análise de sementes/Ministério da Agricultura, Pecuária e Abastecimento. Secretaria de Defesa Agropecuária. Brasília: MAPA/ACS, 2009. 399p.
Brasil. Ministério da Agricultura, Pecuária e Abastecimento. Instrução Normativa nº 39, de 30 de Novembro de 2010. Aprova o regulamento técnico de qualidade do trigo. <http://www. agricultura.gov.br/>. 11 Jun. 2013.
Costa, N.; Souza, E. L.; Stamford, T. L. M.; Andrade, S. A. C. Qualidade tecnológica de grãos e farinhas de trigo nacionais e importadas. Ciência Tecnologia Alimentação, v.28, p.220-225, 2008. http:// dx.doi.org/10.1590/S0101-20612008000100031
Coultate, T. P. Alimentos: A química de seus componentes. Porto Alegre: Artmed, 2004. 368p.
Cruz, C. D. GENES - A software package for analysis in experimental statistics and quantitative genetics. Acta Scientiarum Agronomy, v.35, p.271-276, 2013. http://dx.doi.org/10.4025/actasciagron.v35i3.21251 Graybosch, R. A.; Peterson, C. J.; Baenziger, P. S.; Shelton, D. R.
Environmental modification of hard red winter wheat flour protein composition. Journal of Cereal Science, v.22, p.45-51, 1995. http://dx.doi.org/10.1016/S0733-5210(05)80006-2 Guarienti, E. M.; Santos, H. P.; Lhamby, J. C. B. Efeito de sistemas de
rotação de culturas sobre características de qualidade tecnológica de trigo. Revista Pesquisa Agropecuária Gaúcha, v.11, p.31-37, 2005. Gutkoski, L. C.; Durigon, A.; Mazzutti, S.; Cezare, K.; Colla, L. M.
Influência do tipo de farinha de trigo na elaboração de bolo tipo inglês. Food Technology, v.14, p.275-282, 2011a. http://dx.doi. org/10.4260/bjft2011140400033
Gutkoski, L. C.; Klein, B.; Colussi, R.; Santeti, T. A. S. Efeito da adubação nitrogenada nas características tecnológicas de trigo. Revista Brasileira de Agrociência, v.17, p.116-122, 2011b. Gutkoski, L. C.; Klein, B.; Pagnussatt, F. A.; Pedó, I. Características
tecnológicas de genótipos de trigo (Triticum aestivum L.)
cultivados no cerrado. Ciência e Agrotecnologia, v.31, p.786-792, 2007. http://dx.doi.org/10.1590/S1413-70542007000300027 Mittelmann, A.; Barbosa Neto, J. F.; Carvalho, F. I. F.; Lemos, M. C. I.;
Conceição, L. D. H. Herança de caracteres do trigo relacionados à qualidade de panificação. Pesquisa Agropecuária Brasileira, v.35, p.975-983, 2000. http://dx.doi.org/10.1590/S0100-204X2000000500015 Monteiro, J. E. B. A. Agrometeorologia dos cultivos - O fator
meteorológico na produção agrícola. Brasília: INMET, 2009. 530p. Ortolan, F.; Hecktheuer, L. H.; Miranda, M. Z. Efeito do armazenamento à baixa temperatura (-4 °C) na cor e no teor de acidez da farinha
de trigo.Ciência e Tecnologia de Alimentos, v.30, p.55-59, 2010.
http://dx.doi.org/10.1590/S0101-20612010005000009
Pruska-Kedzior, A.; Kedzior, Z.; Klockiewicz-Kaminska, E. Comparison of viscoelastic properties of gluten from spelt and common wheat. European Food Resourch Technology, v.277, p.199-207, 2008. http://dx.doi.org/10.1007/s00217-007-0710-0 Rossi, E. S.; Mendes, M. C.; Possatto Júnior, O.; Rizzardi, D. A.; Silva, C.
A. da. Agronomics charaters of wheat cultivars in response to urea treaded with urease inhibitor in coverage. Applied Technology for Agricultural Science, v.6, p.39-46, 2013.
Schmidt, D. A. M.; Carvalho, F. I. F.; Oliveira, A. C.; Silva, J. A. G.; Bertan, I.; Valério, I. P.; Hartwig, I.; Silveira, G.; Gutkoski, L. C. Variabilidade genética em trigos brasileiros a partir de caracteres componentes da qualidade industrial e produção de grãos. Bragantia, v.68, p.43-52, 2009. http://dx.doi.org/10.1590/S0006-87052009000100006 Silva, A. H.; Camargo, C. E. O.; Ferreira Filho, A. W. P.; Felício, J. C.;