This is an Open Access article distributed under the terms of the Creative Commons Attribution License, which permits unrestricted use, distribution, and reproduction in any medium, provided the original work is properly cited.
Optimization of the roasting conditions of arabica coffee cultivated
in the cerrado area of Brazil
Otimização das condições de torração de café arábica cultivado no cerrado
Abstract
The aim of this work was to optimize, by way of a rotational central composite design (RCCD), the roasting temperature and time conditions of beans from three Coffea arabica L. genotypes cultivated in the Cerrado, Brazil under controlled water stress conditions, to maintain a high soluble solids content and a roasting colour acceptable by consumers. In this way it will be possible to know the potential use of these genotypes in the instant coffee industry. The RCCD design was carried out with 2 factors (time and temperature) and 11 experiments for each of the three genotypes. The soluble solids contents were determined using a digital refractometer and the roasted bean colour evaluated using the Agtron system. The software R was used in both the variance analysis and in the multiple linear regression to define the prediction mathematical models and the statistical parameters. The Excel SOLVER tool version 2010 was used to select the best colour-soluble solids binomial to provide a colour from 65# to 45# (medium light to moderately dark) on the Agtron system and the highest soluble solids value. The roasting temperature and time conditions that maintained high soluble solids contents and produced roasted beans with an appropriate colour for consumption were 204.8 °C and 10.9 minutes for the cultivar MG 1177; 214.2 °C and 8.8 minutes for MG 0188; and 240 °C and 7 minutes for Icatu 2944, showing the potential for traditional consumption and the production of instant coffee.
Keywords: RCCD; Coffee quality; Instant coffee.
Resumo
O objetivo deste trabalho foi otimizar, por meio do planejamento DCCR (Delineamento Composto Central Rotacional), as condições tempo e temperatura de torração para três genótipos Coffea arabica L. cultivados no Cerrado, sob condições de estresse hídrico controlado, para manter alto teor de sólidos solúveis e uma coloração de torração aceitável pelos consumidores. Deste modo, será possível conhecer o uso potencial destes genótipos na indústria do café solúvel. O planejamento DCCR foi realizado com dois fatores (tempo e temperatura) e 11 experimentos, para cada um dos três genótipos. O teor de sólidos solúveis foi determinado com refratômetro digital e a coloração dos grãos torrados foi avaliada pelo sistema Agtron. O software livre R foi utilizado na análise de variância e na regressão linear múltipla, para a definição de modelos matemáticos de predição e de parâmetros estatísticos. A seleção do melhor binômio cor-sólidos solúveis, que atende à coloração de 65# a 45# (média clara a moderadamente escura) no sistema Agtron e que fornece o maior valor de sólidos solúveis, foi feita pela ferramenta SOLVER do Excel versão 2010. As condições de temperatura e tempo de torração, que mantiveram altos teores de sólidos solúveis e que produziram grãos torrados com uma coloração adequada ao consumo, foram 204,8 °C e 10,9 minutos para a cultivar MG 1177; 214,2 °C e 8,8 minutos, para MG 0188; 240 °C e 7 minutos, para Icatu 2944, mostrando o potencial para o consumo tradicional e para a produção de café solúvel.
Palavras-chave: DCCR; Qualidade café; Café solúvel.
Juaci Vitória Malaquias1*, Sonia Maria Costa Celestino1, Manaira Ferreira Franco Xavier1
1 Empresa Brasileira de Pesquisa Agropecuária (EMBRAPA), Centro de Pesquisa Agropecuária dos Cerrados (CPAC), Planaltina/DF - Brazil
*Corresponding Author
Juaci Vitória Malaquias, Empresa Brasileira de Pesquisa Agropecuária (EMBRAPA), Centro de Pesquisa Agropecuária dos Cerrados (CPAC), Rodovia Brasília/Fortaleza, BR 020, km 18, CEP: 73310-970, Planaltina/DF - Brazil, e-mail: juaci.malaquias@embrapa.br
Cite as: Optimization of the roasting conditions of arabica coffee cultivated in the cerrado area of Brazil. Braz. J. Food Technol., v. 21, e2016162, 2018.
1 Introduction
The Embrapa Cerrados Institute has an active Coffea arabica L. germplasm bank with coffee accessions cultivated using controlled water stress technology with high productivity and beverage quality. Of these genotypes, MG 0188, MG 1177 and Icatu 2944 stand out (CELESTINO et al., 2015). The sensory attributes (aroma, flavour, body) of coffee are conferred by volatile and non-volatile compounds produced during roasting (NEBESNY; BUDRYN, 2006). With respect to the chemical constituents of coffee, a larger amount of soluble solids is desired to ensure higher yields in the production of instant coffee but during roasting, the soluble solids decrease (NASCIMENTO et al., 2007). The maintenance of high soluble solids contents with roasting degrees from 65# to 45# (medium light to moderately dark), is the roast most appreciated by the Brazilian consumer, and depends on optimization of the roasting conditions. Typically, the production of instant coffee involves the use of Coffea canephora genotypes which present higher soluble solids than Coffea arabica genotypes, and, therefore higher yields (MOURA et al., 2007). However, the Coffea canephora genotypes have the disadvantage of being less aromatic (ABIC, 2017) whereas the Coffea arabica genotypes show good flavour intensity but lower soluble solids contents (RIBEIRO et al., 2014). Thus, the instant coffee industry tries to balance the advantages of C. canephora in terms of yield with the advantages of C. arabica regarding aroma, by mixing the two species in so-called blends (RIBEIRO et al., 2014).
The rotational central composite design is a methodology used to optimize different kinds of processing. The method consists of statistical and mathematical procedures used in the study of the interrelationships between one or more responses (dependent variables) with
several factors (independent variables) (KU MADIHAH et al., 2013; MENDES et al., 2001).
The aim of this work was to use a rotational central composite design (RCCD) to optimize the roasting temperature and time conditions of the beans of three C. arabica L. genotypes cultivated in the Cerrado, Brazil under controlled water stress conditions to maintain high soluble solids contents and a roasting colour acceptable by consumers. In this way it will be possible to know the potential use of the genotypes in the instant coffee industry.
2 Material and methods
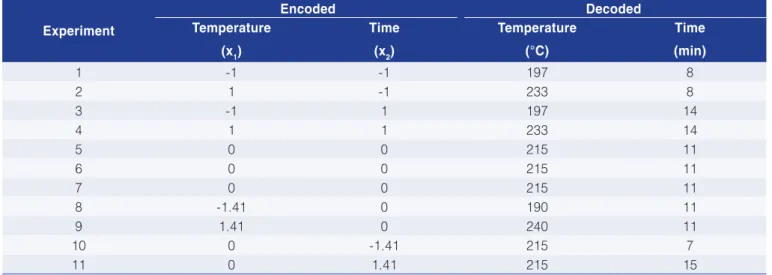
The ripe fruits of 3 Coffea arabica L. genotypes obtained from the germplasm bank of Embrapa Cerrados, MG 0188, MG 1177 and Icatu 2944, were harvested during the month of May 2013. The dry method was used to obtain the beans. The fruits were dried in a yard for two weeks to a moisture content of approximately 14%. To speed up the drying process, the fruits were dried artificially for 20 hours in a dryer with forced air circulation at 40 °C, and the final moisture content presented by the dry coffee fruits was 10-11%. The bean processing involved mechanically peeling and removing the mucilage and parchment. The coffee beans (100 g) of the same sieve size (17, 18 and 19) were roasted in a gas-heated roaster (Palini & Alves) with a maximum capacity of 300 g, and continuous rotation, and then immediately cooled in a flow of air. Table 1 presents the RCCD experimental factorial design for roasting with 2 factors (temperature and time) consisting of 4 points (formed by -1 and 1), 3 centre points (formed by 0 and 0) and 4 axial points (formed by -1.41, 1.41 and 0), giving a total of 11 experiments for each of the three coffee genotypes (RODRIGUES; IEMMA, 2005).
Equations 1 and 2 describe the relationship between the encoded and decoded temperatures and times for the three coffee genotypes. The values are presented in Table 1.
Table 1. Encoded and decoded temperatures and times in the experimental RCCD design.
Experiment
Encoded Decoded
Temperature
(x1)
Time
(x2)
Temperature
(°C)
Time
(min)
1 -1 -1 197 8
2 1 -1 233 8
3 -1 1 197 14
4 1 1 233 14
5 0 0 215 11
6 0 0 215 11
7 0 0 215 11
8 -1.41 0 190 11
9 1.41 0 240 11
10 0 -1.41 215 7
(
−)
= 1
1
VR 215 x
18
(1)
(
−)
= 2
2
VR 11 x
3
(2)
Where:
(x1): encoded value for temperature;
(VR1): real value (decoded) for temperature (°C); (x2): encoded value for time;
(VR2): real value (decoded) for time (min).
After roasting, the coffee beans were ground and passed through a 20 mesh sieve. The powder obtained was stored in a glass jar covered with aluminium foil for protection against light. Two grams of each sample were suspended in 48 mL of distilled water for 01 hour with continuous stirring at 200 rpm. The samples were then filtered through filter paper (14 µm) and the soluble solids measured in oBrix, in triplicate, using a digital refractometer
(Hanna Instruments) (AOAC, 1997 - method 932.12). The reading was multiplied by 25 due to the dilution of 2 g of powder to 48 mL of mixture, or, 1:25.
The colours of the beans of the three genotypes were evaluated using the Agtron system (AGTRON, 2003) for the 11 experiments.
The free software R, version 2.15, was used for the analysis of variance and multiple linear regression in order to assess the predictive quality of the fitted mathematical models and to estimate the statistical parameters required to calculate the soluble solids contents and colours of the beans under certain conditions of temperature and time.
The soluble solids and roasting colour data obtained from the mathematical models for the conditions of time between 7 and 15 minutes and temperature between 197 °C and 240 °C were used by the Excel 2010 version of the Solver tool to choose the best colour-soluble solids pairs and thus select the best time and temperature roasting conditions.
3 Results and discussion
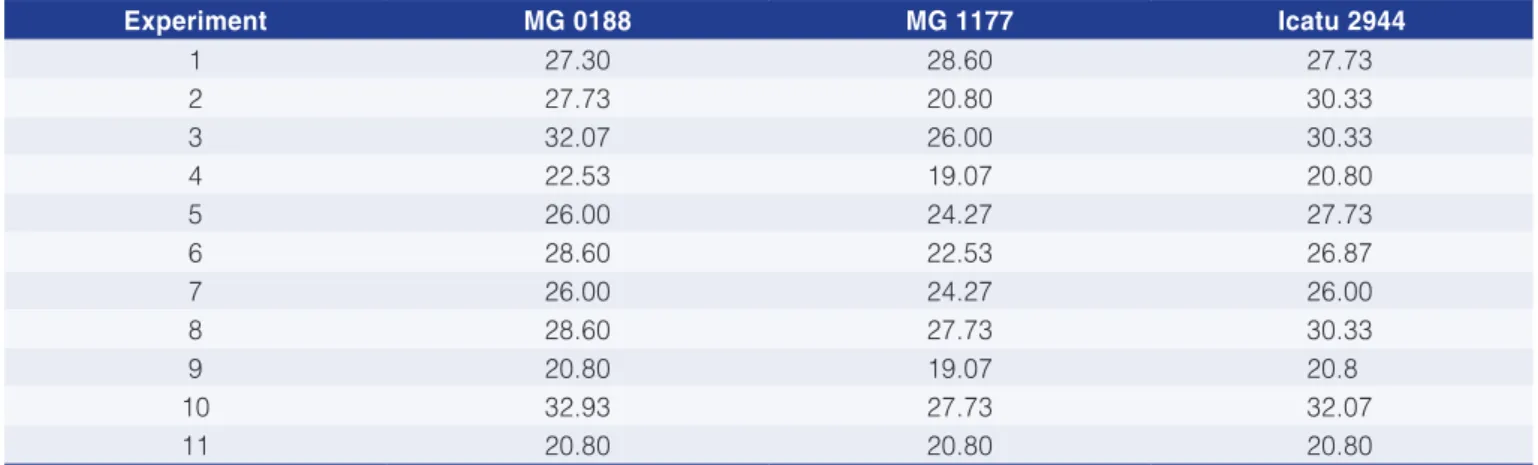
Table 2 shows the results obtained for the soluble solids contents (ºBrix) of the three coffee genotypes studied.
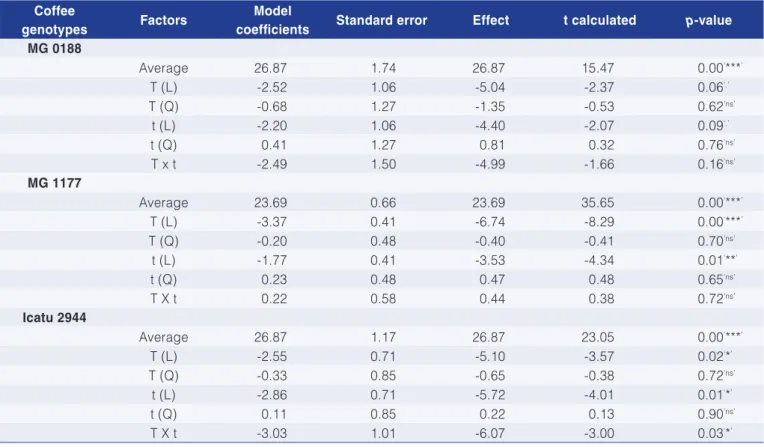
Table 3 presents the coefficients for the first model fitted for the variable of soluble solids with their respective values for the standard errors, effect, and the “p” values for the three coffee genotypes studied.
All the coffees studied presented the “intercept” (shown in the model as the average) as a highly significant factor in the fitted model at a probability level of 0.1%. However, considering each one separately, the statistics related to MG 0188 show that the linear components of the fitted polynomial regression model were statistically significant at a probability level of 10% for both variables (temperature and time). The statistical results for the fitted model related to the material MG 1177 highlighted the linear components of both variables (temperature and time) as being highly significant at the probability levels of 0.1% and 1%, respectively. In addition to presenting the linear components for the variables of temperature and time as significant factors, the genotype Icatu 2944 showed the interaction of “temperature x time” as an element which should remain in the model due to the importance of its statistical significance. These factors were considered significant at a probability level of 5%.
Many studies have reported the optimization of roasting time and temperature for the determination of several physical and chemical coffee characteristics (sensory quality, antioxidant activity, caffeine, total sugar, phenolic compounds, pH, etc.) using polynomial models. Chung et al. (2013), studying Coffea arabica L. beans, found the linear coefficients for time and temperature and interaction between these variable as significant at a probability level of 5% in the determination of antioxidant activity. Darsef (2014), in a study with Robusta coffee variety cv canephora, found a linear-quadratic model with a linear component for time, and a quadratic component for temperature as significant at a probability level of 5% in
Table 2. Soluble solids contents (ºBrix) obtained in the 11 experiments for the three coffee genotypes studied.
Experiment MG 0188 MG 1177 Icatu 2944
1 27.30 28.60 27.73
2 27.73 20.80 30.33
3 32.07 26.00 30.33
4 22.53 19.07 20.80
5 26.00 24.27 27.73
6 28.60 22.53 26.87
7 26.00 24.27 26.00
8 28.60 27.73 30.33
9 20.80 19.07 20.8
10 32.93 27.73 32.07
the determination of the caffeine content. Mendes (1999) reported a model with linear and quadratic components for time, and a linear component for temperature, as significant in a study of the total sugar content and pH for C. canephora. The predictive model for the phenolic compounds content only presented linear coefficients for time and temperature as significant at a probability level of 5%.
After studying the statistical results of this first analysis, the individual significances of the coefficients according to the “t” test and by way of the “p” value determined the factors that were chosen to remain in the model, and the variables that did not present statistical significance were deleted. Table 4 shows the variance analysis (ANOVA) of the final model.
The statistical significances of the linear regression model obtained for the three coffees are shown from the results of ANOVA (Table 4). The genotype MG 0188 presented a determination coefficient (R2) of 0.544 and fitted determination
coefficient (R2
fitted) of 0.430, indicating low explanation of
the dependent variable by the independent variables. These statistics indicate that only 54.4% of the date variability related to the response variable could be explained by the fitted model. This low determination coefficient may be due to the high variability of the data, requiring more complex models or a new modelling process with other time and temperature limits. In the case of MG 1177 the values for R2 of 0.939 and for R2
fitted of 0.923 were quite
high, indicating that the fitted model could explain 93.9% of the variability verified in the data of the response variable. Finally, Icatu 2944 presented a determination coefficient of 0.879 and a fitted determination coefficient of 0.827, and hence 87.9% of the variability of the °Brix values could be explained by the regression present in the fitted model.
The determination coefficient (R2) and the fitted
determination coefficient (R2
fitted) measure the explanatory
capacity of the model. However, two pieces of information must be taken into account: the number of variables and the sample size (BRACARENSE, 2012). Besides the analysis of the determination coefficient, in order for the regression model to be considered useful and with predictive power, the model must present a “global fit” with a statistical significance not above a probability of 5%, and at the same time a non-significant “lack of fit”, or in other words, with “p” values higher than 5%. The statistical results related to the “regression” component presented in Table 4 show that MG 0188, MG 1177 and Icatu 2944 presented, respectively, F values equal to 19.83 (p-value: 0.048), 57.45 (p-value: 0.017) and 68.72 (p-value: 0.014), all statistically significant at a probability level of 5%. In the evaluation of the factor “lack of fit”, MG 0188, MG 1177 and Icatu 2944 presented “p” values of 0.169 (16.9%), 0.606 (60.6%) and 0.167 (16.7%), respectively, all higher than 5% of probability. This indicates that all the regression models fitted very well.
Table 3. Estimates for the model coefficients, standard errors, effects, t calculated and p-values for the three coffees.
Coffee
genotypes Factors
Model
coefficients Standard error Effect t calculated p-value
MG 0188
Average 26.87 1.74 26.87 15.47 0.00‘***’
T (L) -2.52 1.06 -5.04 -2.37 0.06‘.’
T (Q) -0.68 1.27 -1.35 -0.53 0.62’ns’
t (L) -2.20 1.06 -4.40 -2.07 0.09‘.’
t (Q) 0.41 1.27 0.81 0.32 0.76’ns’
T x t -2.49 1.50 -4.99 -1.66 0.16’ns’
MG 1177
Average 23.69 0.66 23.69 35.65 0.00‘***’
T (L) -3.37 0.41 -6.74 -8.29 0.00‘***’
T (Q) -0.20 0.48 -0.40 -0.41 0.70’ns’
t (L) -1.77 0.41 -3.53 -4.34 0.01‘**’
t (Q) 0.23 0.48 0.47 0.48 0.65’ns’
T X t 0.22 0.58 0.44 0.38 0.72'ns'
Icatu 2944
Average 26.87 1.17 26.87 23.05 0.00‘***’
T (L) -2.55 0.71 -5.10 -3.57 0.02‘*’
T (Q) -0.33 0.85 -0.65 -0.38 0.72’ns’
t (L) -2.86 0.71 -5.72 -4.01 0.01‘*’
t (Q) 0.11 0.85 0.22 0.13 0.90’ns’
T X t -3.03 1.01 -6.07 -3.00 0.03‘*’
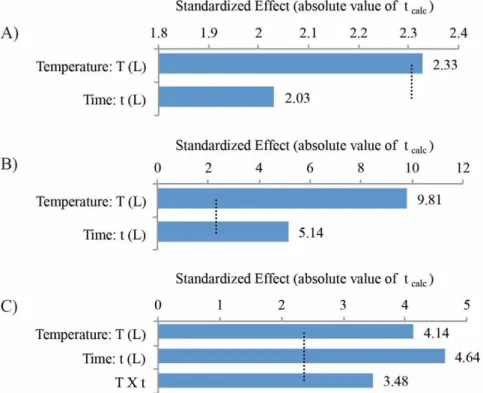
Figure 1 shows the Pareto diagram related to the final fitted model for the effects of the temperature (codified: x1) and time (codified: x2) on the soluble solids contents (°Brix) for the three coffee genotypes: (A) MG0188, (B) MG1177 and (C) Icatu 2944. The dashed vertical line indicates that the tabulated t value is 2.31 for MG0188 and MG1177, and 2.36 for Icatu 2944, at a significance level of 0.05. The Pareto diagram highlights the strong influence of the linear component “temperature” as compared to the linear
component “time” on the responses of the °Brix values of the fitted models for MG 0188 and MG 1177. On the other hand, the linear component of “time” was more prominent than the other effects produced by the component “temperature” and by the interaction “temperature x time” in the model for Icatu 2944. Mendes (1999) also reported the strong influence of the linear component for time as compared to the effect of the component of temperature and the interaction “temperature x time” for the predictive Table 4. Analysis of variance (ANOVA) related to the final fitted model for the three coffees genotypes.
Coffee genotype
Sources of variation
Degrees of
freedom Sum of squares Mean Square F p-value
MG0188 R2 = 0.544 R2
fitted = 0.430
Regression 2 89.35 44.68 19.83 0.048*
Residue 8 74.92 9.36
Lack of fit 6 70.41 11.73 5.23 0.169
Pure error 2 4.51 2.25
MG1177 R2 = 0.939 R2
fitted = 0.923
Regression 2 115.93 57.96 57.45 0.017*
Residue 8 7.56 0.94
Lack of fit 6 5.54 0.92 0.92 0.606
Pure error 2 2.02 1.01
Icatu 2944 R2 = 0.879 R2
fitted = 0.827
Regression 3 154.21 51.40 68.72 0.014*
Residue 7 21.23 3.03
Lack of fit 5 19.74 3.95 5.27 0.167
Pure error 2 1.50 0.75
T: temperature; t: time; L: linear; Q: quadratic; Statistical significance: *0.05.
models of pH, reducing sugars, total sugars and phenolic compounds in coffees.
The final fitted models are presented in Table 5. A first order linear regression model with no interaction was validated for MG0188 and MG1177, but a more suitable model for Icatu 2944 was one of first order but including the interaction component. The signs of the coefficients were negative in the encoded and decoded equations obtained for MG 0188 and MG 1177, indicating that the contributions of the variables temperature and time tended to decrease as the values for °Brix increased. It is important to highlight that for these genotypes, the predictor variables had an additional effect because they did not show significant interaction in the model. In the case of Icatu 2944, the variables were considered to have a multiplicative effect, because there was a statistically significant interaction component in the model. The temperature was influenced by the factor time and vice versa. It is possible to check whether there are changes in the direction and value of
the response of °Brix from the observation of the sign of the interaction component. If the sign is positive, there is only a change in value, but a negative sign means there are differences in the value and in the direction.
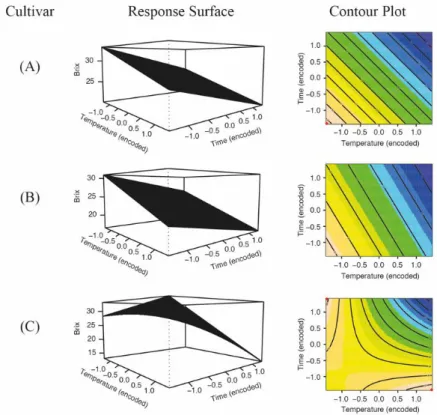
In the case of Icatu 2944, the negative sign indicated an opposite behaviour between temperature and time, or, in other words, when the temperature increased and the time decreased, or vice versa, the soluble solids content tended to increase.
The tendency to increase or decrease the °Brix values according to the encoded temperature (x1) and time (x2) values for the three coffees: (A) MG 0188, (B) MG 1177, and (C) Icatu 2944, can be observed clearly from the response surface graphs and contour plots (Figure 2).
In order to find the “critical values” of the functions created for the genotypes studied, or, in other words, the temperature and time values at the maximum, minimum and saddle points, computer resources designed for the solution of equation systems composed of partial
Table 5. Fitted multiple linear regression models obtained for soluble solids from the encoded and decoded values of temperature and time.
Encoded Decoded Cultivar
Y = 26.67 - 2.52(x1) - 2.20(x2) Y = 64.80 - 0.14(VR1) - 0.73(VR2) MG 0188 Y = 23.72 – 3.37(x1) – 1.77(x2) Y = 71.06 – 0.19(VR1) – 0.59(VR2) MG 1177 Y = 26.71 - 2.55(x1) - 2.86(x2) - 3.03(x1x2) Y = -74.24 + 0.52(VR1) + 11.95(VR2) - 0.06(VR1VR2) Icatu 2944 Where (x1): encoded value of temperature; (x2): encoded value of time; (VR1): real value (decoded) of temperature (°C); (VR2): real value (decoded) of time (min); (Y): estimated value for the soluble solids content (°Brix).
derivatives, were used. In sequence, a hessian matrix was built to identify the critical points such as the maximum, minimum and saddle points (PIMENTEL, 2002).
Since the fitted equations for MG 0188 and MG 1177 were of first order and composed of coefficients with a negative sign, the highest value for the soluble solids content can be found by replacing VR1 and VR2 in the decoded equation with the lowest real values for temperature and time, respectively, used in the experiment. For Icatu 2944 the result of the mathematical applications with the partial derivatives was used. According to the analysis of the equations obtained, values of 33.1 and 30.8 °Brix were found for the soluble solids contents, which match the highest maximum values for MG 0188 and MG 1177, respectively, both calculated for a temperature of 190 °C and time of 7 minutes. For Icatu 2944, the saddle point in the analysis of the equations obtained was identified as having a value of 29.3 °Brix, matching the temperature of 198.03 °C and time of 8.48 minutes. Chung et al. (2013) also found the same behaviour for the saddle point for the model of antioxidant activity with green Coffea arabica beans.
Lower temperatures and longer times, and the opposite, higher temperatures higher and shorter times than those of the saddle point, tend to boost the soluble solids value. In the contour plot (Figure 2) one can observe two extreme points on the same diagonal line, matching “highest temperature and lowest time” in the first case, and “lowest temperature and highest time” in the second case. These points would be the possible candidates to indicate the maximum value for the soluble solids. Replacing the temperature and time values tor the two cases mentioned above, the first case presents a soluble solids content of 33.4 °Brix after 7 minutes at 240 °C, and the second case 32.8 °Brix after 15 minutes at 197 °C.
Many studies on the optimization of the coffee roasting process have used response surface methodology and contour plots in order to define the optimized conditions. Mendes (1999), studying the total sugar content of robusta coffee as the response variable found an optimum time range from 14 to 16 min at 200 °C to 205 °C. Darsef (2014), analysing the contour plot in order to optimize the caffeine content, set the temperature at 178 °C and time at 29 min as the best roasting conditions. Chung et al. (2013) superimposed the contour plots for the browning index, antioxidant activity, colour, aroma and overall
acceptability of coffee brews in order to define the best roasting temperature and time conditions. The optimal values obtained were 182 °C for 7 min.
Table 6 presents the colours of the coffee beans after the roasting process according to the Agtron system for the genotypes MG 0188, MG 1177 and Icatu 2944 obtained in the eleven experiments. Colour is an important indicator of the roasting point of coffee beans (MENDES et al., 2001), being used for the quality control. With respect to roasting colour, the Brazilian consumer preference is in the medium dark range (SCHMIDT et al., 2008), from #65 to #45 using the Agtron system (AGTRON, 2003).
Experiments 1, 3, 8 and 10 presented roasting colour values higher or equal to #65, representing a lighter coloration, highlighting experiment 1 with the highest value (#95). Experiments 4 and 9 showed the lowest values, equal to #35, tending to a darker coloration than the recommended one of #45 (medium dark), with good consumer acceptance. Table 7 shows the mathematical models obtained from these results.
Chung et al. (2013) found a linear-quadratic model for predicting the colour of roasted Coffea Arabica beans by way of the average, linear and quadratic components for temperature and the quadratic component for time. Many factors, such as genotype and storage conditions, for example, and the postharvest process and roasting
Table 6. Roasting colours according to the Agtron system for the MG 0188, MG 1177 and Icatu 2944 genotypes.
Experiment MG 0188 MG 1177 Icatu 2944
1 95 95 95
2 55 45 55
3 75 65 65
4 35 35 35
5 55 55 55
6 55 55 55
7 55 55 55
8 85 75 85
9 35 35 35
10 75 75 75
11 55 55 55
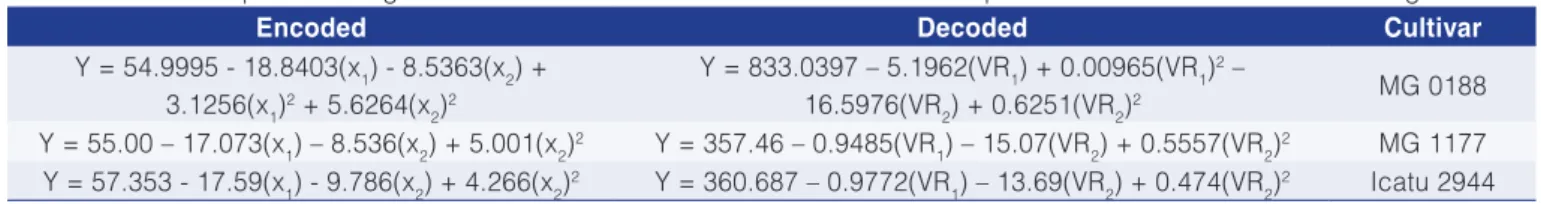
Table 7. Fitted multiple linear regression models of the encoded and decoded temperature and time values for roasting colour.
Encoded Decoded Cultivar
Y = 54.9995 - 18.8403(x1) - 8.5363(x2) + 3.1256(x1)2 + 5.6264(x
2)2
Y = 833.0397 – 5.1962(VR1) + 0.00965(VR1)2 –
16.5976(VR2) + 0.6251(VR2)2 MG 0188
Y = 55.00 – 17.073(x1) – 8.536(x2) + 5.001(x2)2 Y = 357.46 – 0.9485(VR
1) – 15.07(VR2) + 0.5557(VR2)2 MG 1177
Y = 57.353 - 17.59(x1) - 9.786(x2) + 4.266(x2)2 Y = 360.687 – 0.9772(VR
1) – 13.69(VR2) + 0.474(VR2)2 Icatu 2944
conditions contribute to coffee quality and to the acquisition of a huge diversity of linear and nonlinear models.
The models presented in Table 7 were used to calculate the colour values for the color of the roasted coffee using the optimized temperature and time conditions. MG 0188 and MG 1177 beans roasted at 190 °C for 7 minutes presented high soluble solids contents, but with quite a light colour (> #95), which is undesirable for the Brazilian consumer. The roasted beans of the cultivar Icatu 2944 presented a suitable colour (#55) with the optimized temperature of 240 °C for 7 minutes, but an inadequate colour of (#70) at 197 °C for 15 minutes. Due to the lighter colour of the roasted MG 0188 and MG 1177, the colour-soluble solids pair was analysed to choose the roasting conditions that produced a roasted bean colour between #65 and #45 and with high soluble solids contents.
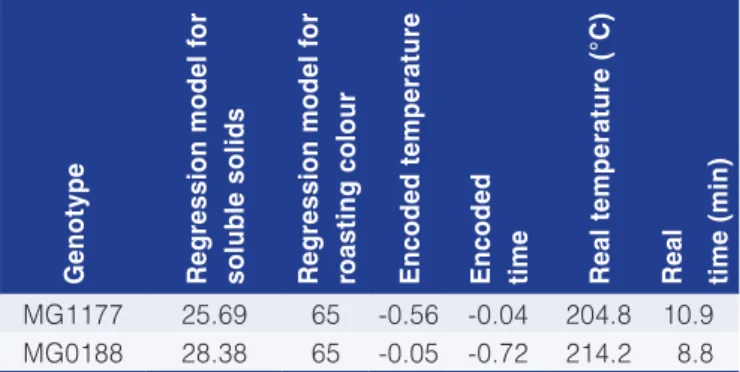
The new temperature and time values according to these criteria were 204.8 °C for 10.9 minutes for the genotype MG 0177 and 214.2 °C for 8.8 minutes for the MG 0188 genotype. Using the set time and temperature roasting conditions new values of soluble solids contents for MG 0177 and MG 0188 were calculated by regression models (Table 8).
All three genotypes presented suitable colours for consumption and high soluble solids contents, highlighting the Icatu 2944 genotype with a soluble solids content of 33.4 °Brix when roasted at 240 °C for 7 minutes. A high soluble solids content improves the sensory properties of the coffee, boosting both the quality and trade of the beans (ABIC, 2017). Besides these advantages, the use of Coffea arabica genotypes that present, after roasting, high soluble solids contents, can improve the yield of instant coffee and the quality of the blends made with Arabica and Robusta coffees. Fernandes et al. (2003) obtained values of 26.97 °Brix and 28.17 °Brix for Arabica coffee and 31.39 °Brix for Robusta coffee with medium roasting. Mendonça et al. (2005) found a range from 23.77 to 27.89 °Brix for eight genotypes of Arabica coffee submitted to light roasting.
4 Conclusions
The statistical procedures were useful to obtain the optimized roasting temperature and time conditions that maintained high soluble solids contents and produce roasted beans with a suitable coloration for consumption with the three genotypes. For MG 1177 the conditions were 204.8 °C for 10.9 minutes, for MG 0188 214.2 °C for 8.8 minutes, and for Icatu 2944 240 °C for 7 minutes. These conditions were obtained for beans with final moisture contents of 10% to 11% and the same sieve size, probably being different due to the genetics of the plants.
Under the optimised conditions, the roasted beans of the genotypes MG1177, MG 0188 and Icatu 2944, highlighting Icatu 2944, presented soluble solids contents that could improve the production yield and quality of instant coffees made with Arabica and Robusta coffees, showing the potential for these genotypes in the coffee industry trade.
Acknowledgements
The authors are grateful to the Brazilian Coffee Research Consortium for financing the project “Introduction
and characterization of germoplasm for the improvement of Coffea arabica and Coffea canephora through the assisted selection by molecular markers in the Irrigated Cultivar System”, under the number 02.09.20.067.00 of
Embrapa.
References
AGTRON. Coffee roast analyzer owners manual. Nevada: Agtron Inc., 2003.
ASSOCIAÇÃO BRASILEIRA DA INDÚSTRIA DE CAFÉ - ABIC. 2017. Available in: <www.abic.com.br/publique/cgi/cgilua.exe/ sys/start.htm?sid-68>. Access in: 5 may 2017.
ASSOCIATION OF OFFICIAL ANALYTICAL CHEMISTS - AOAC.
Official methods of analysis. 16th ed. Arlington: AOAC, 1997.
BRACARENSE, P. A. Estatística aplicada às ciências sociais. Curitiba: IESDE Brasil S.A., 2012. 288 p.
CELESTINO, S. M. C.; MALAQUIAS, J. V.; XAVIER, M. F. F. Agrupamento de acessos de café irrigado com melhores atributos para bebida. Coffee Science, v. 10, n. 1, p. 131-137, 2015.
CHUNG, H. S.; KIM, D. H.; YOUN, K. S.; LEE, J. B.; MOON, K. D. Optimization of Roasting Conditions according to Antioxidant Activity and Sensory Quality of Coffee Brews. Food Science and Biotechnology, v. 22, n. 1, p. 23-29, 2013. http://dx.doi. org/10.1007/s10068-013-0004-1.
DARSEF, R. S. Optimization of roasting robusta sukamakmur coffee with of response surface methodology. BEST: International
Journal of Management, Information Technology and Engineering, v. 22, n. 6, p. 35-42, 2014.
Table 8. Optimized results for the soluble solids contents according to the colour range between #65 and #45.
Genotype Regression model f
or
solub
le solids
Regression model f
or
roasting colour Encoded temperature Encoded time Real temperature (°C) Real time (min)
FERNANDES, S. M.; PEREIRA, R. G. F. A.; PINTO, N. A. V. D.; NERY, M. C.; PÁDUA, F. R. M. Constituintes químicos e teor de extrato aquoso de café arábica (Coffea arabica L.) e conilon (Coffea canephora Pierre) torrados. Ciência e Agrotecnologia, v. 27, n. 5, p. 1076-1081, 2003. http://dx.doi.org/10.1590/S1413-70542003000500015.
KU MADIHAH, K. Y.; ZAIBUNNISA, A. H.; NORASHIKIN, S.; ROZITA, O.; MISNAWI, J. Optimization of roasting conditions for high-quality Arabica coffee. International Food Research Journal, v. 20, n. 4, p. 1623-1627, 2013.
MENDES, L. C. Otimização do processo de torração do café robusta (Coffea canephora Conillon) para formulação de blends com café arábica (Coffea arabica). 1999. 111 f. Dissertação (Mestrado em Engenharia de Alimentos) - Faculdade de Engenharia de Alimentos, Universidade Estadual de Campinas, Campinas, 1999.
MENDES, L. C.; MENEZES, H. C.; APARECIDA, M.; SILVA, A. P. Optimization of the roasting of robusta coffee (C. Canephora conillon) using accepatability testes and RSM. Food Quality and Preference, v. 12, n. 2, p. 153-162, 2001. http://dx.doi. org/10.1016/S0950-3293(00)00042-2.
MENDONÇA, L. M. V. L.; PEREIRA, R. G. F. A.; MENDES, A. N. G. Parâmetros bromatológicos de grãos crus e torrados de cultivares de café (Coffea arabica L.). Ciência e Tecnologia de Alimentos, v. 25, n. 2, p. 239-243, 2005.
MOURA, S. C. S. R.; GERMER, S. P. M.; ANJOS, V. D. A.; MORI, E. E. M.; MATTOSO, L. H. C.; FIRMINO, A.; NASCIMENTO, C. J.
F. Avaliações Físicas, Químicas e Sensoriais de Blends de Café Arábica com Café Canephora (Robusta). Brazilian Journal of Food Technology, v. 10, n. 4, p. 271-277, 2007.
NASCIMENTO, E. A.; AQUINO, F. J. T.; NASCIMENTO, P. M.; CHANG, R.; MORAIS, S. A. L. Composição química do café conillon em diferentes graus de torração. Ciência e Engenharia, v. 16, n. 1, p. 17-21, 2007.
NEBESNY, E.; BUDRYN, G. Evaluation of sensory attributes of brews from robusta coffee roasted under different conditions.
European Food Research and Technology, v. 224, n. 1, p. 159-165, 2006. http://dx.doi.org/10.1007/s00217-006-0308-y.
PIMENTEL, G. F. Estatística aplicada a experimentos agronômicos e florestais: exposição com exemplos e orientações para uso de aplicativos. Piracicaba: FEALQ, 2002. 309 p.
RIBEIRO, B. B.; MENDONÇA, L. M. V. L.; ASSIS, G. A.; MENDONÇA, J. M. A.; MALTA, M. R.; MONTANARI, F. F. Avaliação química e sensorial de blends de Coffea canephora Pierre e Coffea arabica L. Coffee Science, v. 9, n. 2, p. 178-186, 2014.
RODRIGUES, M. I.; IEMMA, A. F. Planejamento de experimentos e otimização de processos: uma estratégia sequencial de planejamentos. Campinas: Casa do Pão, 2005. 326 p.