ISSN 0101-2061 Food Science and Technology
OI:
D http://dx.doi.org/10.1590/1678-457X.16416
1 Introduction
Chocolate was primarily seen as a dessert with lots of sugar and fat, but it has gained popularity as a nutritionally dense product. Studies have shown that cocoa powder has more antioxidants then red wine or green tea (Lee et al., 2003). Cocoa beans contain polyphenolic compounds (flavonoids) that are important because they offer potential cardiovascular health benefits, antioxidant protections and help balance cholesterol in the body. Flavonoids have also been found to contain anti-allergy, anti-viral, anti-inflammatory and anti-carcinogenetic properties (Othman et al., 2007; Yao et al., 2004).
In 2014, the Brazilian chocolate production was 811.000 ton, reaching the third position in the world market, behind only the USA and Germany. The per capita consumption in Brazil was 2.8 kg/person/year, which is very different from other countries that showed higher consumption like Switzerland, Belgium and Germany, corresponding to 10 kg/person/year (Serviço Brasileiro de Apoio às Micro e Pequenas Empresas, 2014). In the United States, a person consumes about 11 pounds (average) of chocolate each year. Chocolate consumption is increasing in Brazil, but in 2014 there was an increase in imports of about 17.3%. In regards to job generation, chocolate manufacture generated 33.000 direct employments and 66.000 indirect employments (Associação Brasileira da Indústria de Chocolates, Cacau, Amendoim, Balas e Derivados, 2015) in 2014.
The cocoa pre-processing steps (harvest, breaking, fermentation and drying) are important to ensure high quality of beans, but cocoa flavor develops during fermentation and roasting. During roasting, flavor precursors that were developed during fermentation interact to produce the desired chocolate flavor (including aldehydes and pyrazines), which are formed between amino acids and sugars through Maillard reaction and Strecker degradation (Ramli et al., 2006; Sacchetti et al, 2015). The produced flavor is the result of combinations of many compounds including pyrazines, aldehydes, ethers, thiazoles, phenols, ketones, alcohols, furans and esters. Cocoa beans that are not roasted have a bitter, acidic, astringent, and nutty flavor; by roasting the cocoa beans, acidity is decreased by reducing the concentration of volatile acids such as acetic acid (Afoakwa et al., 2008; Ramli et al., 2006; Misnawi et al., 2004; Beckett, 2009).
Roasting is the most important technological operation in cocoa beans processing, and the degree of chemical changes depends on the temperature applied during the process. Properties of roasted beans, such as formation of a characteristic brown color, texture of roasted beans, concentration of volatile flavor compounds, total acidity and fat content, depend on roasting conditions mainly temperature and processing time (Ramli et al., 2006; Krysiak et al., 2013; Owusu et al., 2013). The selection of process parameters has a decisive influence on the nature of
Effect of the roasting temperature and time of cocoa beans on the sensory
characteristics and acceptability of chocolate
Ismara Santos ROCHA1, Ligia Regina Radomille de SANTANA2*, Sérgio Eduardo SOARES3, Eliete da Silva BISPO3
Received 02 July, 2016 Accepted 17 Feb., 2017
1Food Science Program, Pharmacy Faculty, Universidade Federal da Bahia – UFBA, Salvador, BA, Brazil 2Life Science Department, Universidade do Estado da Bahia – UNEB, Salvador, BA, Brazil
3Pharmacy Faculty, Universidade Federal da Bahia – UFBA, Salvador, BA, Brazil
*Corresponding author: [email protected]
Abstract
The aim of this work was to study the impact of the roasting temperature (80, 120 and 160 °C) and time (20, 40 and 60 min) of cocoa beans on the sensory acceptability of chocolate using response surface methodology. The results revealed that there was higher impact of roasting temperature and no influence of roasting time (in the studied levels). Lower score of consumers’ sensory acceptability was found at higher roasting temperature of cocoa beans (160 °C). The chocolate samples presented undesirable burnt odor and flavor. Roasting temperatures range 90 to 110 °C were found optimum for higher consumer’s acceptability scores (appearance, aroma, flavor, texture and overall quality attributes). Ten trained assessors consensually defined fifteen descriptors showing similarities and differences among the chocolate samples, using the methodology based on Quantitative Descriptive Analysis. The Principal Component Analysis showed that A, B and C treatments (80 °C) were characterized primarily by the brown color, sweet aroma and flavor attributes. The treatments D, E and F (120 °C) were characterized by reddish brown color, bitterness, burnt aroma and flavor, astringency attributes.
Keywords: chocolate manufacturing; sensory acceptance; quantitative descriptive analysis.
chemical and physical changes occurring in the cocoa beans, which determines the quality of the final products. The objective of this work was to evaluate the effect of roasting temperature and time of cocoa beans on the acceptability of chocolate, as well as on the sensory characteristics of the chocolate using the methodology based on Quantitative Descriptive Analysis.
2 Materials and methods
2.1 Material and experimental design
The cocoa bean samples were obtained from a commercial farm (Ihéus, Bahia State) located in the Northeast of Brazil (14°41’96”S and 39°12’109”W) under a tropical climate during the period of December/2012 and March/2013. They were produced from a blend of beans from the Pará, Parazinho and Maranhão
cultivars (all of them belonging to Forastero group). The cocoa beans were preselected, transported at ambient temperature and fermentation was carried out in standard wooden boxes under controlled conditions followed by the drying process in sun-roof surfaces until 8.0% of moisture (Cruz et al., 2015). The fermented and dry beans (about 16 kg) were toasted in a rotatable toaster (Jaf Inox, TX, São Paulo, Brazil) with temperature control device (precision ± 0.1 °C); in the beginning of the process, the toaster heating cover temperature was stabilized at 80 °C. The studied process parameters (roasting temperature and time) were based on the work of Ramli et al. (2006), with adaptations.
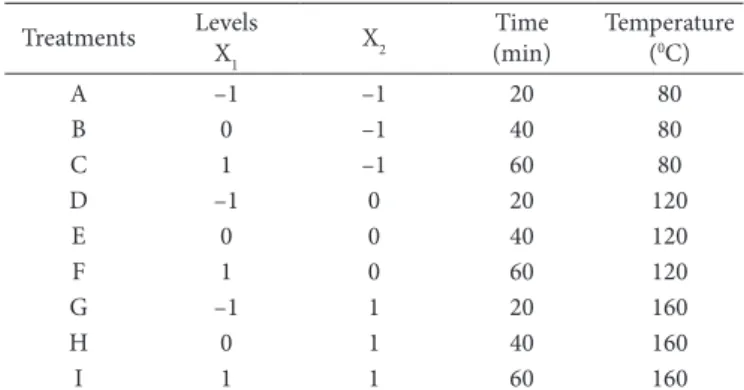
The response surface methodology (RSM) is a collection of statistical and mathematical techniques useful for developing, improving and optimizing processes in which a response of interest can be influenced by several variables and the objective is to optimize this response. It generates a mathematical model which describes the processes (Rodrigues & Lemma, 2009). In this study, RSM was used to define the effect of the independent variables (roasting process conditions) on the sensory acceptability of the chocolate samples. The experiment was conducted in triplicate according to 32 complete factorial design with two independent variables (roasting time and temperature of cocoa beans), the coded and real levels used to generate experimental runs are shown in Table 1.
2.2 Elaboration of chocolate samples
The chocolate samples (high cocoa content) were obtained using the following proportions: cocoa paste (63.0%), cocoa butter (7.0%), sugar (29.60%) and lecithin (0.4%); they were prepared in a factory (Ihéus, Bahia, Brazil). The seeds were triturated to remove the peel and germ in order to obtain cocoa nibs. The nibs were ground in a knife-grinder (Jaf Inox, FX, São Paulo, Brazil), with sugar added in this phase. The cocoa paste was then refined in a grinder-roller (Jaf Inox, MX, São Paulo, Brazil), yielding a cocoa paste with an adequate granulation (21 μm) for making chocolate. The refined paste was submitted to conching in a horizontal shell at 60 °C for 48 hours. Cocoa butter and lecithin were added during this phase. The chocolate was conveyed to a temper machine by a shaker table and was held until it reached 42 °C, when the cocoa butter stable crystals were obtained. The chocolate samples were molded into 10 g bars using a polyethylene mold, cooled, packaged and maintained at 18 °C.
2.3 Acceptability and purchase intention test of the chocolate samples
The product sensory acceptability test was carried out with 60 consumers (varied ages and both genres), recruited according to interest, availability and chocolate consumption habit. Ethical clearance approval for this study was granted by the UNEB Ethics Committee (Process n.717.905). For the test, 10g sample of each treatment was served to the consumers at 22 ± 1 oC in disposable plates, randomly codified with three-digit number (monadic sequential way and in complete blocks divided into two sessions). The assessment was carried out in individual rooms and a well-lit environment during daytime. The panelists were instructed to cleanse their palates with water between the samples. The samples were assessed to verify the potential acceptability of each treatment as to appearance, aroma, flavor, texture and overall quality attributes using a 9-point structured hedonic scale ranging 9 = liked extremely to 1 = disliked extremely (Meilgaard et al., 2007). For the purchase intention test, a 5-point structured scale (5 = certainly would buy and 1= certainly would not buy) was used.
2.4 Quantitative descriptive analysis
Differences and similarities in the sensory characteristics of chocolates were described using the methodology based on Quantitative Descriptive Analysis (Stone & Sidel, 1985). Ethical clearance approval for this work was granted by the Research Ethics Committee-UNEB (Process n.717.905). Twenty candidates (employees, Gastronomy and Nutrition students and researchers from the Federal University of Bahia) were pre-screened based on availability, ability to discriminate differences between products and participation in group discussions. Six training sessions were given to these candidates, and sensory descriptors for appearance, aroma, flavor, texture attributes were developed through brainstorming about similarity and differences among chocolate samples. The training following step consisted of the development and definition of each descriptive term and the production of consensual reference samples (Table 2).
Training was finished when individuals had no difficulty to evaluate samples using the descriptive evaluation ballot. In a final session, each sample was evaluated in triplicate by each assessor
Table 1. Coded and real levels of the independent variables used for complete factorial design.
Treatments Levels
X1 X2
Time (min)
Temperature (0C)
A –1 –1 20 80
B 0 –1 40 80
C 1 –1 60 80
D –1 0 20 120
E 0 0 40 120
F 1 0 60 120
G –1 1 20 160
H 0 1 40 160
I 1 1 60 160
using a complete block in the statistical design. The chocolate samples (25 ± 1 °C) were placed in individual three-digit-coded plastic plates (10 g) and were presented to assessors during daylight in individual sensory booths, and the assessors were instructed to cleanse their palates with filtered water between samples. On the unstructured scales of 9 cm labeled on both ends, with descriptive terms on the left (lower anchor) and on the right (upper anchor), the assessors rated the intensity of each descriptor for each sample, being required to test attributes in the following order: Appearance: brown color (scales labeled from light to dark), red-brown color (light to dark), brightness (light to strong), Aroma: chocolate (scales labeled low to high intensity), burnt (none to high), sweetish (none to high), Flavor: chocolate (low to high), bitter (none to high), sweet (none to high),
acid (none to high), burnt (none to high), astringent (none to high), Texture: firmness (low to high), friability (low to high), melting (low to high).
2.5 Statistical analysis
Acceptability results test were assessed using Kruskal-Wallis Nonparametric test (5% significance), analysis of variance (ANOVA) of the linear model and response surface plots were generated for different interactions (acceptability attributes x roasting temperature and time), followed by Tukey test (p ≤ 0.05). For the Quantitative Descriptive Analysis, a two-way ANOVA, samples and panelists were used as fixed effects, the Principal Component Analysis (PCA) was performed on the averages (samples and
Table 2. Descriptive terms and reference materials used by panelist during training and quantitative descriptive analysis sessions.
Sensory Descriptors Definition Reference Materials
Appearance
Brown Color Characteristic color of chocolate/ similar color to the mahogany brown
Clear: Alkaline cocoa powder at 10% added in 100 g corn starch suspension
(Unilever Ltda, Brazil)
Dark: Alkaline cocoa powder at 80% added in 100 g corn starch suspension (Unilever Ltda, Brazil)
Reddish-brown
Color Dark color between reddish and brown.
None: Alkaline cocoa powder at 10% added in 100 g corn starch suspension (Unilever Ltda, Brazil)
Dark: Alkaline cocoa powder at 10% added in 100 g corn starch suspension + red aniline dye (Arcolor, Brazil)
Brightness Light emits shine or reflects greater shine. Little: Dark chocolate 90% cocoa (AMA-BA, Brazil)
Much: Dark chocolate 90% cocoa with butter on surface (AMA-BA, Brazil)
Aroma
Chocolate / Cocoa Odor related to chocolate/ cocoa. Little: powder chocolate solution at 0.5%. (Nestlé Ltda, Brazil).
Much: powder chocolate solution at 5.0%. (Nestlé Ltda, Brazil). Sweet / Caramel Odor obtained from caramel/sugar. Little: dry sugar (União Ltda, Brazil).
Much: sugar warmed at 120 °C until brown color. Burnt Odor related to cocoa seed very toasted. None: dry cocoa seed without toasting.
Much: cocoa beans toasted at 170 °C for 60 min.
Flavor
Chocolate / Cocoa Little: powder chocolate solution at 0.5%. (Nestlé Ltda, Brazil).
Much: powder chocolate solution at 5.0%. (Nestlé Ltda, Brazil). Bitter Taste Characteristic taste of caffeine. Unpleasant taste of caffeine. None: distilled water.
Much: Caffeine solution at 0.5% (Food Degree, Brazil). Sweet Taste Sweet taste obtained from sugar. Caramel flavor. Little: sugar solution at 1.0%. (União Ltda, Brazil).
Much: sugar solution at 10.0% (União Ltda, Brazil). Citric fruits Flavor related to citric fruit (tangerine, orange, lemon) None: distilled water.
Much: Tangerine oil solution at 0.5% (Arcolor, Brazil). Burnt Flavor related to very toasted cocoa beans. None: dry cocoa beans without roasting.
Much: cocoa beans roasted at 170 °C during 60 min.
Astringent
Drying sensation from tasting cocoa powder or green fruit. Contraction of mouth mucus.
None: milk chocolate (Nestlé Ltda, Brazil).
Much: Dark chocolate 90% cocoa (AMA-BA, Brazil).
Texture
Firmness Force needed to bite through the chocolate sample.
Little Firm: milk chocolate (Nestlé Ltda, Brazil).
Much Firm: Dark chocolate 90% cocoa (AMA-BA, Brazil).
Fraturability Easily broken or rupture. Little: Dark chocolate 90% cocoa (AMA-BA, Brazil).
Much: milk chocolate (Nestlé Ltda, Brazil).
Melting Length of time for chocolate to melt in the mouth /Liquefied.
Little: Dark chocolate 90% cocoa (AMA-BA, Brazil) warmed in microwave
oven during 20”.
replicates). All the experimental procedures were carried out in triplicate. Collected data were processed using the Statistical Analysis System package (Statistical Analysis System, 2014).
3 Results and discussion
3.1 Consumers acceptability and purchase intention test of the chocolate samples
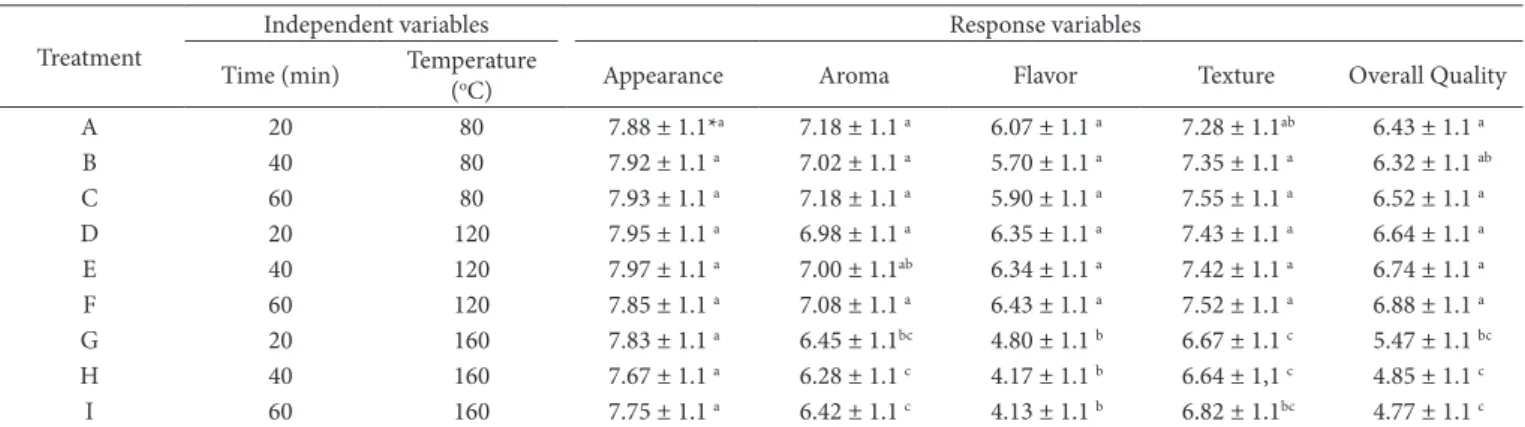
The results obtained for the acceptability test of the chocolate samples are shown in Table 3. Regarding to the appearance attribute, scores were between 7.75 and 7.97 (none significant difference among treatments), corresponding to the hedonic term “liked much”, these results revealed good acceptance of the chocolate samples. The scores of the aroma attribute varied between 6.98 and 7.18 (“liked moderately”), and the flavor attribute was between 5.70 and 6.43 (“liked lightly”). The chocolate samples obtained from cocoa beans submitted to higher roasting temperature (160 °C) showed lower acceptance scores as to the aroma attribute (6.28 to 6.45) corresponding to “liked lightly”, and to the flavor attribute (4.13 to 4.80) corresponding to “disliked lightly” (Table 3). There were consumer commentaries in the evaluation ballot on the burnt flavor of these treatments (G, H and I); probably higher temperatures (160 °C) caused burnt and bitter taste in the cocoa beans that were evidenced in the chocolate samples.
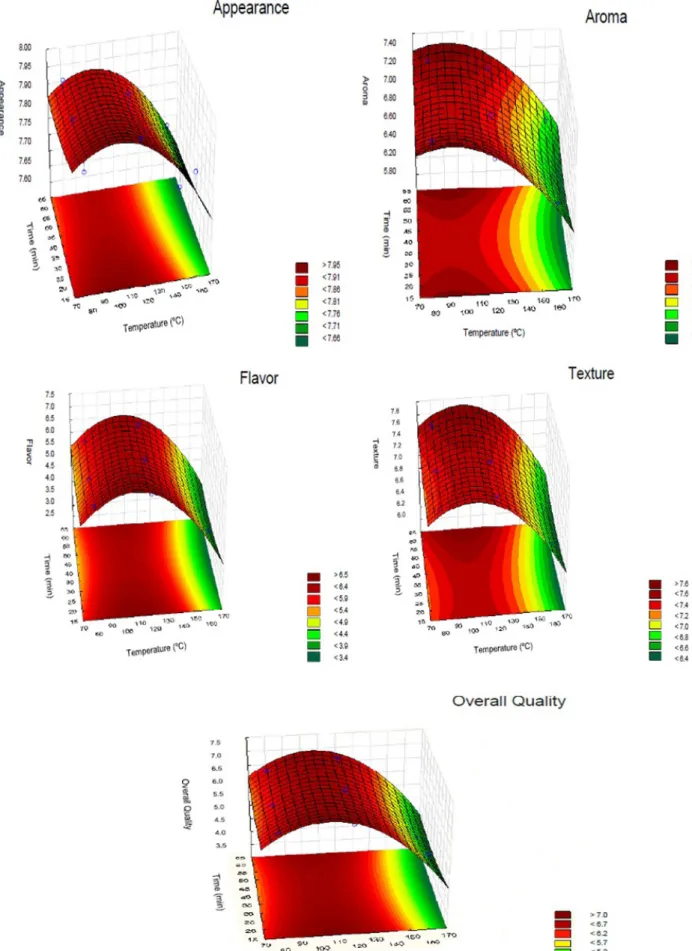
Response surface plots of the variability of sensory acceptance score with change in roasting temperature and time for dark chocolate samples are shown in Figure 1 (relative to appearance, aroma, flavor, texture and overall quality attributes). It is evident from the figure that there are differences in the shape of the response surface plots obtained for the studied samples. These differences can be attributed to the effect of processing conditions (roasting temperature and time of cocoa beans). Akinoso & Adeyanju (2012) reported that response surface plot helps to visualize the shape of the response surface and give useful information about model fitness. These response surface plots showed that higher scores of sensory acceptance were obtained from roasting temperature range 90 to 110 °C. On the other hand, the sensory acceptance was significantly lower for the samples obtained from higher roasting temperature (150 to 160 °C), for
the aroma, flavor, texture and overall quality attributes (Table 3). The response surface plots showed that acceptability decreased with higher roasting temperature of cocoa beans (Figure 1). This might be due to bitter and burnt taste that caused in the chocolate samples. On the basis of the ANOVA results, it was observed that the linear effect of the roasting temperature was significant (p ≤ 0.05) on the appearance, aroma and flavor attributes of chocolate samples, and the linear effect of the roasting time was non-significant (p > 0.05) on these attributes in the studied levels (Table 4).
Similar results were found by Ramli et al. (2006) in the study on the influence of roasting conditions (temperature from 120 to 170 °C and time from 20 to 50 min) on volatile flavor compound and sensory characteristics of roasted Malaysian cocoa beans. The authors revealed that the increase of roasting time and temperature had a significant effect on burnt flavor of cocoa beans when temperature was increased to 160 °C. There was a significant increase in the bitter taste (because it got burnt), particularly when roasting time was increased to 50 min. The bitter taste continued to increase at higher temperature of 170 °C and with increasing roasting time. Certain compounds (alkaloids and methylpyrazines) were detected in roasted cocoa beans after exceeding the time and temperature of roasting or as a sign of over-roasting (high temperature or long time of roasting). It is an uneconomical condition. However, the study showed that roasting at 120 °C for 50 min produced greater cocoa flavor, lower sour taste and astringency.
Perego et al. (2005) studied an analytical method to determine flavor and aroma compounds content of different cocoa blends. Compounds responsible for the aroma are methylpyrazines and nitrogen heterocyclic substances formed during roasting process responsible for the respective sweet and strong cocoa aroma. Xanthine alkaloids, namely caffeine and theobromine, are responsible for the bitter taste of cocoa beans (Nazaruddin et al., 2001).
In this study it was observed that linear effect of the roasting temperature and time were significant (p ≤ 0.05), regarding to the texture attribute of chocolate samples. The response surface plot showed that higher scores of the texture attribute were
Table 3. Levels of process variables and scores of acceptability test for chocolate samples obtained from cocoa beans roasted in experimental conditions.
Treatment
Independent variables Response variables
Time (min) Temperature
(oC) Appearance Aroma Flavor Texture Overall Quality
A 20 80 7.88 ± 1.1*a 7.18 ± 1.1 a 6.07 ± 1.1 a 7.28 ± 1.1ab 6.43 ± 1.1 a
B 40 80 7.92 ± 1.1 a 7.02 ± 1.1 a 5.70 ± 1.1 a 7.35 ± 1.1 a 6.32 ± 1.1 ab
C 60 80 7.93 ± 1.1 a 7.18 ± 1.1 a 5.90 ± 1.1 a 7.55 ± 1.1 a 6.52 ± 1.1 a
D 20 120 7.95 ± 1.1 a 6.98 ± 1.1 a 6.35 ± 1.1 a 7.43 ± 1.1 a 6.64 ± 1.1 a
E 40 120 7.97 ± 1.1 a 7.00 ± 1.1ab 6.34 ± 1.1 a 7.42 ± 1.1 a 6.74 ± 1.1 a
F 60 120 7.85 ± 1.1 a 7.08 ± 1.1 a 6.43 ± 1.1 a 7.52 ± 1.1 a 6.88 ± 1.1 a
G 20 160 7.83 ± 1.1 a 6.45 ± 1.1bc 4.80 ± 1.1 b 6.67 ± 1.1 c 5.47 ± 1.1 bc
H 40 160 7.67 ± 1.1 a 6.28 ± 1.1 c 4.17 ± 1.1 b 6.64 ± 1,1 c 4.85 ± 1.1 c
I 60 160 7.75 ± 1.1 a 6.42 ± 1.1 c 4.13 ± 1.1 b 6.82 ± 1.1bc 4.77 ± 1.1 c
found to the roasting temperature range 90-110 °C and higher roasting time (60 min); the scores were between 7.52 and 7.55, corresponding to the hedonic term “liked much”. The chocolate samples obtained from cocoa beans submitted to higher roasting temperature (~160 °C) showed lower acceptance scores (6.64 to 6.82) corresponding to “liked moderately” (Table 3). For the overall quality of the chocolate samples, the ANOVA results showed that linear effect of the roasting temperature was significant (p ≤ 0.05) and the response surface plot showed that higher scores were obtained from the roasting temperature range 90-110 °C (scores between 6.32 and 6.88, corresponding to hedonic term “liked lightly” and “liked moderately”). Chocolate samples obtained from cocoa beans submitted to higher roasting temperature (160 °C) also showed lower scores (4.77 to 5.47), corresponding to “disliked lightly” and “no liked/no disliked” (Table 3).
Torres-Moreno et al. (2012) carried out a study on sensory acceptability (overall impression, color, odor, flavor and texture) of dark chocolate samples from different origins and processing conditions (evaluated by 95 consumers).The use of roasting long time decreased flavor scores to Ghanaian chocolate samples while it had no effect on acceptability of Ecuadorian chocolates. This response was observed for most consumers (two subgroups with different consumption frequency of dark chocolate). However, for a third group of consumers identified as distinguishers, the most acceptable dark chocolate samples were those produced with specific combinations of roasting and conching time for each studied cocoa geographical origin. The authors concluded that, to produce dark chocolate from a single origin, it is important to know the target market preferences and to select roasting and conching appropriate conditions.
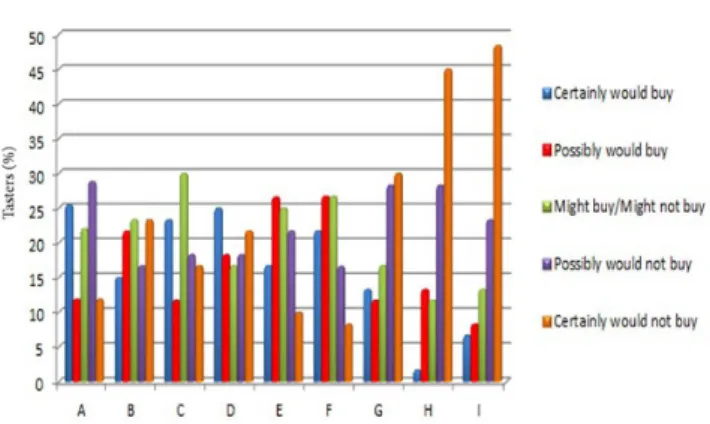
Figure 2 shows the frequency distribution of the consumer purchase intention test for the chocolate samples. The treatments obtained from cocoa beans submitted to higher roasting temperature (160 °C), regardless of the roasting time, showed higher negative purchase intention by the consumers, adding the categories 1 and 2 (“certainly would not buy” and “possibly would not buy”, respectively) the scores of 58% (G treatment), 73% (H) and 72% (I) were obtained, if they were available in the market, confirming lower acceptability of these treatments. Higher positive consumers’ purchase intention was observed from the treatments obtained from cocoa beans submitted to roasting temperature of 120 °C (D, E and F treatments).
Few studies have focused on the sensory acceptability of dark chocolate (high cocoa content) by consumers and the factors affecting it. It seems to be very important to consider not only the physicochemical properties and cocoa origin and the processing conditions of the products to predict consumer acceptability, but also the influence on consumer response of
demographic characteristics, consumer habits and individual preferences (Costell et al., 2010).
3.2 Quantitative descriptive analysis
The final panelists were selected based on their capacity to discriminate among different samples, repeatability and agreement with the group (Damasio & Costell, 1991). Analysis of Variance of 2 factors (sample and repetition) was performed for each panelist with respect to each attribute and the final panelists were selected according to significance levels (p) for Fsample (p < 0.50) and no significant Frepetition (p > 0.05). For this selection, fourteen candidates evaluated the chocolate samples in three repetitions, with respect to the pre-determined attributes. The agreement of the sensory panel was also verified in this step: the panelists’ individual means should be similar among each other and also close to the panel’s means for all the evaluated attributes and the interaction sample x panelist should be no significant (p > 0.05). Thus, ten panelists were definitively selected for the final tests, based on their ability to discriminate samples (p Fsample < 0.50) and repeatability (p Frepetition > 0.05), and no discrepancies were observed among them (data not shown).
Based on the results obtained from the acceptability and the purchase intention test, six treatments (A, B, C, D, E and F) were selected to be evaluated using Quantitative Descriptive Analysis methodology. The results (Table 5) showed that there were significant differences (p ≤ 0.05) in the sensory characteristics of the chocolate samples obtained from the roasted cocoa beans in the experimental conditions, according to QDA. The A, B and C treatments were distinguished from the others as a result of their higher intensity of the descriptors: brown color, sweet odor and taste. However, the D, E and F treatments demonstrated a more
Table 4. ANOVA results of the linear model effect parameters on the acceptability attributes of chocolate samples.
Variance Appearance Aroma Flavor Texture Overall Quality
Source F-value p-value F-value p-value F-value p-value F- alue p-value F-value p-value
A-Temperature 5.76 0.066 163.3 0.001* 76.75 0.006* 220.3 0.008* 36.38 0.002*
B-Time 0.32 0.744 4.59 0.092 2.15 0.23 11.7 0.02* 0.48 0.64
A: linear effect of roasting temperature; B: linear effect of roasting time. *Significant at p < 0.05.
Frauendorfer & Schieberle (2008) compared the key odorants present in raw fermented cocoa beans with those formed after roasting. Results showed that the largest impact on the aroma caused by the roasting process was observed from the Strecker degradation; aldehydes 3-methylbutanal (malty) and phenylacetaldehyde (honey-like) were obtained, as well as for 4-hydroxy-2,5-dimethyl-3(2H)-furanone (caramel-like), whose concentrations were significantly higher in the roasted cocoa beans.
intense of reddish-brown color, burnt aroma and flavor, bitter taste and astringency. All treatments showed high intensity of chocolate aroma and flavor, as well as firmness. The brightness, citric fruits flavor, fracturability and melting quality presented low intensity and there was no significant difference (p > 0.05) among the treatments, thus, they were considered to be not important in characterizing these chocolate samples. The burnt aroma and flavor also presented low intensity, but showed significant differences among the samples.
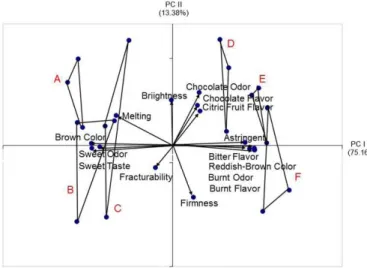
Figure 3 illustrates the Principal Component Analysis (PCA) results. Each sample is represented by a triangle and each vertex of the triangles corresponds to the mean value attributed by the panelist group for each replicate. Samples are located near the descriptors that characterize them. In the present study, the two principal components were used together and explained 88.54% of the total variability observed among the treatments. PCA confirmed ANOVA results (Table 5). The A, B and C treatments were characterized by the descriptors brown color, melting, sweet odor and taste. The D, E and F treatments were characterized by reddish-brown color, bitter taste, burnt odor and flavor, astringency. The descriptors brightness, citric fruit flavor, chocolate odor and flavor, fracturability and firmness presented intermediate for all treatments.
Krysiak et al. (2013) concluded that bean browning process rate is determined by temperature and duration of temperature action. Above 100 °C, non-enzymatic browning processes are intensified. It is assumed that the color of the raw beans comes from polyphenolic compounds and anthocyanins which, during fermentation process, form poly-condensate products responsible for the typical brown color of cocoa beans. During the roasting process, other changes occur, which are caused by oxidation and polymerization reactions of polyphenols and the decomposition of proteins, Maillard and starch dextrinization reactions (Redgwell et al., 2003).
Table 5. Mean values for the descriptors terms, regarding to appearance, aroma, flavor and texture of the chocolate samples obtained from Quantitative Descriptive Analysis.
Descriptor Treatment SMD
A B C D E F
Brown Color 6.36a 6.46ª 6.35ª 5.57b 5.64b 5.44b 0.64
Reddish-brown Color 2.95b 2.92b 2.80b 4.02ª 416ª 4.08ª 0.54
Brightness 4.69ª 4.36ª 4.38ª 4.52ª 4.63ª 4.36ª 0.63
Chocolate Aroma 6.15ª 6.06ª 6.30ª 6.26ª 6.29ª 6.24ª 0.42
Sweet/Caramel Aroma 4.99ª 4.83ab 4.83ab 4.54bc 4.49bc 4.37c 0.44
Burnt Aroma 2.01b 1.94b 1.91b 2.33ab 2.61ª 2.74ª 0.43
Chocolate Flavor 6.18ª 6.36ª 6.44ª 6.47ª 6.49ª 6.45ª 0.50
Bitter 4.54c 4.76bc 5.01b 5.99ª 6.11ª 6.37ª 0.39
Sweet Taste 4.14ª 4.09ab 3.75b 3.06c 3.02c 2.81c 0.38
Acid/Citric Fruits Flavor 2.02ª 2.09ª 2.07ª 1.96ª 2.27ª 2.21ª 0.51
Burnt Flavor 3.22b 3.16b 3.50b 4.39ª 4.68ª 4.76ª 0.51
Astringency 3.37b 3.48ab 3.41b 3.68ab 3.95ª 3.93ª 0.51
Firmness 6.69ª 6.69ª 6.73ª 6.81ª 6.66ª 6.81ª 0.43
Fracturability 2.77ª 2.61ª 2.47ª 2.61ª 2.47ª 2.67ª 0.54
Melting Quality 2.49ª 2.45ª 2.33ª 2.22ª 2.04ª 2.12ª 0.52
Treatments: A = Temperature 80 °C/ time 20 min; B = T 80 °C/ t 40 min; C = T 80 °C/ t 60 min; D = T 120 °C/ t 20 min; E = T 120 °C/ t 40 min; F = T 120 °C/ t 60 min. SMD = Significant Minimum Difference. Letters compare significant differences between treatments for each attribute, according to the Tukey test (p ≤ 0.05).
fermentation. Food Science and Technology (Campinas.), 35(2), 279-284. http://dx.doi.org/10.1590/1678-457X.6541.
Damasio, M. H., & Costell, E. (1991). Análisis sensorial descriptivo:
generación de descriptores y selección de catadores. Revista
Agroquimica de Technologia de Alimentos, 31(2), 165-178.
Frauendorfer, F., & Schieberle, P. (2008). Changes in key aroma compounds of Criollo cocoa beans during roasting. Journal of Agricultural and
Food Chemistry, 56(21), 10244-10251. PMid:18925740. http://dx.doi.
org/10.1021/jf802098f.
Krysiak, W., Adamski, R., & Żyżelewicz, D. (2013). Factors affecting the color of roasted cocoa bean. Journal of Food Quality, 36(1), 21-31. http://dx.doi.org/10.1111/jfq.12009.
Lee, S.-Y., Yoo, S.-S., Lee, M.-J., Kwon, I.-B., & Pyun, Y.-R. (2003). Optimalization of nibs roasting in cocoa bean processing with Lotte–Better taste and color process. Food Science and Biotechnology, 10(1), 286-293. http://dx.doi.org/10.1007/ s11947-010-0456-8. Meilgaard, M., Civille, G. V., & Carr, B. T. (2007). Sensory evaluation
techniques (4th ed., 448 p.). Boca Raton: CRC Press.
Misnawi, J., Jinap, S., Jamilah, B., & Nazamid, S. (2004). Sensory properties of cocoa liquor as affected by polyphenol concentration and duration of roasting. Food Quality and Preference, 15(5), 403-409. http://dx.doi.org/10.1016/S0950-3293(03)00097-1.
Misnawi, J., Jinap, S., Jamilah, B., & Nazamid, S. (2005). Changes in polyphenol ability to produce astringency during roasting of cocoa liquor. Journal of the Science of Food and Agriculture, 85(6), 917-924. http://dx.doi.org/10.1002/jsfa.1954.
Nazaruddin, R., Ayub, M. Y., Mamot, S., & Heng, C. H. (2001). HPLC determination of methylxanthines and polyphenols levels in cocoa and chocolate products. Malaysia Journal Analytical Science, 7(1), 377-386. http://dx.doi.org/10.5897/ajb2013.12122.
Othman, A., Ismail, A., Ghani, N. A., & Adenan, I. (2007). Antioxidant capacity and phenolic content of cocoa beans. Journal of Food Chemistry, 100(1), 1523-1530. http://dx.doi.org/10.1016/j.foodchem.2005.12.021. Owusu, M., Petersen, M. A., & Heimdal, H. (2013). Relationship of sensory and instrumental aroma measurements of dark chocolate as influenced by fermentation method, roasting and conching conditions. Journal of Food Science and Technology, 50(5), 909-917. PMid:24425997. http://dx.doi.org/10.1007/s13197-011-0420-2. Perego, P., Fabiano, B., Cavicchioli, M., & Borgui, M. D. (2005). Cocoa
quality and processing: A study by solid-phase microextraction
and gas chromatography analysis of methylpyrazines. Food and
Bioproducts Processing, 84(4), 291-297. http://dx.doi.org/10.1205/
fbio.82.4.291.56402.
Ramli, N., Hassan, O., Said, M., Samsudin, W., & Idris, N. A. (2006). Influence of roasting conditions on volatile flavor of roasted Malaysian cocoa beans. Journal of Food Processing and Preservation, 30(3), 280-298. http://dx.doi.org/10.1111/j.1745-4549.2006.00065.x. Redgwell, R. J., Trovato, V., & Curti, D. (2003). Cocoa bean carbohydrates: Roasting-induced changes and polymer interactions. Food Chemistry, 80(1), 511-516. http://dx.doi.org/10.1016/S0308-8146(02)00320-5. Rodrigues, M. I., & Lemma, A. F. (2009). Experiment design & process
optimization (2nd ed., 358 p.). Campinas: Cárita Publishing.
Sacchetti, G., Ioannone, F., Gregorio, M., Mattia, C., Serafini, M., & Mastrocola, D. (2015). Non enzymatic browning during cocoa roasting as affected by processing time and temperature. Journal
of Food Engineering, 169(1), 44-52. http://dx.doi.org/10.1016/j.
jfoodeng.2015.08.018.
Statistical Analysis System. (2014). User’s procedures guide: version 6.0. Cary: SAS Institute.
Misnawi et al. (2005) studied changes in the polyphenols ability to produce astringency during cocoa beans roasting. Results indicated that astringency reduction in cocoa products is determined not only by the loss of polyphenols through oxidation and exudation from the cocoa beans during processing, but also by interactions with protein throughout the process. The polyphenol–protein interaction would reduce the capacity of polyphenol to precipitate salivary proline-rich protein, thus decreasing the astringent sensation. It has been suggested that polyphenol-protein complexes may be more unstable at higher temperatures of cocoa beans roasting that can decrease the capacity of polyphenols to interact with protein and hence to produce an astringent sensation. Astringency is often confused with bitterness because many individuals do not clearly understand its nature, and many polyphenols exhibit both bitterness and astringency. In another study on cocoa beans roasting, Ramli et al. (2006) also found that the burnt taste and odor increased with increasing time and roasting temperature (170 °C for 50 min left higher burnt flavor, bitter taste and astringency). The authors indicated that roasting at 120 °C for 40 min produced greater cocoa flavor, lower astringency and sour taste.
4 Conclusions
Lower score of consumers’ sensory acceptability was found with higher roasting temperature of cocoa beans (160 °C). The chocolate samples presented undesirable burnt odor and flavor. The response surface plots showed that higher scores of sensory attributes were obtained from roasting temperature of 90-110 °C, regardless of the roasting time (within studied levels).
The studied treatments presented significant differences according to Quantitative Descriptive Analysis. Two principal components were used together and explained 88.54% of the total variability observed among the treatments. The A, B and C treatments were more characterized by the brown color, melting, sweet odor and taste. The D, E and F treatments were primarily characterized by the reddish-brown color, bitter taste, burnt odor and flavor, as well as astringency.
References
Afoakwa, E. O., Paterson, A., Fowler, M., & Ryan, A. (2008). Flavor formation and character in cocoa and chocolate: a critical review.
Critical Reviews in Food Science and Nutrition, 48(9), 840-857.
PMid:18788009. http://dx.doi.org/10.1080/10408390701719272. Akinoso, R., & Adeyanju, J. A. (2012). Optimization of edible oil extraction
from ofada rice Bran using response surface methodology. Food
Bioprocess Technology, 5(4), 1372-1378. http://dx.doi.org/10.1007/
s11947-010-0456-8.
Associação Brasileira da Indústria de Chocolates, Cacau, Amendoim, Balas e Derivados. (2015). O potencial de mercado para o chocolate.
São Paulo. Retrieved from http://www.abicab. org.br
Beckett, S. T. (2009) Industrial chocolate manufacture and use (4th ed., 732 p.). Hoboken: Blackwell Publishing.
Costell, E., Tarrega, A., & Bayarri, S. (2010). Food acceptance: the role of consumer perception and attitudes. Chemosensory Perception, 3(1), 42-50. http://dx.doi.org/10.1007/s12078-009-9057-1. Cruz, J. F. M., Leite, P. B., Soares, S. E., & Bispo, E. S. (2015). Bioactive
processing conditions. Journal of the Science of Food and
Agriculture, 92(2), 404-411. PMid:21834089. http://dx.doi.
org/10.1002/jsfa.4592.
Yao, L. H., Jiang, Y. M., Shi, J., Tomas-Barberan, F. A., Datta, N., Singanusong, R., & Chen, S. S. (2004). Flavonoids in food and their health benefits. Plant Foods for Human Nutrition (Dordrecht,
Netherlands), 59(1), 113-122. PMid:15678717. http://dx.doi.
org/10.1007/s11130-004-0049-7. Serviço Brasileiro de Apoio às Micro e Pequenas Empresas. (2014). O
mercado do cacau como oportunidade para os pequenos negócios.
Retrieved from http://www.sebrae2014.com.br/Sebrae/Cacau_pdf.pdf. Stone, H., & Sidel, J. L. (1985). Descriptive analysis. In H. Stone &
J. L. Sidel, (Eds.), Sensory evaluation practices (311 p). London: Academic Press.