A Work Project, presented as part of the requirements for the Award of a Master’s Degree in Management from the NOVA – School of Business and Economics
An Internationalization strategy for a US
Medical Diagnostic Firm
Stephen Smith, No 2705
A Project carried out in the International Business area, under the supervision of: Professor Emanuel Gomes.
!
Preface!/!Acknowledgment!
This thesis was only possible due to support and guidance of the people that I would like to mention. First of all, and utmost I would like to express my gratitude to my supervisor, Emanuel Gomes, his constant support, guidance and feedback made this thesis possible. I would also like to thank the staff at AWU for giving up their time, knowledge and organizational information that has made this thesis possible. Finally, I would like to thank my friends and especially a huge thanks to Caitlyn and my family who have kept me focused, positive and resilient throughout.
Abstract!!
This paper aims to help an American Medical diagnostic firm internationalize further through the use of International Market Selection techniques. The research consisted of interviewing the Director of Operations and a high up anonymous source of the company, as well as using secondary data. Based on interview data, existing literature, as well as secondary data, this paper ranked countries based on market potential and clustered countries based on macro similarities. A CAGE framework was utilized for an in depth analysis of the two top scoring markets. The research found that the most promising market for the company to enter was Australia and found two similar clusters that could potentially be utilized for further expansion. This paper concludes by calling for more research into the countries of those cluster to really analyze the best potential market for the next expansion.
Table!of!Contents!
Preface!/!Acknowledgment!...!2! Abstract!...!2! List!of!Abbreviations!...!3! Introduction!...!3! Literature!Review!...!5! Methodology!...!8! Analysis!and!Results!...!12! Country!Analysis!...!17! Conclusion!...!23! References!...!24! Appendix!...!25! Supplementary!Appendix!...!26!List!of!Abbreviations!!
Introduction!
Internationalization is regarded as a necessary requirement for the survival of most business firms, as well as a part of the ongoing strategy process (Melin, 1992). Researchers have focused on this topic for years, but have generally turned their attention to multinational corporations (MNCs). This approach was acceptable in the past, but now in our globalized environment, even small and medium enterprises (SME) see the need to expand internationally and this area has been somewhat neglected in the past (Wright, et al., 2007; Jansson, & Sandberg, 2008).
AWU- Company name NATO- North Atlantic Treaty Organization
EFTA- European Free Trade Association OECD- Organization for Economic Co-operation and Development IMS- International Market Selection SME- Small and Medium sized enterprises
HDI- Human Development Index SADC- South African Development Community
MIKTA-Mexico, Indonesia, Korea, Turkey, Australia UN- United Nations
MNC- Multinational Corporations WTO- World Trade Organization
Utilizing factual data and market research, this work project aims to assist AWU in finding a promising foreign market to enter, as well as countries with similar characteristics that could be necessary for future expansion. AWU is a private medium-sized enterprise that sells medical diagnostic equipment and is based in New Jersey, USA. The firm already has an international presence in 33 countries, although, due to a changing home market they wanted to take the initiative and increase their international presence.
Utilizing tools from past research on International Market Selection (IMS), and information from the company, this work project aims to find AWUs next potential market. It is important to acknowledge before moving forward that internationalization strategies have to be tailored to the specific needs of an organization, as there is no universal approach to going global and the decision is a dynamic one (Czinkota, 2004). In particular, IMS is used by firms to select the foreign countries or regions that will become an organizations geographic target market (Brewer, 2001). Combining a cluster and ranking analysis, whilst incorporating the cultural aspect of IMS to find markets will allow for a complete overview of potential markets and find countries for further expansion. After the initial screening, an in-depth analysis of the two top scoring countries will occur, as well as an internal analysis of the company to see which market will be the most suitable for AWU to enter. A CAGE framework will also be applied to capture the psychic distance and cultural information neglected by Hofstede’s (2001) cultural distance. Incorporating the cultural/psychic distance aspect with the systematic approach will ensure that the limitations of each approach are nullified (He et al, 2016).
It is also noteworthy that entry modes will not be discussed in this thesis, although it is acknowledged that IMS and entry mode are intricately linked (Douglas et al, 1982). This decision was made as the company to date has been utilizing distributors and they do not feel that this is the right point to change their entry modes.
Literature!Review!
Companies who want to expand internationally are faced with the complexities of screening and evaluating foreign markets. National markets vary in terms of market attractiveness, due to the discrepancies between economic environment, growth rates and political stability, to name a few (Cavusgil, 2004). These dissimilarities between country markets make this decision complex, even more so for SME’s who generally have lower competencies in regard to foreign markets (Papadopoulos et al, 2002; Johnson & Valne, 1990). When identifying potential foreign markets, Kumar (2004) states that it comes down to three stages, firstly there’s the screening stage, then the identification stage and finally the selection stage. The importance of IMS cannot be underestimated, as it is critical to the definition of foreign entry strategy and many scholars have emphasized a link between effective IMS and successful international market expansion (Papadopoulos et al, 2002). According to Andersen and Buvik (2001) organizations can take three approaches to IMS and these are the systematic, the unsystematic and the relationship approach. The systematic approach relies on the utilization of statistical methods to evaluate market potential, and generally relies on macro indicators. The unsystematic approach, emphasizes more on the psychic distance between a firm and the foreign market, with psychic distance being any factor that can interrupt the flow of information between the firm and the potential market. The third approach to IMS is the relationship approach, focusing on international expansion through existing relationships that are within the organization (Andersen & Buvik, 2001).
Generally, organizations tend to rely on the systematic and unsystematic approach when making IMS decisions, as the relationship approach requires existing relationships that are not always present. In particular, there has been much research into the systematic approach and how to effectively identify and select which market to enter, with much of the literature primarily focusing on two normative market screening models, cluster and ranking analysis
(Sakarya, 2007).
Cluster analysis involves the grouping of countries according to their “similarities in economic development” (Cavusgil, 2004:608). The similarities between nations allow managers to compare and evaluate possible synergies and decide on countries to expand into. However, cluster analysis has been repeatedly criticized for being too reliant on unreliable aggregate macro indicators that lack comparability (Cavusgil, 2004). This screening model also ignores country heterogeneity, assuming that all consumers are the same within a nation. Due to these conditions, some nations with excellent market potential could be ignored (Cavusgil, 2004; Sakarya, 2007). Cluster analysis is therefore useful in identifying macro similarities between nations, but it is not useful for identifying which countries are attractive or show the most market potential. This concern is resolved through the use of ranking analysis, which orders countries into a meaningful order, based on aggregate market potential (Cavusgil, 2004). Ordering countries based on aggregate market potential highlights what markets are most likely to be open to the product offering and also where the company can gain a larger market share and in turn profitability.
Alike the critiques of clustering, ranking analysis also suffers from lack of product specificity in the indicators (Cavusgil, 1997). Ranking is also deemed to be unreliable, as it can be manipulated to match managers’ preferences through the altering of weightings, or adding more specific firm/industry dimensions. Albeit these methods have their flaws, when combined, these two methods work in synergy and are useful tools for IMS and provide “unique” and “highly valuable” information for the initial country screening phase (Cavusgil, 2004).
Although, these are the traditional methods for IMS, Sakarya (2007) argues traditional IMS analysis fails to recognize the market dynamism and future market potential of emerging markets. A key criterion neglected through ranking and cluster analysis is the aspect of
“culture.” This is important as culture is seen as a prominent driver of international business activity and it should be recognized for future analysis (Cavusgil, 2004). Sakarya (2007) presents a four criteria solution to allow for emerging economies to be incorporated and fairly treated in IMS, these are the incorporation of long term market potential (Formula 1), cultural distance (Formula 2), competitive strength of the industry as well as customer receptiveness.
Formula 1: Long Term Market Potential ! = # + %# − (()*+,(# − -./+,(#)
Q = Total Long term Market Potential
P = Population
NP = Population growth
Dev GDP = Average GDP in developed markets
Adj GDP = GDP per capita (Purchasing Power Parity)
Formula 2: Cultural Distance Formula
1(2= (3425− 3426)6 7
485
CD= Cultural Distance
Iij1= Score for Cultural distance variable (home country)
Iij2= Score for Cultural distance variable (comparison country)
On the other hand, the unsystematic model generally reduces IMS complexity by focusing on cultural/psychic distance, and it can be argued that this is more relevant to international expansion as smaller firms generally do not adopt the systematic approach due to lack of resources (Andersen & Buvik, 2002). Psychic distance and culture are therefore key factors when looking at foreign market attractiveness, altering how a firm approaches marketing, strategies, organizational performance and entry mode (Kogut & Singh,1988; Andersen & Buvik, 2002). In regard to culture, Hofstede’s (2001) cultural distance has been one of the most widely cited factors in IMS decisions and is vital to the unsystematic approach (He et al, 2016). Although, cultural distance does not incorporate the entirety of cultural and psychic distance, as it neglects language, religion and political system and does not give an insight into market potential (Dow, 2000). He et al (2016) suggests this is an area for further research and this work project will incorporate Ghemawat’s CAGE framework to account for this issue.
Ghemawat’s CAGE framework highlights the Cultural, Administrative, Geographic and Economic distance between countries. By highlighting the impact of distance, it is easier to
realize promising global investment opportunities and to highlight the difficulties an organization will face going into that market (Ghemawat, 2001). The cultural aspect determines how interactions occur between the organizations and the people, and any issues there are communicating due to cultural reasons. The administrative/political aspects can greatly impact trade between countries due to discrepancies in administration or political factors and the geographic aspect can determine how hard it is to do business, as generally the further you are the harder it is to conduct business. Finally, the economic attribute, can be considered one of the most important, as it has a profound effect on levels of trade and the types of partners a country trades with.
Methodology!
The research methodology combines both qualitative and quantitative research. The qualitative research involved interviewing two individuals within the company, the Director of Operations and a high up anonymous source. Interviewing both individuals allowed for a deeper insight into how the organization functions, as well as key information necessary for this project. The type of interview that was selected was a semi-structured face-to-face interview, as it allows for the following of topical trajectories, whilst allowing the interviewee to go into detail when needed (Clifford et al, 2016). Being face-to-face also allows for a rapport to be built, through visual and non-verbal cues (O’Connor et al, 2008). Developing a relationship with the interviewee, made the interviews more fruitful and further queries were answered throughout the construction of this thesis.
Criteria Selection
The macro indicators selected for the first ranking and cluster analysis were based of Cavusgil’s (1997, 2004) past research. To ensure that emerging economies were not neglected in the ranking and cluster analysis, indicators such as cultural distance and long term market potential
were included at the recommendation of Sakarya (2007). When conducting the second ranking analysis, more specific industry indicators were added after discussing these with AWU.
Clustering Technique
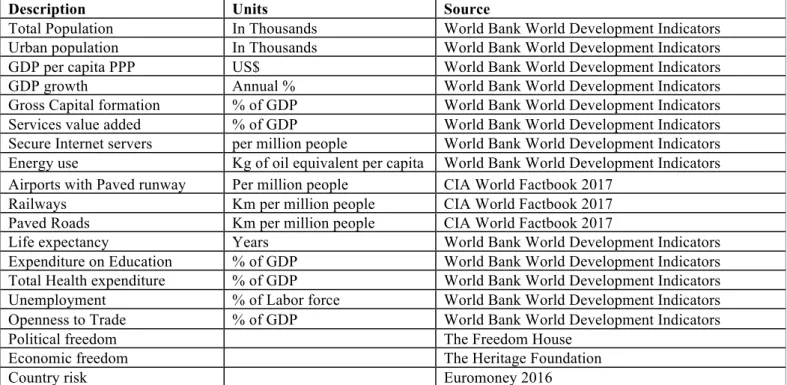
The clustering technique analyses countries based on structural similarities, as grouping countries based on similar aspects can provide significant insights. The variables that were selected for the cluster analysis can be seen in Table 1. Having a large set of data, principle components analysis (PCA) was utilized to reduce the dimensionality of the data, whilst still retaining as much of the variation as possible (Jolliffe, 2002). As the variables were not highly correlated, an orthogonal rotation was selected, and Varimax rotation was used. After reducing the dimensionality of the data, a cluster analysis was run using SPSS. As this was a large group of data, a K- means clustering would be the most effective. Although, an issue with this method is that the number of clusters must be defined in advance and this is difficult to predict with a large data set. To overcome this obstacle, a hierarchical clustering was used first as it can form clusters ranging from 1- n without prior knowledge of the numbers.
Description Units Source
Total Population In Thousands World Bank World Development Indicators Urban population In Thousands World Bank World Development Indicators GDP per capita PPP US$ World Bank World Development Indicators GDP growth Annual % World Bank World Development Indicators Gross Capital formation % of GDP World Bank World Development Indicators Services value added % of GDP World Bank World Development Indicators Secure Internet servers per million people World Bank World Development Indicators Energy use Kg of oil equivalent per capita World Bank World Development Indicators Airports with Paved runway Per million people CIA World Factbook 2017
Railways Km per million people CIA World Factbook 2017 Paved Roads Km per million people CIA World Factbook 2017
Life expectancy Years World Bank World Development Indicators Expenditure on Education % of GDP World Bank World Development Indicators Total Health expenditure % of GDP World Bank World Development Indicators Unemployment % of Labor force World Bank World Development Indicators Openness to Trade % of GDP World Bank World Development Indicators
Political freedom The Freedom House
Economic freedom The Heritage Foundation
Country risk Euromoney 2016
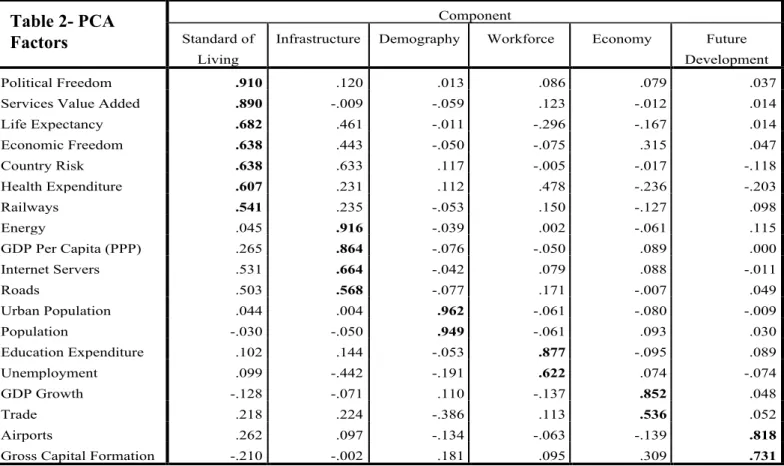
The six factors that emerged from PCA can be seen in Table 2 and these factors explain 75.6% of the variance. The first factor incorporates variables attributed to freedom and standard of
living. The second factor highlights variables that are mainly focused on infrastructure. The third factor solely focuses on population and urban population, so this group has been named demographics. The fourth factor covers expenditure on education and unemployment, this group was aptly named workforce. The fifth factor refers to the economy as it looks at GDP growth and amount of trade, which are determinants of economic prosperity. The final factor looks at Gross capital formation and numbers of airports; this group has been named future development as gross capital formation is investments in future infrastructure as well as number of airports per million being a determinant of the wealth of a country.
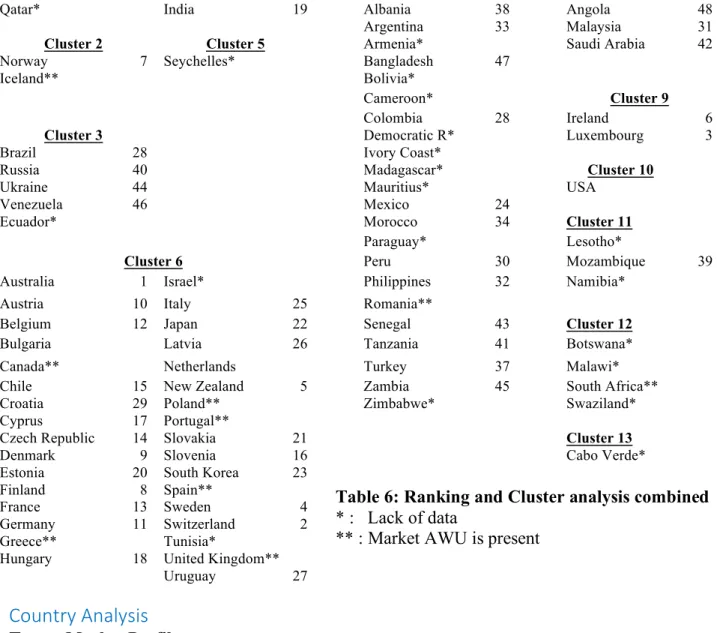
The cluster analysis incorporated 80 countries, including the USA and the Netherlands; this can be seen in table 6. Although 80 countries were analysed, 32 of those countries could not
!
Component Standard of
Living
Infrastructure Demography Workforce Economy Future Development Political Freedom .910 .120 .013 .086 .079 .037 Services Value Added .890 -.009 -.059 .123 -.012 .014 Life Expectancy .682 .461 -.011 -.296 -.167 .014 Economic Freedom .638 .443 -.050 -.075 .315 .047 Country Risk .638 .633 .117 -.005 -.017 -.118 Health Expenditure .607 .231 .112 .478 -.236 -.203 Railways .541 .235 -.053 .150 -.127 .098 Energy .045 .916 -.039 .002 -.061 .115 GDP Per Capita (PPP) .265 .864 -.076 -.050 .089 .000 Internet Servers .531 .664 -.042 .079 .088 -.011 Roads .503 .568 -.077 .171 -.007 .049 Urban Population .044 .004 .962 -.061 -.080 -.009 Population -.030 -.050 .949 -.061 .093 .030 Education Expenditure .102 .144 -.053 .877 -.095 .089 Unemployment .099 -.442 -.191 .622 .074 -.074 GDP Growth -.128 -.071 .110 -.137 .852 .048 Trade .218 .224 -.386 .113 .536 .052 Airports .262 .097 -.134 -.063 -.139 .818
Gross Capital Formation -.210 -.002 .181 .095 .309 .731
Table 2- PCA Factors
be ranked either due to lack of cultural data or because AWU was already present in those markets. The countries that were removed from the ranking analysis were still incorporated in the cluster analysis as this allowed for the significance of the principle component analysis to be higher, as with too few countries and 19 different variables the Kaiser-Meyer value would be too low and the data not sufficient for analysis.
Ranking Analysis
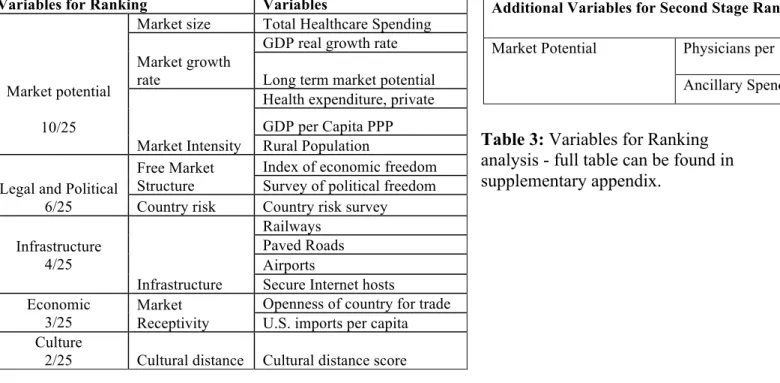
Interested in finding the most attractive market for AWU to move into, a ranking analysis will be utilized to list countries in terms of market potential. To conduct a ranking analysis, the indicators selected will not be as extensive, as the cluster analysis was looking for similarities between countries, whereas what is most relevant here is the market potential indicators (Table 3). To weight the cases appropriately, Robertson’s and Woods (2001) findings on the relevant importance of information for manager’s foreign market selection process was used. Robertson and Wood (2001) highlighted what information was most relevant for managers when choosing an export market. These weightings were also discussed with AWU during the process of the thesis and they agreed on the importance given to each variable.
Prior to any ranking analysis, alike the cluster analysis, the data was completely standardized to avoid any issues caused by different scales in the data. Also as the number of countries was high, it was decided that a two-step ranking analysis would take place, whereby the first ranking analysis would look at more general market potential factors and the second ranking analysis would incorporate more market specific indicators. After the standardized data was compared all values were put into a scale of 1-100 using the normalizing formula (Formula 3) and weighted accordingly. Then an overall score was calculated and countries ranked from 1-48 based on market potential.
= 9 + :;<=> − ?@A × 9CC − 9 (DEF − D@A)
Max = Maximum value for variable Min = Minimum value for variable Score = Score for variable
Table 3: Variables for Ranking analysis - full table can be found in supplementary appendix.
Analysis!and!Results!
Company Analysis
AWU has existed since the 1960s, but throughout the years it has changed ownership and its name, with the most recent change being in January, 2001.
The company manufactures and supplies medical diagnostic instruments and reagents, as well as separation technologies vital for the production of flu vaccines. The company’s products are used worldwide in physician office labs, veterinary laboratories and clinical laboratories. AWU is a subsidiary of a large Italian pharmaceutical corporation, but has full autonomy in how it conducts its business and sells its product. It is the only subsidiary that sells this product along with its partner in the Netherlands.
Product Profile
AWU primarily sells clinical chemistry blood analysers, to both the physician office lab (POL) market and the veterinary (VET) market. AWU also sells Ultracentrifuges, which are used in the production of flu vaccines. The product the company would wish to internationalize is their clinical blood analyser (The ACE AX). After discussing with AWU, it was decided that the ACE AX would be the ideal product to internationalize further, as the VET AX is a more recent product line and they’re still adding features. The product is sold on the basis of a razor blade model, and the company has had a history of giving the analyser out very cheaply, so as to sell
Variables for Ranking Variables
Market potential 10/25
Market size Total Healthcare Spending Market growth
rate
GDP real growth rate Long term market potential
Market Intensity
Health expenditure, private GDP per Capita PPP Rural Population Legal and Political
6/25
Free Market Structure
Index of economic freedom Survey of political freedom Country risk Country risk survey
Infrastructure 4/25 Infrastructure Railways Paved Roads Airports
Secure Internet hosts Economic
3/25
Market Receptivity
Openness of country for trade U.S. imports per capita Culture
2/25 Cultural distance Cultural distance score
Additional Variables for Second Stage Ranking
Market Potential Physicians per 1000 Ancillary Spending
the reagents. This factor makes this product ideal to internationalize, as this would allow AWU to enter any market ranging from emerging to established markets.
International Panorama
AWU is currently exporting its products to 33 countries worldwide through distributors and with the assistance of their partner in the Netherlands. When going abroad, AWU generally relies on selling to distributors and the distributor is free to distribute the product at their price. Although, AWU keeps detailed track of what the distributor is selling and ensures that the reagents are compatible with the machinery sold. AWU also performs a pricing analysis for all foreign distributors, so that they know what price is needed to be able to sell the product in the local market. This method of international expansion is generally associated with low risk and low control, however through their extra efforts, AWU have more control over their distributors than other companies.
During the construction of this thesis AWU has been contacted by distributors in Botswana, Pakistan and some nations in the SADC-region regarding their product but have not agreed any deal as of yet. They currently export the most to the UAE and Curacao.
SWOT Analysis
Strengths- AWU’s strength lies in their service excellence, they provide both excellent technical (phone and online) and field services. AWU has consecutively won the Northface Scoreboard award for service excellence for the past 12 years. Another one of AWU’s strength lies in their product, as they have a reliable, easy to use and good analyser, albeit not technically advanced. The company also benefits from being small, having short lines so they can act quickly to customer needs. AWUs branding is also a strength, as having the brand name of a successful global pharmaceutical firm means it is recognised abroad and linked to this successful firm.
Weaknesses- A key weakness for AWU is the fact that they’re a high priced product, as with the product pricing comes excellent service. This is only a weakness due to increasing competition that is coming into the industry. AWU also struggles with needing to modernize their product offering, with constantly innovating products in the medical technology area they need to keep innovating. Another key weakness that should be highlighted is the fact that AWU’s leadership team are slow in making decisions on their next strategic move and this makes the company less reactive to external changes.
Opportunities- Even though AWU are seeing their home market change rapidly, they are seeing new opportunities internationally and are planning to expand further, so they are not too reliant on one market. Also, with more focus on central labs that do not require AWUs products, a large rural population and rural physician office labs in the US gives opportunities for a niche market that is not really focused on by other companies in the industry as of yet.
Threats- In respect to AWU’s threats, it is important to consider the implication of Obamacare, the move to Universal healthcare, has had on the company. As AWU primarily sells to physician office labs, the move to universal healthcare has seen a rise in the use of centralised labs, due to demands by insurance companies to cut costs. This is a threat as the majority of their market is POLs and they don’t sell many analysers or reagents to centralised labs. This means that their market share in the US will not grow any further and as their selling model is the razor blade, they will be struggling to sell any reagents to bring in any necessary cash-flow. Another threat that has been recognised is that there are many competitors in the clinical blood analyser market, selling similar products. This is a threat as companies must then try to outperform each other to grab a larger market share, as prospects for profit and growth are diminished due to price wars (Kim and Maugborne, 2015).
Market Legal and Political Infrastructure Economic Culture Overall Market Size Market Growth Market Intensity Legal and Political Infrastructure Market Receptivity Culture Overall
Index Rank Index Rank Index Rank Index Rank Index Rank Index Rank Index Rank Index Rank
Australia 73 12 30 28 45 6 98 3 100 1 16 30 100 1 100 1 Switzerland 97 2 27 41 63 2 100 1 69 6 30 14 59 5 99 2 Luxembourg 46 29 37 10 51 3 95 5 52 15 100 1 58 6 94 3 Sweden 100 1 35 13 31 23 92 7 95 2 13 35 47 14 92 4 New Zealand 90 6 33 20 31 19 98 2 70 5 17 27 86 2 92 5 Ireland 55 20 44 4 44 7 81 14 61 8 59 3 84 3 88 6 Norway 76 10 29 34 33 18 93 6 85 3 11 37 54 8 84 7 Finland 76 11 26 44 33 17 92 8 82 4 10 40 63 4 83 8 Denmark 88 7 28 37 28 26 95 4 59 9 16 28 56 7 80 9 Austria 92 5 27 42 39 12 87 11 57 11 17 24 51 11 79 10 Germany 93 4 29 32 41 10 90 9 49 16 16 29 46 16 79 11 Belgium 85 8 28 35 35 16 81 15 37 22 51 4 37 21 74 12 France 96 3 28 36 36 14 74 19 49 17 11 39 46 15 70 13 Czech Republic 51 21 35 12 14 41 84 13 55 14 31 12 42 18 66 14 Chile 55 18 30 29 42 9 87 10 22 28 43 6 30 28 65 15 Slovenia 70 14 32 23 31 20 70 21 55 13 27 15 22 39 64 16 Cyprus 50 23 29 33 48 4 80 16 40 19 17 26 33 25 62 17 Hungary 51 22 32 22 27 27 61 25 56 12 34 11 49 12 61 18 India 21 42 100 1 100 1 50 32 4 44 7 43 42 19 61 19 Estonia 40 30 27 38 14 40 79 17 63 7 30 13 29 29 60 20 Slovakia 58 17 34 17 25 29 74 20 41 18 36 8 17 44 59 21 Japan 82 9 27 43 24 32 84 12 28 26 11 38 20 41 59 22 South Korea 50 23 32 25 43 8 76 18 31 24 24 17 1 48 54 23 Mexico 39 31 35 14 31 21 54 31 9 38 99 2 31 26 54 24 Italy 71 13 27 40 31 22 67 22 25 27 8 42 53 10 54 25 Latvia 34 34 29 30 22 34 65 24 59 10 21 20 27 33 51 26 Uruguay 64 15 27 39 24 31 66 23 22 30 20 21 34 23 49 27 Brazil 61 16 21 45 48 5 55 30 12 34 22 18 45 17 47 28 Colombia 49 25 34 16 13 42 59 26 13 33 46 5 27 31 44 29 Croatia 55 18 29 31 12 45 56 28 38 20 14 33 28 30 43 30 Peru 30 36 34 15 16 39 58 27 7 39 35 9 26 35 35 31 Malaysia 16 46 38 8 20 36 55 29 11 36 35 10 27 32 34 32 Philippines 21 42 44 5 29 25 50 33 3 46 21 19 34 24 33 33 Argentina 22 41 32 24 20 37 31 41 29 25 18 22 53 9 29 34 Morocco 34 32 37 9 35 15 36 38 5 43 15 32 30 27 29 35
Table 4: First Ranking Analysis
Table 5: Second Ranking Analysis
Cabo Verde 23 40 31 27 1 48 43 36 37 21 12 36 25 37 27 36 Turkey 29 37 37 11 10 46 45 35 13 32 8 41 39 20 27 37 Albania 34 32 31 26 25 30 47 34 12 35 6 44 10 45 27 38 Mozambique 46 28 42 6 22 35 28 43 6 41 16 31 26 34 26 39 Russia 48 26 18 46 40 11 20 46 32 23 5 46 4 46 23 40 Tanzania 31 35 46 3 24 33 33 39 3 47 2 47 36 22 23 41 Saudi Arabia 21 42 33 21 26 28 30 42 9 37 25 16 25 36 23 42 Senegal 21 42 42 7 12 44 38 37 3 45 14 34 19 43 20 43 Ukraine 48 26 1 48 30 24 26 44 22 29 18 23 4 47 19 44 Zambia 25 39 34 18 13 43 32 40 7 40 6 45 47 13 19 45 Venezuela 28 38 11 47 38 13 1 48 13 31 36 7 20 42 12 46 Bangladesh 1 48 48 2 18 38 22 45 1 48 1 48 22 40 8 47 Angola 6 47 34 19 2 47 7 47 6 42 17 25 22 38 1 48
Market Legal and Political Infrastructure Economic Culture Overall
Market Size Market Growth Market Intensity Legal and Political Infrastructure Market Receptivity Culture Overall
Index Rank Index Rank Index Rank Index Rank Index Rank Index Rank Index Rank Index Rank
Australia 59 5 24 5 49 3 87 3 100 1 8 7 100 1 100 1 Switzerland 61 4 5 8 100 1 100 1 36 6 24 3 24 5 83 2 Luxembourg 37 8 60 2 65 2 71 5 1 10 100 1 21 6 72 3 New Zealand 47 7 40 4 11 8 89 2 38 5 8 5 75 2 59 4 Norway 100 1 15 6 15 7 64 6 70 3 3 9 15 8 53 5 Sweden 65 3 49 3 10 9 57 7 90 2 5 8 1 10 52 6 Ireland 1 10 100 1 47 4 1 10 20 7 55 2 70 3 27 7 Finland 25 9 1 10 17 6 55 8 64 4 1 10 32 4 18 8 Denmark 57 6 10 7 1 10 71 4 17 8 8 6 18 7 16 9 Austria 71 2 5 9 31 5 30 9 12 9 10 4 9 9 1 10
Country(Analysis
(Target Market Profiles
AWU was keen on internationalizing into either South America, Europe, Africa or Oceania. Although, they mentioned that if the right market was found in the Middle East and Asia, they would be willing to explore that prospect. AWU was not interested in the whole of Asia, but the regions of interest were South and East Asia. It is key to note that China was not a country of interest, due to the lack of intellectual property rights. Knowing this information, 80 countries were selected from the regions specified by AWU.
From the ranking analysis, it was found that the countries that ranked highest were the more developed nations, generally found in Europe and Oceania, and the lesser developed countries ultimately scored lower. Emerging economies did manage to score above some developed nations, but were unable to get into the second ranking stage. From the first and second ranking
Cluster 1 Cluster 4 Cluster 7 Cluster 8
Qatar* India 19 Albania 38 Angola 48
Argentina 33 Malaysia 31
Cluster 2 Cluster 5 Armenia* Saudi Arabia 42
Norway 7 Seychelles* Bangladesh 47
Iceland** Bolivia*
Cameroon* Cluster 9
Colombia 28 Ireland 6
Cluster 3 Democratic R* Luxembourg 3
Brazil 28 Ivory Coast*
Russia 40 Madagascar* Cluster 10
Ukraine 44 Mauritius* USA
Venezuela 46 Mexico 24
Ecuador* Morocco 34 Cluster 11
Paraguay* Lesotho*
Cluster 6 Peru 30 Mozambique 39
Australia 1 Israel* Philippines 32 Namibia*
Austria 10 Italy 25 Romania**
Belgium 12 Japan 22 Senegal 43 Cluster 12
Bulgaria Latvia 26 Tanzania 41 Botswana*
Canada** Netherlands Turkey 37 Malawi*
Chile 15 New Zealand 5 Zambia 45 South Africa**
Croatia 29 Poland** Zimbabwe* Swaziland*
Cyprus 17 Portugal**
Czech Republic 14 Slovakia 21 Cluster 13
Denmark 9 Slovenia 16 Cabo Verde*
Estonia 20 South Korea 23
Finland 8 Spain**
France 13 Sweden 4
Germany 11 Switzerland 2
Greece** Tunisia*
Hungary 18 United Kingdom**
Uruguay 27
Table 6: Ranking and Cluster analysis combined * : Lack of data
** : Market AWU is present
stage the two top scoring countries did not change, but there was a change in the table with countries such as New Zealand, Ireland, Sweden and Norway all shifting positions.
Focusing on the clusters with potential markets, it is evident that Cluster 6 and 9 are both composed of generally developed nations. Both clusters have high standards of living and good infrastructure and these clusters are only differentiated due to Cluster 9 scoring highly for the economy factor. Cluster 2 is also composed of developed nations, but what sets this cluster apart is its high level of infrastructure and average scores in the other factors.
Cluster 3 and 7, generally includes the emerging economies and some less developed nations. Cluster 3 is characterized by countries with stagnating economies and countries that are less open to trade, whereas Cluster 7 had relatively low levels of expenditure on education and higher levels of unemployment. Cluster 4 also an emerging economy cluster, differentiates itself from the other clusters due to its high score in demography and high economic growth. Cluster 8 includes 4 countries and these countries score poorly for standard of living, although score well for infrastructure. Cluster 11, is solely composed of less developed countries and are explained by economies with high unemployment and relatively average spending on education (Full cluster breakdown in appendix 7 and 8).
The two countries that ranked highest in the ranking analysis were Australia (1) and Switzerland (2). These two countries will be analyzed in further detail to get a more in depth analysis necessary for IMS. Both countries were found to be ranked in the Top Ten USA Trade Administration ranking for market potential for US companies in the medical devices industries, with Australia 10th and Switzerland ranked 6th (Zapian, 2016). This information just supports the findings from the ranking and cluster analysis. Prior to analyzing these two markets in more detail, a CAGE analysis will be performed (appendix1).
Market Potential
and is the fifth largest contributor to Australia’s GDP (Bartlett, Butler, & Rogan, 2016). Its public–private partnership is ranked top three in the world and this is something that can be perceived as beneficial to AWU, as they primarily sell to private entities.
Approximately 80% of medical device and diagnostic equipment used is imported into the country and in Australia, U.S. medical equipment is perceived as high quality and is used throughout the industry (ITA, 2016). Australians who currently benefit from this excellent healthcare system are expected to live longer and in the future this will lead to a larger demand on the healthcare system. This could increase the demand for diagnostic equipment in the future, as earlier diagnosis is related to a higher potential of curing and is ultimately cheaper (Bartlett, Butler, & Rogan, 2016).
Switzerland- Switzerland has a favorable geographical position in the heart of Europe, with high per capita income and one of the best healthcare systems in the world. Switzerland is a small market relative to other nations, but is highly sophisticated and demands the most advanced technologies (US Commercial Service, 2014).
The Swiss healthcare system is universal, although it is based on private health insurance and is a compulsory requirement for anyone residing in Switzerland. The country is split up into 26 cantons and healthcare is provided by cantons through a host of hospitals, private clinics and medical homes (Canadian Embassy, 2001). The structure of the healthcare system is also favorable for AWU, as it is based on private healthcare, but as with the US, the insurance companies tend to try and lower costs associated with ancillary services and utilize central labs. The US medical equipment industry in particular enjoys a positive relationship with the Swiss, as many Swiss doctors and professionals have been trained in the US and accustomed to American machinery. The country and the medical device market is open to imports for a host of products and technologies coming from the US (US Commercial Service, 2014).
Switzerland currently spends the most in Europe on healthcare and alike Australia, Switzerland is dealing with an aging population, rising living standards and new forms of treatments coming in that has increased demand to grow faster than usual. Although unlike Australia, Switzerland is moving toward a new trend of reducing spending and they have already began reducing the number of hospital beds and closing hospitals (US Commercial Service, 2014).
Competitive Analysis
Australia-The key suppliers of Medical devices to Australia originate from the USA, Europe and Japan. Usually the suppliers are subsidiaries of foreign corporations or these companies are represented through local distributors. The major US companies supplying medical diagnostic equipment in Australia are Abbots, Johnson and Johnson, Becton Dickinson and Medtronic. Although, in this market they’re also dealing with the large players from Europe such as Siemens, who acquired Bayers Medical Diagnostic department in 2006 and Swiss company Roche. Finalizing the competitors in this market are Fujifilm founded in Japan (Zapian, 2016b).
Switzerland – Similar to Australia, Switzerland also has the same companies exporting their diagnostic equipment to them, except for Medtronic. Even though that’s one less foreign competitor importing medical diagnostic equipment, Switzerland does have a lot of medical diagnostic manufacturers based there, such as Roche. The Swiss medical device market is highly sophisticated and there are opportunities for highly advanced technologies and devices, with the diagnostic area having the best potential. Switzerland currently imports 84% of their medical devices from abroad, which is more than Australia (BMI, 2015).
Country Entry Condition
Australia- Australia is a member of the Pacific Island Forum and the Pacific Community. Australia is also a member of MIKTA, WTO, UN, OECD and NATO. Currently, Australia has free trade agreements (FTA) with New Zealand and the ASEAN countries, Chile, Malaysia, Singapore, Thailand and most importantly the US. FTAs are being negotiated currently with
China, India, the gulf cooperation, Japan, Indonesia as well as an agreement has been made with South Korea, however this is not being enforced at the moment. On average it takes 8 days to import goods into Australia and this is better than the other OECD high income countries (10 days). Australia scores highly in the logistics performance index (LPI), ranked 19th in the world, this score is determined by six indicators and is based on how easy it is to export to that country (LPI, 2016). Australia also scores highly for the ease of doing business index, coming 15th in the world (WorldBank, 2016).
Switzerland- Switzerland is a founding state and currently an active member of EFTA, and has a FTA agreed with the European Union (EU) (Mitchell, 2005). Switzerland presently has a network of 28 FTAs with 38 partners outside of the EU and is negotiating more deals constantly (Narcisi, 2016). Most deals are done within the context of EFTA, although Switzerland can negotiate their own FTAs without the involvement of EFTA (Narcisi, 2016). Alike Australia, Switzerland is also a member of the OECD and WTO and also scores highly in the LPI index and is ranked 11th in the world. Switzerland unfortunately does not meet expectations in regard to ease of doing business index, only ranking 31st (WorldBank, 2016).
What market next? Based on the findings, the country that AWU should enter is Australia, it is however acknowledged that Switzerland would be geographically more viable, with its location in the heart of Europe. Australia was chosen for several reasons, firstly, it is a country that in the future will strive for increasing ancillary spending, including spending on diagnostics. While, Switzerland have begun to cut their spending on healthcare, and this does not bode well for future market share. Secondly, it was also acknowledged that with AWUs weakness of not having the most innovative product, they may hit a stumbling block in Switzerland, as the Swiss medical device market demands the most innovative and advanced technologies. Whereas, Australia may be more welcoming to a product which may not be innovative but is reliable and easy to use.
Additionally, Australia has the more favourable healthcare system for AWU to succeed, the public-private partnership is beneficial as AWUs primary buyers are private entities and even though it is not the main healthcare spending in Australia it is still present. Alternatively, Switzerland’s model is unfavourable for AWU as the company would be encountering the same issue that they are currently facing in the US, with the insurance favouring the use of centralised labs for diagnostics. This is particularly troublesome, as insurance companies are private, so cutting costs by using centralized labs is common place in the industry.
Based on the sheer number of large competitors AWU will face in each nation, Switzerland actually has less major foreign competitors from the US. Although, Switzerland has more manufacturers of diagnostic equipment based in the nation as well as Roche, and this would make it more difficult for AWU to get a foothold in the market compared to in Australia. From the CAGE framework, it is also clear to see that the psychic distance is larger between the US and Switzerland, compared to Australia and the US. This favours the Australian market, as one of the major factors that contributes to increasing trade between countries is minimal psychic and cultural distance (Ghemawat, 2001). As Ghemawat (2001) states, two of the largest contributors to increasing trade are having a common language and colonizer, and Australia benefits from these commonalities.
Overall, it was acknowledged that both markets offered great potential for AWU, however, when comparing these nations more in depth, it is clear that Australia is the country that AWU should enter next.
Future Expansion- In regard to future expansion it was decided that countries in Cluster 6 offered the best options, this cluster scored highly in the ranking analysis, thusly showing high market potential and were most similar to other markets entered in the past. Also found in Cluster 6, was AWUs partner in the Netherlands, as AWU has been successful in the
Netherlands, this therefore highlights more validity for this finding and supports the claim that these should be the countries they enter next.
It is also important to acknowledge Cluster 9, even though not clustered with the other nations they have entered, both Ireland and Luxembourg scored highly in the ranking analysis and their cluster has similar characteristics to Cluster 6, but with the additional benefit of scoring high in the economic factor. This cluster could actually have a more promising future than Cluster 6 in terms of market potential and in the future they must be looked at more in depth by AWU.
Conclusion(
Throughout this piece of research, it was set out to find AWU’s next potential foreign market, so that they can grow their international presence. Utilizing IMS techniques this paper found that the best market for AWU to enter next was Australia. Comparing the two top countries with the competencies available at AWU, it was evident that Australia was the most viable market to enter. It was also found that both Cluster 6 and 9 offered the best future expansion option for AWU, not only because of their similar characteristics but because those clusters composed of the countries that offer the most market potential. During the conclusion of writing this thesis, I was informed that AWU was contacted by a distributor in Australia and are considering this move, so this makes the decision even more obtainable.
Further Research- Due to length and time constraints, this thesis could not conduct an in-depth analysis of all the countries used in the research. Based on the analysis, there is a suggestion that more research must be undertaken in this area and in particular an in-depth analysis of the other countries in the thesis should be examined. This is important as other countries may have offered more market potential than Australia, but did not rank high enough to be considered for the in-depth analysis. Conducting an in-depth analysis allowed for a more insightful outlook of the market potential and this should be pursued by AWU in the future before deciding to move into a market.
References(
Andersen, O. & Buvik, A. (2002). Firms’ internationalization and alternative approaches to the international customer/market selection.
International Business Review, 11(3), 347-363.
Avik, R. (2011). Why Switzerland Has the World's Best Health Care System. Forbes.com. Retrieved 17 November 2016, from
http://www.forbes.com/sites/theapothecary/2011/04/29/why-switzerland-has-the-worlds-best-health-care-system/#257f72b718af Bartlett, C., Butler, S., & Rogan, C. (2016). Australia's healthcare system: An opportunity for economic growth. Strategyand.pwc.com.
Retrieved 16 November 2016, from http://www.strategyand.pwc.com/reports/australias-healthcare-system BMI,. (2015). Switzerland Medical Devices Report Q2 2015, Business Monitor International. Retrieved 18 November 2016, from
https://www.reportbuyer.com/product/2722457/switzerland-medical-devices-report-q2-2015-business-monitor-international.html
Brewer, P. (2001). International market selection: developing a model from Australian case studies. International Business Review,10(2), 155-174.
Canadian Embassy, (2001). Medical devices market Switzerland. Canada-ambassade.ch. Retrieved 17 November 2016, from http://www.canada-ambassade.ch/medical.htm
CIA,. (2016). The World Factbook — Central Intelligence Agency. Cia.gov. Retrieved 19 November 2016, from https://www.cia.gov/library/publications/the-world-factbook/
Cavusgil, S. (1997). Measuring the potential of emerging markets: An indexing approach. Business Horizons, 40(1), 87-91.
Cavusgil, S., Kiyak, T., & Yeniyurt, S. (2004). Complementary approaches to preliminary foreign market opportunity assessment: country clustering and country ranking. Industrial Marketing Management, 33(7), 607-617.
Clifford, N., Cope, M., Gillepsie, T., & French, S. (2016). Key methods in geography (3rd ed.). London: SAGE. Czinkota, M. (2016). Export development strategies: US promotion policies (1st ed.). New York: Praeger.
Dow, D. (2000). A Note on Psychological Distance and Export Market Selection. Journal Of International Marketing, 8(1), 51-64. Freedom House. (2016). Freedomhouse.org. Retrieved 14 November 2016, from https://freedomhouse.org/
Ghemawat, P. (2001). Distance Still Matters: The Hard Reality of Global Expansion. Harvard Business Review, 1-12. Heritage Foundation. (2016). The Heritage Foundation. Retrieved 30 November 2016, from http://www.heritage.org/
He, X., Lin, Z., & Wei, Y. (2016). International market selection and export performance: a transaction cost analysis. European Journal Of Marketing, 50(5/6), 916-941.
Hofstede, G. (2001). Culture's consequences. Thousand Oaks, Calif.: Sage Publications.
Ismail, N. & Mahyideen, J. (2015). The Impact of Infrastructure on Trade and Economic Growth in Selected Economies in Asia (1st ed.). Tokyo: Asian Development Bank Institute. Retrieved from https://www.adb.org/sites/default/files/publication/177093/adbi-wp553.pdf
ITA,. (2016). 2016 Top Markets Report Medical Devices- Australia (1st ed.). International Trade Administration. Retrieved from
http://trade.gov/topmarkets/pdf/Medical_Devices_Australia.pdf
Jansson, H. & Sandberg, S. (2008). Internationalization of small and medium sized enterprises in the Baltic Sea Region. Journal Of International Management, 14(1), 65-77.
Johanson, J. and Vahlne, J.E. (1990), “The mechanism of internationalisation”, International Marketing Review, Vol. 7, pp. 11-24. Kim, W. & Mauborgne, R. (2005). Blue ocean strategy (1st ed.). Boston, Mass.: Harvard Business School Press.
Kogut, B. & Singh, H. (1988). The Effect of National Culture on the Choice of Entry Mode. Journal of International Business Studies, 19(3), 411-432.
Kumar, V., Stam, A. and Joachimsthaler, E.A. (1994), “An interactive multi-criteria approach to identifying foreign markets”, Journal of International Marketing, Vol. 21, pp. 29-52.
Au
st
ra
lia
Cultural Administrative Geographic Economic
Languages: English Religion: Christianity
Trade Bloc: PIF
Currency: Australian Dollar Colonizer: United Kingdom Corruption: 79
Legal Origin: Common Law
Distance between: 15974 km Land Area: 7,692,000 km² Time Zone: +16 hours Climate Zone: Temperate Access to Sea: Pacific Ocean
GDP per capita: 67,458.36 US $ Real GDP growth rate: 2.5% Human development Index: rank 2nd Internet Penetration: 85.1% US A Languages: English Religion: Christianity
Trade Bloc: NAFTA Currency: US Dollar Colonizer: United Kingdom Corruption: 76
Legal Origin: Common Law
Land Area: 7,663,940.6 km² Time Zone: 0 hours
Climate Zone: Temperate (New Jersey)
Access to Sea: Pacific and Atlantic Ocean
GDP per capita: 53,041.98 US $ Real GDP growth rate: 2.2% HDI: rank 8th Internet Penetration: 88.5% Sw it ze rl and Language: German/French/Italian Religion: Christianity Trade Bloc: EU Currency: Swiss Franc Colonizer: N/A Corruption: 86
Legal origin: Civil Law
Distance between: 6297km Land Area: 41,285 km²
Time Zone: +6 hours Climate Zone: Temperate Access to Sea: N/A
GDP per capita:
!
84,815.41US $ Real GDP growth rate: 1.9% HDI: rank 3rdInternet Penetration: 87.2% LPI,. (2016). Logistics Performance Index. Lpi.worldbank.org. Retrieved 21 November 2016, from http://lpi.worldbank.org/
Jolliffe, I. (2002). Principal component analysis (2nd ed.). New York: Springer.
Melin, L. (1992). Internationalization as a strategy process. Strategic Management Journal, 13(S2), 99-118. http://dx.doi.org/10.1002/smj.4250130908
Mitchell, R. (2005). Global Trade Negotiations. Cid.harvard.edu. Retrieved 12 November 2016, from http://www.cid.harvard.edu/cidtrade/gov/switzerlandgov.html
Narcisi, G. (2016). Free Trade Agreements: Switzerland Global Enterprise. S-ge.com. Retrieved 14 November 2016, from http://www.s-ge.com/switzerland/export/en/content/static/Free-Trade-Agreements
O'Connor, H. (2008). Internet-based Interviewing. In N. Fielding, R. Lee & G. Black, The SAGE Handbook of Online Research Methods (1st ed.). Oxford: SAGE.
Robertson, K. & Wood, V. (2001). The relative importance of types of information in the foreign market selection process. International Business Review, 10(3), 363-379.
Papadopoulos, N., Chen, H., & Thomas, D. (2002). Toward a tradeoff model for international market selection. International Business Review, 11(2), 165-192.
Sakarya, S., Eckman, M., & Hyllegard, K. (2007). Market selection for international expansion. International Marketing Review, 24(2), 208-238.
US Commercial Service, (2014). Doing Business in Switzerland- 2014 Country Commercial Guide for U.S. Companies (1st ed.). U.S. and Foreign Commercial Service. Retrieved from http://www.iberglobal.com/files/suiza_ccg.pdf
World Bank. (2016). World Bank Group. Retrieved 7 November 2016, from http://www.worldbank.org/
Wright, M., Westhead, P., & Ucbasaran, D. (2007). Internationalization of Small and Medium-sized Enterprises (SMEs) and International Entrepreneurship: A Critique and Policy Implications. Regional Studies, 41(7), 1013-1030.
Zapian, G. (2016). 2016 Top Markets Report - Medical Devices (1st ed.). International Trade Administration.
Zapian, G. (2016b). 2016 Top Markets Report Medical Devices- Australia (1st ed.). International Trade Administration.