“Business and Management–2012” May 10-11, 2012, Vilnius, LITHUANIA
“Business and Management–2012” Selected papers. Vilnius, 2012, pp. XX–XX © Vilnius Gediminas Technical University, 2012
ATTITUDES AND PERCEPTIONS REGARDING ENTREPRENEURSHIP AROUND THE WORLD: A CLUSTER ANALYSIS APPROACH
Alcina Nunes1, Carlos Balsa2
1 Polytechnic Institute of Bragança, Campus de Sta Apolónia, Apartado 1134, 5301-857, Bragança, Portugal
Email: [email protected]
2Polytechnic Institute of Bragança, Campus de Sta Apolónia, Apartado 1134, 5301-857, Bragança, Portugal
Email: [email protected]
Abstract. Nowadays it is believed that entrepreneurship could be a driving force in growth and develop-ment. For the achievement of a relevant national entrepreneurship rate the social and economic business environment can be crucial. However, despite the international attention given to entrepreneurship, it is not known if it is a global phenomenon or if there are particular regions where the entrepreneurial activity is specially recognized by society. Applying cluster analysis statistical techniques to a dataset gathered by the Global Entrepreneurship Monitor (GEM) and that includes, in 2010, 59 countries this paper intends to identify groups of countries with the same population attitude and perception regarding entrepreneurship.
Keywords: entrepreneurship, business environment, attitudes, perceptions, cluster analysis, GEM.
Jel classification: L26, C38.
1. Introduction
Entrepreneurship is a multidimensional concept that does not generate a consensual definition. An important distinction is made between an occupa-tional and a behavioural notion of entrepreneur-ship. The former refers to individuals owning and managing a business for their own account and risk, while the latter focuses on entrepreneurial behavior in the sense of seizing an economic op-portunity (Wennekers 2006; Sternberg, Wennekers 2005). Following this last notion it is becoming of general agreement that attitudes towards entrepre-neurship are determinant factors when deciding to be an entrepreneur (Guerrero et al. 2006).
The conviction that entrepreneurship is about people has empirical evidences. Arenius and Min-niti (2005) have demonstrated that the perception of opportunities, the confidence about one’s own skills and knowing other entrepreneurs are some important individual factors in the explanation of entrepreneurship activities across countries. Also Koellinger et al. (2007) found strong evidence that subjective, and often biased, perceptions have a crucial impact on business start-up even if the cor-relation between the reported level of entrepre-neurial confidence and the approximate survival chances of nascent entrepreneurs across countries is negative. These results are important in the con-text of a set of new definitions of entrepreneurship like the one suggested by Acs and Szerb (2010),
which define entrepreneurship as “a dynamic in-teraction of entrepreneurial attitudes, entrepreneur-ial activity, and entrepreneurentrepreneur-ial aspiration that vary across stages of economic development”, or the one integrated in a more subjectivist theory of en-trepreneurship, which brings together elements of individual creativity, discovery, surprise and learn-ing (Mahoney, Michael 2005; Kor et al. 2007). Aditionally, several models
Following the line of thought presented above, this is, accepting as true that individual atti-tudes and perceptions regarding entrepreneurship can influence entrepreneurial activity, this research work tries to find groups of countries that share similar entrepreneurship´s attitudes and percep-tions. Applying a cluster analysis statistical meth-odology to the GEM dataset the main goal is to find some evidence that a regional pattern of atti-tudes and perceptions exists. Although this meth-odology is not a common one has been used in entrepreneurship analysis. See the examples of Becker et al. (2011), Cordon et al. (2008), Gartner (2002) and Barr et al. (1980), for several entrepre-neurship topics namely the relation between atti-tudes, perceptions and entrepreneurship.
Note that cluster analysis should be consid-ered an exploratory data-analysis technique (StataCorp 2009). According to Everitt (1993) this methodology is intended largely for generating rater than testing hypothesis. This idea drives its application in the present analysis. The paper aims to show that different world regions present differ-ent social contexts and backgrounds to the eco-nomic business environment. It is intended to di-vide the set of analysed countries in groups that share similar attitudes and perceptions regarding entrepreneurship. This is particularly important not only because the achievement of a relevant nation-al entrepreneurship rate depends on the socination-al and economic business environment but also because, despite the international attention given to entre-preneurship, it is not known if it is a global phe-nomenon or if there are particular regions where the entrepreneurial activity is specially recognized by society.
The paper is presented as follows. Next sec-tion presents the GEM dataset and the selecsec-tion of variables that defines attitudes and perceptions regarding entrepreneurship. The section also pre-sents some variable analysis. In section 3 a brief description of the methodology is presented. The cluster methodology results, and respective discus-sion, can be observed in section 4. Section 5 con-cludes.
2. Dataset and variables
The Global Entrepreneurship Monitor (GEM) is a research program, initiated in 1998 as a joint re-search initiative of Babson College in Wellesley (USA) and the London Business School, that fo-cuses on collecting annual harmonized data on entrepreneurship considered as a major driver of economic growth. The data is gathered to facilitate cross national comparisons, for an increasing
number of countries, regarding several entrepre-neurship indicators (Reynolds et al. 2005; Sten-berg, Wennekers 2005). The number of participat-ing countries has risen from 10 in 1999 to consistently above 30 from 2002 onwards. In 2010 is possible to compute entrepreneurship indicator for 59 economies all over the world as can be ob-served - and collected - in the GEM website
(http://www.gemconsortium.org/default.aspx). The
‘‘GEM countries’’ consist on a sample of devel-oped countries – the G8 countries, most OECD countries and almost all of the countries in Euro-pean Union – and a smaller group of developing countries in Latin America, Africa and Asia.
Nowadays, as referred in the previous section, more economists are attempting to measure entre-preneurial spirit across countries in a regional per-spective. Given the possibility to compare indica-tors across countries all over the world, data from GEM have been used to create indicators on re-gional entrepreneurial activity. These start being applied in entrepreneurship spatial analysis, name-ly in the process of mapping entrepreneurial activi-ty and entrepreneurial attitudes across regions (e.g. Bosma, Schutjens 2011, 2009, 2007).
The GEM´s Adult Population Surveys provide standardized data on each country population’s entrepreneurial preferences, capacities and activi-ties since it is believed that a country´s level of entrepreneurial activity is the result of its popula-tion’s assessments of entrepreneurial opportunities and entrepreneurial motivations and capacities (Sternberg, Wenneker 2005). This belief assumes a particular importance in an entrepreneurship analysis if emphasis is put is the Kirzner’s (1979) definition of entrepreneur. According to the au-thor, entrepreneur is the one who perceives and pursues economic opportunities in the face of un-certainty.
Five of the most important indicators comput-ed to measure each country perception and attitude regarding entrepreneurship are the following ones (Bosma et al. 2009):
• Entrepreneurship as a desirable career choice: percentage of 18-64 population who agree with the statement that in their country, most people consider starting a business as a desirable career choice; • High status successful entrepreneurship:
percentage of 18-64 population who agree with the statement that in their country, successful entrepreneurs receive high sta-tus;
you will often see stories in the public media about successful new businesses; • Perceived capabilities: percentage of
18-64 population who believe to have the re-quired skills and knowledge to start a business;
• Perceived opportunities: percentage of 18-64 who see good opportunities to start a firm in the area where they live.
The 2010 results for the above five indicators, are summarised in Table 1, where the rank of the 10 countries with the highest/lowest values, by indicator, are presented.
Table 1. Rank of the countries with the 10 highest and lowest values for the GEM’s indicators of attitudes and perceptions regarding entrepreneurship
Country % Country % Country % Country % Country %
Ghana 91 Malaysia 88 Tunisia 93 Uganda 81 Uganda 87 Colombia 89 Uganda 82 Saudi Arabia 92 Zambia 81 T rin. & T obago 83 Tunisia 89 Brazil 81 Ghana 91 Ghana 76 Jamaica 80 Chile 87 Peru 81 Egypt 89 Saudi Arabia 76 Vanuatu 80 Saudi Arabia 87 Ghana 79 Finland 87 Vanuatu 74 Zambia 78 Jamaica 85 South Africa 79 Uganda 87 Peru 71 Ecuador 77 Netherlands 85 Saudi Arabia 78 Iran 85 T rin. & T obago 69 Bolivia 76 Palestine 85 Taiwan 78 Jamaica 85 Colombia 68 Peru 76 Ecuador 83 Tunisia 78 Angola 83 Angola 67 Ghana 75 T rin. & T obago 83 China 77 Palestine 83 Sweden 66 Angola 73
Japan 28 Vanuatu 34 Croatia 50 Japan 6 Japan 14 Finland 46 Greece 35 Belgium 51 Korea (South) 13 Russia 23 Iceland 51 Italy 38 Japan 52 Greece 16 Malaysia 24 United Kingdom 51 Spain 41 Taiwan 58 Romania 18 Taiwan 26 Ireland 52 Croatia 42 Guatemala 60 Spain 19 Korea (South) 29 Germany 53 Uruguay 43 Iceland 61 Portugal 20 France 37 Slovenia 53 Guatemala 44 Uruguay 62 Russia 22 Romania 38 Hungary 55 France 45 Costa Rica 63 Croatia 23 Finland 40 Malaysia 56 Belgium 46 Mexico 63 Ireland 23 Israel 40 Vanuatu 56 Chile 46 Spain 63 Italy 25 Norway 40
TOP 10 - LOWEST VALUES
Entrepreneurship as Desirable Career
Choice
Media Attention for Entrepreneurship
High Status Successful Entrepreneurship
Perceived Opportunities
Perceived Capabilities
TOP 10 - HIGHEST VALUES
Regarding Table 1, entrepreneurship as a ca-reer choice ranges from 28% (Japan) to 91% (Ghana) for the target population. The conviction that there is a relationship between entrepreneur-ship and a high social status ranges from 50% (Croacia) and 93% (Tunisia). The statement that media pay particular attention to successful busi-ness stories ranges from 34% (Vanuatu) and 88% (Malaysia). The faith in individual entrepreneur-ship skills varies from 14% of the population (Ja-pan) and 87% (Uganda). Finally, the number of individuals who perceive entrepreneurship oppor-tunities in their country vary from 6% (Japan) and 81% (Uganda).
To measure entrepreneurship activity the GEM created the Total early-stage Entrepreneurial Activity (TEA) indicator. This indicator measures the percentage of 18-64 population who are either a nascent entrepreneur or owner-manager of a new business. The rank of the 10 countries with the highest and lowest percentages of entrepreneurial activity is presented in Table 2.
Italy (2.3%) and Japan (3.3%) are the two countries with the lowest percentage of entrepre-neurial activity. In opposition, Vanuatu (52.2%) and Bolivia (38.6%) are the countries with the highest values of entrepreneurial activity. Note that, with the exception of Japan, the countries with the lowest entrepreneurial activity rates are developed countries located in Europe. The coun-tries with the highest entrepreneurial activity rates are countries in a development stage.
Table 2. Rank of the countries with the 10 highest and lowest values for the TEA
Country % Country %
Vanuatu 52,2 Italy 2,3
Bolivia 38,6 Japan 3,3
Ghana 33,9 Belgium 3,7
Zambia 32,6 Denmark 3,8
Angola 32,4 Russia 3,9
Uganda 31,3 Germany 4,2
Peru 27,2 Romania 4,3
Ecuador 21,3 Spain 4,3
Colombia 20,6 Portugal 4,5
Brazil 17,5 Slovenia 4,7
Total early-stage Entrepreneurial Activity (TEA)
TOP 10 - HIGHEST VALUES TOP 10 - LOWEST VALUES
Figure 1 presents a scatterplot matrix that shows the relation between the five selected indi-cators of attitude and perception and the indicator of entrepreneurial activity.
Entrepreneurship as a desirable
career choice
Media attention
for entrepreneurship
High status successful entrepreneurship
Perceived opportunities
Perceived capabilities
Total early-stage Entrepreneurial
Activity
0
50 100 0
50 100
0
50 100 0
50 100
0
50 100 0
50 100
0
50 100 0
50 100
0
50 100 0
50 100
Fig. 1. Matrix of GEM´s indicators of attitudes and per-ceptions regarding entrepreneurship activity, for all considered countries
groups characterized by similar characteristics when the indicators of attitudes and perceptions towards entrepreneurship are used altogether. The identification of similar groups when putting to-gether all the five attitude and perception indica-tors needs a more complex statistical analysis – a cluster analysis, for example.
3. Brief Introduction to Cluster Analysis
The seminal work of Tryon (1939) introduced the cluster analysis. Such methodology is composed by a set of multivariate statistical methods that include different classification and optimization algorithms that intend to organize information concerning multiple variables and shape homoge-neous groups.
In other words the cluster analysis develops tools and methods that, given a data matrix con-taining multivariate measurements on a large number of individuals (or objects), the aim is to build up some natural groups with homogeneous properties out of heterogeneous large samples. The groups or cluster should be as homogeneous as possible and the differences among the various groups as large as possible. The cluster analysis does not make conjectures about the number of groups or its structures - the groups are based on the similarities (or dissimilarities) among the groups characterized by different ways of calculat-ing the "distance".
Several distinct methods can be used to meas-ure the distance (or similarity) among the elements of a data matrix. They propose to infer about (i) the distance among observations coming from the same group and the distance among observations coming from different groups, (ii) the dispersion of observations within the same group and (iii) the density of the observations distribution inside and outside the groups. Being the adopted variables quantitative variables, the application of the Eu-clidian Distance method is advised (Giudici, Figini 2009). The distance is defined as the square root of the sum of the squared differences between the values of i and j for all the selected variables
(v=1, 2,..., )p :
(
)
21
ij iv jv
v
d X X
ρ
=
=
∑
− , (1)where Xiv is the value of variable v for country i and Xjv is the value of the variable v for country
j.
Besides the settlement of the distance among observations, computation method is still neces-sary to settle the computational method to
calcu-late the distance among groups. Such step is par-ticularly important when applying hierarchical methods for cluster definition. These methods al-low obtaining a partition set associated with sub-sequent levels of aggregation among observations. This partition set can be represented graphically by dendrograms which are hierarchical structures with a shape similar to a tree shape. Indeed they represent partitions which leave from a more dis-aggregate observation division and come through a process of agglomeration that stops when all ob-servation are joined in a same group.
Dendrograms can be obtained through the adoption of different techniques no one better than the other a priori, since it is not possible to select a best method for a given set of information. It is necessary to try different alternatives and compare the related results. In this research work, there were selected two techniques that could be distin-guished by the fact that one of them – the com-plete linkage method – only demands the computa-tion of the distance matrix among observacomputa-tions, and the other – the Ward method (Ward 1963) – demands both the computation of the distance ma-trix among observations and the original mama-trix.
In the complete linkage method the distance between the two groups is defined as the maxi-mum of distances between each observation be-longing to the group and each observation belong-ing to other group:
(
)
( )
1 2
1 2 ,
, max ,
x y
d d x y
π π π π
∈ ∈
= , (2)
wherexis a country belonging to group π1 and y
is a country belonging to group π2.
In the Ward’s method an objective function is minimized to generate groups with a maximum internal cohesion and a maximum external separa-tion. The objective function is defined as the sum of squares of the standard error of individual ob-servations relatively to the mean of the group where they are classified. The distance between the two groups, π1 and π2, is difined as:
(
1, 2)
(
1 2)
(
( )
1( )
2)
d π π =SP π ∪π − SP π +SP π , (3) where,
( )
2x
SP x xπ
π π
∈
=
∑
− .parti-tion of the observaparti-tions will be the one that opti-mizes the chosen criteria. One of the processes that could be applied is the k-means interactive parti-tion method. The method follows the next steps: starts by dividing an initial partition of individuals by the number of clusters previously defined; computes for each cluster the respective centroid and the distances between each individual and the centroid of the various groups; transfers each indi-vidual to the cluster relatively to which presents the minor distance; re-computes the centroids of each cluster and repeats the previous steps until the moment each individual belongs to a stable cluster and, therefore, it is not possible to carry out more individual transfers among cluster. The method presents the disadvantage of limiting the search for an optimal partition of individuals since it restricts the number of predefined clusters. Still, it has the advantage of defining the regions be-longing to each cluster as well as the distance of each group.
4. Results of the cluster methodology
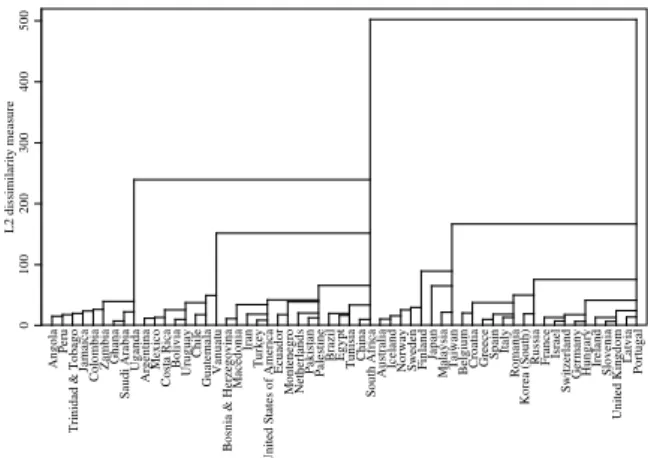
The empirical application of the cluster analysis present in this research work follows the methodo-logical steps suggested in the cluster analysis liter-ature. As mentioned in the previous sections it is not know, a priori, which is the best classification method to apply. So, were applied two distinct algorithms for the countries´ hierarchical classifi-cation – the complete and Ward´s linkage method-ology. The dendrograms obtained by the applica-tion of the complete and Ward´s hierarchical cluster analysis can be observed in Figure 2 and Figure 3, respectively.
0 50 100 150 L2 d is sim ila rity m e a su re A ngol a Pe ru Za m b ia G ha na S a udi A ra bi a U ga nda C ol om bi a Jam a ica T ri ni da d & T oba go C h ile G u at e m al a V a n u a tu A rge nt ina M e x ic o C o sta R ic a B os ni a & H e rz e govi na M a ce d o n ia B o liv ia U rugua y E c ua dor M ont e ne gr o Ira n T ur ke y U n ite d S ta te s o f A m e ric a A u str a lia Ice lan d No rwa y S w ed en F in la n d M a la y sia Ta iw a n Bra z il E gypt Tu n is ia C hi na S out h A fr ic a N e th e rl a n d s P a k is ta n P a le stin e B e lg iu m C ro a tia F ra n c e Is ra e l S w itz e rla n d G e rm an y H unga ry G ree c e Sp a in Ita ly R om a ni a Ire la n d S love ni a U ni te d K ingdom La tv ia P or tuga l K or e a ( S out h) R u ssi a Jap an
Fig. 2. Complete linkage dendrogram.
0 100 200 300 400 500 L2 d is sim ila rity m e a su re A ngol a Pe ru T ri ni da d & T oba go Jam a ica C ol om bi a Za m b ia G ha na S a udi A ra bi a U ga nda A rge nt ina M e x ic o C o sta R ic a B o liv ia U rugua y C h ile G u at e m al a V a n u a tu B os ni a & H e rz e govi na M a ce d o n ia Ira n T ur ke y U n ite d S ta te s o f A m e ric a E c ua dor M ont e ne gr o N e th e rl a n d s P a k is ta n P a le stin e Bra z il E gypt Tu n is ia C hi na S out h A fr ic a A u str a lia Ice lan d No rwa y S w ed en F in la n d Jap an M a la y sia Ta iw a n B e lg iu m C ro a tia G ree c e Sp a in Ita ly R om a ni a K or e a ( S out h) R u ssi a F ra n c e Is ra e l S w itz e rla n d G e rm an y H unga ry Ire la n d S love ni a U ni te d K ingdomLa tv ia P or tuga l
Fig. 3. Ward´s linkage dendrogram.
Note that all indicators are measured with the same scale so there was no need of variable stand-ardization. Denmark, that is the fourth country with the lowest rate of entrepreneurship activity (see Table 2), has been withdrawn from the set of countries in analysis since the country presented missing values for some of the selected variables in 2010.
The two hierarchical cluster methods have produced different results, however is possible to understand that some countries present clear simi-larities with others – in both dendrograms is possi-ble to see that some of the countries are close to each other independently of the method of distance computation. It is also possible to observe, in each dendrogram, the division of the all dataset in 4 or 5 main groups. Dendograms allow a first approach to the definition of the number of clusters expected in the optimization final solution. The visualiza-tion of the hypothetical country groups allows an-ticipating its optimal computational number as well as its composition.
The above results can be compared with the results computed by the non-hierarchical (or opti-mization) method chosen for the empirical analy-sis – the k-mean algorithm. This algorithm as-sumes that the number of groups (clusters) is previously known. However such assumption is rather unrealistic for most analysis problems since, normally, the data properties are not known. Thus the estimation of the number k of clusters is a fre-quent problem not only when applying the k-means algorithm but also other methods of clusters generation.
applied the Calinski-Harabasz pseudo F-test (Ca-linski, Harabasz 1974) - considered by Milligan and Cooper (1985) one of the best cluster stopping rules - for 4 or more clusters. The test indicates the division of countries in 4 groups is an adequate partition.
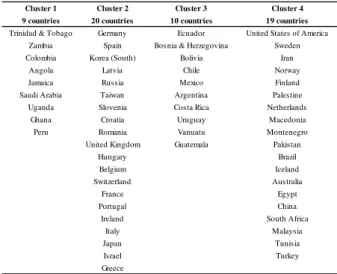
The results for the k-means methodology are presented in Table 3 (cluster´s composition) and Table 4 (cluster´s descriptive statistics).
The first group comprises 9 countries known as development countries. The second cluster con-tains the biggest number of countries (20). These are countries located, essentially, in Europe and with the highest stage of development. In this sec-ond group are some of the G-8 countries, for in-stance. The third cluster contains 10 countries characterised by their location – most of them are located in Latin America. The last cluster is the second biggest (19 countries) and seems to be the one that gathers the most distinct economies – lo-cated all over the world these countries are also in different stages of development and present differ-ent social, political, economical and legal envi-ronments. In cluster 4 is possible to find the US and Iran, for instance.
Table 3. Composition of the 4 clusters obtained
using the k-means cluster methodology.
Cluster 1 Cluster 2 Cluster 3 Cluster 4
9 countries 20 countries 10 countries 19 countries
Trinidad & Tobago Germany Ecuador United States of America Zambia Spain Bosnia & Herzegovina Sweden
Colombia Korea (South) Bolivia Iran
Angola Latvia Chile Norway
Jamaica Russia Mexico Finland
Saudi Arabia Taiwan Argentina Palestine Uganda Slovenia Costa Rica Netherlands
Ghana Croatia Uruguay Macedonia
Peru Romania Vanuatu Montenegro
United Kingdom Guatemala Pakistan
Hungary Brazil
Belgium Iceland
Switzerland Australia
France Egypt
Portugal China
Ireland South Africa
Italy Malaysia
Japan Tunisia
Israel Turkey
Greece
With the descriptive statistics (minimum, maximum and mean) presented in Table 4, is pos-sible to define a statistical profile of the attitudes and perceptions regarding entrepreneurship, in each cluster. The statistical profiles can be com-pared with the mean entrepreneurial activity (TEA) computed for each cluster.
Table 4. Statistics for the 4 clusters obtained using the k-means cluster methodology (%).
Min Max Mean Min Max Mean Min Max Mean Min Max Mean Entrepreneurship as
Desirable Career Choice 70 91 82,0 28 69 60.1 56 87 71.1 46 89 69,2 Media Attention for
Entrepreneurship 67 82 75,3 35 78 50.9 34 63 50.6 56 88 69,0 High Status Successful
Entrepreneurship 72 92 82,3 50 81 67.5 60 78 66.8 61 93 76,2 Perceived Opportunities 56 81 71,7 6 40 25.1 38 74 54.7 34 66 43,6
Perceived Capabilities 65 87 76,2 14 56 41.9 63 80 70.4 24 71 51,4 Total early-stage
Entrepreneurial Activity 23.7 5.35 20.3 9.2 Cluster 1 Cluster 2 Cluster 3 Cluster 4
Cluster 1 presents the highest average values for all the indicators selected to assess attitudes and perceptions regarding entrepreneurship. It is also the cluster with the highest average value for the entrepreneurial activity rate – in this group of countries, on average, 23.7% of the 18-64 popula-tion is either a nascent entrepreneur or owner-manager of a new business. In this group, 76.2% and 71.7%, of the same population, perceive en-trepreneurship opportunities and capabilities, re-spectively. The association between entrepreneur-ship and a high social status and a desired career is made by, approximately 82% of the target popula-tion and 75% thinks the media give a special atten-tion to the entrepreneurship topic.
The cluster with the second highest entrepre-neurial activity rate on an early stage is cluster 3 – 20.3% of the 18-64 population is engaged in a new business activity. This group presents also the sec-ond average rates for some of the attitudes and perceptions indicators – perceived opportunities, perceived capacities and entrepreneurship as a de-sirable career choice.
The fourth computed cluster (cluster 4) is the more difficult to characterise – its dispersion in terms of characteristics makes the analysis prob-lematic. It seems a group that collects the countries that do not had a place in the other groups than an actual homogeneous group.
6. Conclusions
Rhie (2009) referring Markham et al. (2002) stress the idea that are the perceptions of self-efficacy rather than objective ability that motivate individuals to demonstrate entrepreneurial behav-ior. As mentioned in the paper, the attitude to-wards entrepreneurship and the perception of ca-pabilities and opportunities, for example, can drive the entrepreneurial activity in a particular econo-my. Morris (2011) in a report about high-growth entrepreneurs, using GEM data, found that they have little fear of failure and are among the most likely of those surveyed to start a business because they perceive that there is an opportunity to be ex-ploited. However, despite the studies relating atti-tudes and perceptions to entrepreneurial activity, few are known about the spatial distribution of that attitudes and perceptions.
Using comparable cross-national data, cover-ing a set of distinct world economies in 2010, and applying a cluster analysis has been possible to divide 58 countries in 4 similar groups of coun-tries. A higher perception of opportunities and ca-pabilities is found mostly in non European and non high-income economies. Entrepreneurship as a career choice and associated to a high social status or the perception of a special attention given by the media to the entrepreneurship phenomena are also less likely to found in this segment of coun-tries. These attitudes and perceptions towards en-trepreneurship are most likely to be found in low and middle income countries located in Latin America, Africa and Asia.
As assumed this research work did not intend-ed to test hypothesis but rather generate it, so even if it has been observed a positive relation between high positive rates for the five attitude and percep-tion indicators and high entrepreneurial early-stage activity has not been tested any causal relation-ship.
References
Acs, Z.; Szerb, L. 2010. The Global Entrepreneurship and development Index (GEDI), DRUID Confer-ence paper on Opening up Innovation: Strategy, Organization and Technology, London, United Kingdom.
Arenius, P.; Minniti, M. 2005. Perceptual variables and nascent entrepreneurship, Small Business Economics 24(3): 233-247.
Barr, B. M.; Walters, N. M.; Fairbairn, K. J. 1980. The application of cluster analysis to entrepreneur-ial perception of regional economic environments, Environment and Planning A 12(8): 869-879.
Becker, K.; Kronthaler, F.; Wagner, K. 2011. The en-trepreneurship potential within Swiss regions: a comparison based on cluster analysis, in Raposo, M. Smallbone, D.; Balaton, K.; Hortoványi, I. (Eds.). Entrepreneurship Growth and Economic Development: Frontiers in European Entrepre-neurship Research. Edward Elgar Publishing Lim-ited. Cheltnham: United Kingdom, 180-204. Blanchflower, D. G.; Oswald, A.; Stutzer, A. 2001.
Latent entrepreneurship across nations, European Economic Review 45(4-6): 680-691.
Bosma, N.; Schutjens, V. 2011. Understanding re-gional variation in entrepreneurial activity and en-trepreneurial attitude in Europe, The Annals of Re-gional Science 47(3): 711-742.
Bosma, N.; Schutjens, V. 2009. Mapping entrepre-neurial activity and entrepreentrepre-neurial attitudes in Eu-ropean regions, International Journal of Entrepre-neurship and Small Business 7(8): 191-213. Bosma, N. S.; Acs, Z. J.; Autio, E.; Coduras, A.;
Lev-ie, J. 2009. Global Entrepreneurship Monitor 2008 Executive Report, Babson College, Univer-sidad del Desarrollo and London Business School. Bosma, N.; Schutjens, V. 2007. Patterns of promising
entrepreneurial activity in European regions, Journal of Academic and Social Geography 98(5): 675-686.
Calinski, T.; Harabasz, J. 1974. A dendrite method for cluster analysis, Communications in Statistics – Theory and Methods 3(1): 1–27
Cardon, M. S.; Shinnar, R. S.; Eisenman, M.; Rogoff, E. G. 2008. Segmenting the population of entre-preneurs: a cluster analysis study, Journal of De-velopmental Entrepreneurship 13(3): 293-314. Everitt, B. S. 1993. Cluster Analysis, John Wiley &
Sons: London.
Gartner, W. B. 2002. What are we talking about when we talk about entrepreneurship?, Journal of Busi-ness Venturing 5(1): 15-28.
Giudici, P.; Figini, S. 2009. Applied Data Mining for Business and Industry, John Wiley & Sons Ltd.: London.
Grilo, I.; Thurik, R. 2006. Latent and actual entrepre-neurship in Europe and the US. Some recent de-velopments, International Entrepreuneurship and Management Journal 1(4): 441-459.
Guerrero, M.; Rialp, J.; Urbano, D. 2006. The impact of desirability and feasibility on entrepreneurial intentions: a structural equation model, Interna-tional Entrepreneurship and Management Journal 4(1): 35-50.
Kirzner, I. M. 1973. Competition and Entrepreneur-ship, University of Chicago Press: Chicago. Koellinger, P.; Minniti, M.; Schade, C. 2007. “I think
Kor, Y. Y.; Mahoney, J. T.; Michael, C. 2007. Re-sources, capabilities and entrepreneurial percep-tions, Journal of Management Studies 44(7): 1187-1212.
Mahoney, J. T.; Michael, S. C. 2005. A subjectivist theory of entrepreneurship, in, Alvarez, S; Agarwal, R.; Sorensen, O. (Eds), Handbook of En-trepreneurship, Kluwer: Boston, MA: 33-53 Markman, G. D.; Balkin, D. B.; Baron, R. A. 2002.
Inventors and new venture formation: the effect of general self-efficacy and regretful thinking, Entre-preneurship Theory and Practice 27(2): 149-165. Milligan, G. W.; Cooper, M. C. 1985. An examination
of procedures for determining the number of clus-ters in a dataset, Psychometrika 50(2): 159–179. Morris, R. 2011. High-impact entrepreneurship global
report, Center for High Impact Entrepreneurship at Endeavor.
Reynolds, P.D.; Bosma, N.; Autio, E.; Hunt, S.; de Bono, N.; Servais, I.; Lopez-Garcia, P.; Chin, N. 2005. Global Entrepreneurship Monitor: Data Col-lection Design and Implementation 1998 –2003, Small Business Economics 24(3): 205–231.
Rhie, Z. A. 2009. Entrepreneurship as a career choice: an analysis of entrepreneurial self-efficacy and in-tention of university students, European Journal of Social Science 9(2): 338-346.
StataCorp. 2009. Stata Multivariate Statistics Refer-ence Manual – Release 11, Stata Press Publica-tion. College Station: Texas.
Sternberg, R.; Wennekers, S. 2005. Determinants and effects of new business creation using Global En-trepreneurship Monitor data, Small Business Eco-nomics 24(3): 193-203.
Tryon, R.C. 1939. Cluster Analysis, McGraw-Hill. New York.
Ward, J. 1963. Hierarchical Grouping to Optimize an Objective Function, Journal of American Statisti-cal Association 58: 236-244.