Who are they? The Parliamentary deputies in Portugal,
11
th-13
thlegislatures. Social and political outline
Quem são eles? Os deputados parlamentares em Portugal,
11.ª –13.ª legislaturas. Perfil social e político
Judite Gonçalves de Freitas1 Aristotelis Pittaris2
Abstract: The study combines the assumptions of the elite’s studies with the dynamics of democratic societies, starting with the empirical collection of data on the Portuguese parliamentary elites from the 11th to the current legislature (13th), with the purpose of building a prosopographic database. The data processing was carried out by legislature, aiming to identify and analyze statistically the relevant quantities of biographic data about the MPs. The study was a cross-sectional survey in which political and sociodemographic issues of the Portuguese deputies where explored and correlated to define the group's profile. In this way, the collected data provided a comparative evaluation of the three legislatures (2009-2011, 2011-2015 and 2015 to present) and created an interrelation between two main analysis dimensions: the sociodemographic one (age, gender representation, educational credentials and occupation) and the political one (parliamentary group, previous held positions (political or party background); career paths – local and / or central power, ex-ministers, number of terms on office). The profile of the members of Parliament as a whole become visible, and the variances marked by electoral processes.
Keywords: parliamentary elites; prosopography; political representation; gender representation; Portugal
1 Faculty of Human and Social Sciences of University Fernando PessoaPorto, Portugal. CEPESE – Center for Population, Economics and Society Studies, UP. E-mail: jfreitas@ufp.edu.pt; judisatier@gmail.com
2 Graduate in Political Science from Aristotle University of Thessaloniki, Greece, Faculty of Economic and Political Sciences, School of Political Science. E-mail: tetes_89@windowslive.com
CEPESE Porto, vol. 29 jun 2018, p. 61-81
Resumo: Este estudo articula os pressupostos dos trabalhos sobre elites com a dinâmica das sociedades
democráticas, principiando com a recolha empírica de dados sobre as elites parlamentares portuguesas da 11ª até à atual legislatura (13ª), com o propósito de construir uma base de dados prosopográfica. O processamento dos dados foi realizado por legislatura, com o objetivo de identificar e analisar estatisticamente a quantidade e a qualidade de dados biográficos relevantes sobre os deputados parlamentares. Trata-se de um estudo global, no qual as dimensões política e sociodemográfica caraterizadoras do perfil dos deputados portugueses foram exploradas e correlacionadas com o objetivo de definir o perfil sociopolítico do grupo. Neste contexto, os dados recolhidos e sistemática e estatisticamente tratados possibilitaram o estudo comparado das três legislaturas (2009-2011, 2011-2015 e 2015 até ao presente), e permitiram o estabelecimento de uma relação entre as duas principais dimensões análise: a sociodemográfica (idade, representação de género, níveis de escolaridade e ocupação) e política (grupos parlamentares, posições anteriores ocupadas (antecedentes políticos ou partidários), planos de carreira (poder local e/ou central, ex-ministros, número de mandatos). O estudo define o perfil dos membros do Parlamento Português como um todo e as oscilações marcadas pelos processos eleitorais.
Palavras-chave: elites parlamentares; prosopografia; representação política; representação de género; Portugal
Introduction
This article presents a social and political account of Portuguese members of Parliament (henceforth MPs) from the 11th to the 13th legislature3. The study method was founded on the elaboration of a database with biographical data on the website of the Portuguese Parliament (main source). Using the prosopographical method as that explained in most of any studies published in recent times on the subject of contemporary political elites (ALMEIDA, 2012; MAGONE, 2000 et al.). The prosopographical approach allowed not only organizing collected data but also the statistical analyses. Nowadays, «elites and social distinction have a long vibrant history» (VERGARA, 2013, p. 32). Traditionally, the study of the elites and the social structures of power is a well-developed subject in Classic Antiquity (FOSSEY, 1995) or in medieval political societies (BULST; GENET, 1986). The recent theorists of political sociology, mostly since the 60s until today, highlighting the existence of ‘distinct qualities’ (social distinction) and/or ‘class domination’ in modern societies furthering the studies of elites in democratic societies (BOUDIEU, 1984; DOMHOFF, 2012)4. Currently, the prosopographic studies of elites in modern democracies are a way to analyze the social changes in the power structures (MAGONE, 2000; VERGARA, 2013). In this context, the topic analysis is inserted in line studies of European national parliamentary elite’s that sets out to define relevant questions and sub-questions in the social, political and legislative structures, which is consistent with standard issue analysis (BEST; COTTA, 2000).
The aim of this study is to describe and to analyze the main technical features of the parliamentary elites during this short but troubled political period concerning the Financial Crisis of 2008 to the Economic Adjustment Programme for Portugal.
3 The biographical data of MPs were collected and processed on the Portuguese Parliament's website. We want to thank Pedro Tavares de Almeida and José Magone for making their published data available, namely for the First Portuguese Republic (1910-1926) and since the beginning of the Second Portuguese Republic (1976) until 1999, respectively.
4 There are many academic studies on political elites, from the classic theses of MOSCA (1896) and PARETO (1901). A synthesis can be found in Vergara, 2013.
In this framework, the selection of these three legislatures (2009-2011, 2011-2015 and 2015 until today) is based on three main reasons of a different matter: First, in a practical way, we have access to primary sources on the website of the Portuguese Parliament with biographical data of the deputies. This site offers all the historical and current parliamentary records and most of the data are available online. A second reason, concerning policy, is that by working on the 11th, 12th and 13th legislatures we can formulate the following working hypothesis: who were the deputies that dealt with the Economic Crisis of 2008, the Memorandum of Understanding (2011), the Troika Financial Bailout and the Economic Adjustment Programme for Portugal (2011-2014)5. The last but not
the least goal, reports to the distinct electoral results, in three electoral processes (2009, 2011 and 2015). In fact, the nationwide parliamentary elections provide rewarding material for a political and social account of Portuguese deputies in the 2009-2018 period. The size and scope of the data we collectand processing in a prosopographical database allowed for a comparative political and socio-demographic evolution of the parliamentary composition in the three legislatures to highlighting the major changes. In these sense, the prosopographical study of parliamentarians is based on the analysis of tenure deputies of the three legislatures, underlying the following criteria: political-party parliamentary distribution map, previously held positions, and number of terms in office, age, political background, educational studies, gender representation. Our interest is to analyze the political and social changes in parliamentary physiognomy by comparing the features of the Legislative Assembly configuration which occur in the three legislatures. In the same way, the data will be compared with other political cycles or periods (the First Portuguese Republic, 1910-1926, and the Second Portuguese Republic, 1976 onwards).
The changes in the profile of the Portuguese Constitutional Assembly, following electoral processes, were related to different political moments. In democracy times, namely between 1976 and 1987 (1st to 4th legislatures), Portugal experienced eleven legislative processes (1976, 1979, 1980, 1983 and 1985) and four times legislative assembly was dissolved before the end of its normal mandate for various political reasons: prime ministers layoffs, rejection the confidence vote in the government and president of the Republic dissolved the Assembly of the Republic. «Moreover, until 1987, the legislatures were quite fragmented: no party was able to gain an absolute majority, which was quite destabilizing for a young democracy» (MAGONE, 2000, p. 357). In fact, this period seams to correspond to a first political cycle of the Portuguese modern democracy dominated by party divisions and electoral minorities that conditioned the achievement of fragile and temporary coalitions.
The year 1987, however, can be considered the turning-point in the development of the Portuguese democracy. The absolute majority gained by PDS in 1987, and again in 1991, was an important factor in promoting the stabilization, routinization, and professionalization of the Portuguese Assembly of the Republic (MAGONE, 2000, p. 357). From then, a tendency towards bipolarization of the party domain between PS left) and PSD (centre-right), that triumph with some electoral majorities (1987, 1991 and 2005) and electoral minorities that controlled the legislature to the end (1995).
A recent long-term study highlights the growing trend towards for the bipolarization between the PS and the PSD in Portuguese society, since 1987 until 2009, associated to a higher level of government stability and the primacy of the experts (PINTO; ALMEIDA, 2017, p.118). This pattern has been changing in the 20096, 20117, and more clearly in the 2015 legislative elections, with an agreement that promoted a coalition between the PS (centre-left) and the radical left (BE – Bloco de Esquerda and CDU-PEV – Coligação Democrática Unitária-Partido Ecologista “Os Verdes”). From the parliamentary composition, the party contract allowed the formation of a left majority (52.9%) in the assembly seats. For the first-time, the parliamentary support of the left-wing parties (PCP-PEV and BE) ensured the parliamentary support of the executive of António Costa (PS secretary-general). Table 1
The Portuguese Legislative Assembly (2009, 2011, 2015)
Parties
2009 2011 2015
n % n % n %
PS (Partido Socialista) 97 42.17 74 32.17 86 37.39
PSD (Partido Social Democrata) 8 35.21 108 46.95 89 38.69
CDS-PP (Partido Popular) 21 9.13 24 10.43 18 7.82
BE (Bloco de Esquerda) 16 6.95 16 6.9 19 8.26
PCP-PEV (Coligação Democrática Unitária) 15 6.52 8 3.47 17 7.39
PAN (Pessoas – Animais – Natureza) _ _ _ _ 1 0.43
Total 230 230 230
Source: www.cne.pt (own elaboration).
At first, in 2009, in the legislative elections, the PS left) won with 36.55% of votes, and PSD (centre-right), the second party-political force, had 29.11% of votes. The worsening economic crisis effect and the austerity program overthrow the socialist government. The June 2011 elections changed the Portuguese political map, and promoted a centre-right coalition (PSD and CDS-PP) that impose the Troika financial bailout and austerity measures, including several social reforms (FREIRE; LISI; LEITE, 2014). In the last legislature (present-day), outgoing prime minister Pedro Passos Coelho's centre-right party won the 2015 election but failed to muster a coalition. António Costa (Prime Minister),secretary general of the Socialist Party, the second political force in the Constitutional Assembly, signed agreements with the Left Bloc (BE), Communist Party (PCP) in coalition with The Greens (PEV). The two PS alliance partners,a couple of smaller left-wing parties, guaranteeing a majority in Parliament and ensure political stability. This coalition government announced the ‘turn the page on austerity’. The political changes in Portuguese Parliament promoted several changes of the MPs that will be analyzed in this prosopographical research that has the goal of knowledge about patterns of relationships and 6 Minority government of José Sócrates (PS) resigns in March 2011 after the rejection of the Economic Adjustment Programme.
7 The president of the Republic, Aníbal Cavaco Silva, invites the president of the most voted party, Passos Coelho, to form a government with parlia-mentary support of CDS-PP, forming a center-right government.
activities of parliamentary members in the last legislatures.
In the first point, we proceed to sociodemographic analysis (age, gender, education, occupation); secondly, in order to examine the political structure of the Portuguese constitutional assembly, is done a multiple political career-line analysis.
1. Sociodemographic analysis 1.1 Age profile of MPs
The average age of Portuguese MPs remains almost the same through the three legislatures, and although a slightly increasing from 45.2 y.o. to 45.5 y.o. to 4.9 y.o. It’s an average of seven years less than France in 2007, with 52.2 y.o. (FRANÇOIS; GROSSMAN, 2011, p. 368), and five years than United Kingdom in 2017 (BARTON; AUDICKAS, 2016, p. 5), but much higher than the average age of Portuguese deputies of the First Republic, which ranges between 36.9 in 3rd legislature and 42.8 in 7th legislature (ALMEIDA, 2012, p. 43). If we look at the gender variable we will see that men deputies were even ten years older than women, as it happens, namely in the 13th legislature8.
If we move to age groups now the huge majority, around 60% of deputies, men and women, are between 40
and 60 years old, following by the category of under 40 (26.5%, 28.8% and 23.5%) (Graph 1). And again, the deputies from 11th to 13th legislatures are much older than the deputies of the Portuguese First Republic, whose percentages were 54.8% for the ones under 40 and 34.6% for the ones between 40 and 60 (ALMEIDA, 2012, p.
42). Nonetheless, compared with 1990s, when most of the MPs were elected over 50 years, specifically in the
sixth (1991-1995) and seventh (1995-1999) legislatures (MAGONE, 2000, p. 359). Since the 2010s there are a tendency to increasing the number of older MPs: between 70 to 75% of the parliamentary deputies are over 40 years old, and a great part of them have more than 50 (Table 2).
Graph 1
Age groups of MPs (%)
Source: Biographical data of the website of the Portuguese Parliament (own elaboration).
Table 2
The age ranges of Portuguese MPs (2009-2018)
Legislatures
(number and % of deputies)
Age ranges
20-29 30-39 40-49 50-59 60-69 70-79
11th Assembly of the Republic 8 53 63 73 31 2
% 3.47 23.04 27.39 31.73 13.47 0.86
12th Assembly of the Republic 7 59 78 60 24 1
% 3.05 25.76 34.06 26.2 10.48 0.43
13th Assembly of the Republic 10 44 74 65 35 2
% 4.34 19.13 32.17 28.26 15.21 0.86
Source: Biographical data of the website of the Portuguese Parliament (own elaboration).
From the data provided by the Inter-Parliamentary Union for 2016, Portugal was ranked 28th concerning the
deputies under 40 years old, placed under Italy (10th with 32.8%) and Spain (14th with 14%) but above Greece
(85th with 12%) and France (105th with 7.6%) (Inter-Parliamentary Union, 2016b, p. 24). In the same essay,
Portugal was ranked 46th (along with India) out of 88 countries with 2.2% of deputies under 30 years old. It is
placed under Italy (6th with 6.6%) but above the average 1.9% for the whole world (Inter-Parliamentary Union,
2016b, p. 4). However, in our research we found that in 2015 elections 4.4% of the deputies were under 30 years old and therefore that places Portugal in the 21st position9.
On the relationship between age and party identification, the right wing CDS-PP had the youngest deputies,
although we can detect a slight increase in 2015 that places it near the left-wing BE. The centre-right party (PSD) moves in the opposite direction with a decrease of the average age in 2015. The center-left PS had always the older deputies, with the maximum of 51.2 years old in 2015. As for the left parties, PCP is extremely stable in all three legislatures. It seems that the partisanship increases with the age. The BE records an increase of more than 2 years in 2011, in the elections when it lost half of its MPs (from 16 in 2009 remained only 8).
9 About the places of birth, we have no available data on the Portuguese Parliament site. The collecting of this information will be done in other type of files to take the birth certificates of all MPs.
Graph 2
Average age of MPs by political party (years)
Source: Biographical data of the website of the Portuguese Parliament (own elaboration).
1.2 Gender representation of MPs
Nowadays there are many studies about the gender representation in the Parliaments and women in politics, putting the relevance in the elimination of discrimination on different grounds, including sex (RIVIÈRE-DE FRANCO, 2014). The European gender parity movement represented by Declaration of Atenas (1992) recognized «women’s under-representation in the decision-making bodies of Europe’s members states as a democratic deficit» is an awareness moment of the gender imbalance in political activities (PRAUD; DAUPHIN, 2010, p. 22). Gradually, in Western European countries, some measures and constitutional reforms, add to increasing women's political participation and representation10.
In Portugal, the promotion of equality between women and men on politics had a great step with the enactment of the Organic Law on Parity gender for Parliament, European Parliament and Local Authorities enacted in 2006 to ensure a minimum representation of 33% of each sex to political bodies (Lei Orgânica n. 3/2006, 21st of August). In comparative politics field our neighboring country – Spain –, «the gender quota law of 2007 operated in conjunction with both the electoral and party systems in the legislative elections in 2008 and 2011, to get a gender presence balance in the elected house (ie, a minimum of 40% for each gender)» (TRUJILLO; PÉREZ, s.d., p. 3). In Spain, the last general elections of 2016, the representation of women in the parliament reached 39.4%; a higher value than in the Portuguese Parliament with a value of 34% (LOMBARDO; VERGE, 2017, p. 304).
In the relation gender and parties, the two right parties increased their proportion of women deputies in 2015: PSD from 27.2% (2009) to 36% (2015) and CDS-PP from 23.8% (2009) to 38.9% (2015). On the center-left, PS remained fairly stable, having values between the 33% (2009) to 30.2% (2015). In the left, there are big differences. PEV with only two deputies had always a 50% of women representation. BE also was always above the 30%, with 37.5% in 2009, 50% in 2011, though decreased to 31.6% in 2015. The exact opposite happened to PCP-PEV that has a great increased to 41.2% in 2015 from the 20.0% in 2009 and 18.8% in 2011.
10 At this point, our interest is considering the establishment of representative democracy – gender representation – in the Portuguese Assembly and do not discuss the relationship between descriptive representation and substantive representation. For this subject see PITKIN, 1967.
Table 3
Woman MPs by political party (%)
Political party 11th legislature (%) 12th legislature(%) 13th legislature(%)
PSD 27.2 28.7 36.0
PS 33.0 32.4 30.2
CDS-PP 23.8 20,8 38.9
BE 37.5 50.0 31.6
PCP-PEV 20.0 18,8 41.2
Source: Biographical data of the website of the Portuguese Parliament (own elaboration).
The Graph 3 accomplish the whole relation between women’s and men’s access to elected seats in Portuguese Parliament in the three legislatures (11th to 13th). All two major political parties (PS and PSD) were led by men, but women's parliamentary representation ensured in general by 29.6% (11th legislature), 29.1% (12th legislature), and in the 13th legislature there is an increase for 33.9%, being in accordance with the law of parity.
Graph 3
Men’s and Women’s representation (%)
Source: Biographical data of the website of the Portuguese Parliament (own elaboration).
To see, in comparative terms, international global values, in the Inter-Parliamentary Union essays about the Women’s in Parliament, Portugal, in 2009 and 2011 times was close to achieve the 30% target. That was also a result of the new electoral agreement that required that political parties will have to nominate women candidates at least at a ratio of one out of three candidates, as we said (Inter-Parliamentary Union, 2011, p. 2-4).
In global statistics, Portugal in 2009 ranked the 10th position under South Africa (1st with 43.5%), Germany (6th with 32.8%), but over Greece (23rd with 17.3%) and France (with 17.3% as of 2007) (François & Grossman, 2011, p. 367). It had also a higher proportion than Europe (21.4%).
In 2011, Portugal ranked in the 14th position under Andorra (1st with 50%) and Spain (7th with 36%). It was one of the 26 countries in which a decrease of the number of women deputies took place, among Spain, Cyprus, Estonia and others. The «electoral realignments» in these countries, partially due to the economic crisis
had as one of their result the replacement of women deputies by men of the incoming party or coalition (
Inter-Parliamentary Union, 2011, 2-5).
Lastly, for 2015, Portugal was one of the five countries that at first time entered in the 30%+ group. That year it was ranked 12th under Mexico (1st with 42.4%), Spain (3rd with 40%), but over UK (16th with 29.4%) and
Greece (25th with 19.7%). From the 4453 Portuguese candidates the 1900 or the 42.7% were women, although
with the small success rate for election in Parliament of 3.8% (Inter-Parliamentary Union, 2016a, p.1, 5 and 11). 1.3 School and university background of MPs
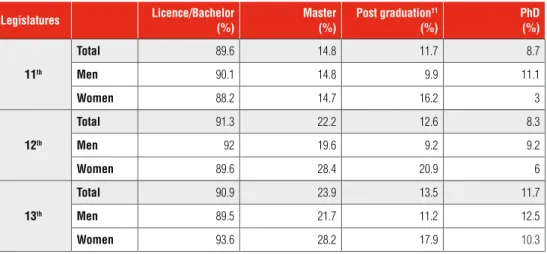
For all three legislatures, nine out of ten of all deputies have a bachelor’s degree and that means that contrary to the conclusions about Italy, education is still very significant for the entrance in the Portuguese Parliament (FEDELI; FORTE; LEONIDA, 2014, p. 119). In the master degrees we detect an increase from the 14.8% in 2009 to the 22.2% and 23.9% in the two following elections, while in the PhD´s there is a small decrease from 8.7% in 2009 to 8.3% in 2011 and up to 11.7% in 2015. Women´s percentages of holding a master degree are bigger than men MPs, while the contrary applies for the PhD.
Table 4
Academic degrees of MPs (%)
Legislatures
Licence/Bachelor(%) Master(%) Post graduation(%)11 PhD(%)
11th Total 89.6 14.8 11.7 8.7 Men 90.1 14.8 9.9 11.1 Women 88.2 14.7 16.2 3 12th Total 91.3 22.2 12.6 8.3 Men 92 19.6 9.2 9.2 Women 89.6 28.4 20.9 6 13th Total 90.9 23.9 13.5 11.7 Men 89.5 21.7 11.2 12.5 Women 93.6 28.2 17.9 10.3
Source: Biographical data of the website of the Portuguese Parliament (own elaboration).
11 There is an explicit distinction between post-graduate, masters and PhD academic training in the Parliament website. The masters and doctorates are named, correctly, as academic degrees, and the others as postgraduates in some specific branches of knowledge, e.g., tourism management, organiza-tions management, political marketing et al.
The big percentage of the Portuguese deputies (between 64.8% in 2009 and 70.9% in 2015) were licensed in social sciences12. Almost the one third of all deputies have a law degree, followed by those that have a degree in economics. We detect relatively high percentages also in the engineering field (8.3% to 9.1%) and the humanitarian studies (7.8% to 10.9%).
Compared to the image from the First Portuguese Republic there are some similarities and differences. The former is the high proportion of degree holders, then and now around 90%. The latter is the changing in the educational fields. There is a slight decrease for the law degree holders from 41.1% for the First Republic to 33-37% in our study, which doesn´t cancel though the conclusion that the ‘men of law’ due to their rhetorical abilities and knowledge are an essential part of the political elites. There is also the disappearing in military servants, from 21.5% then to 0% now and in medical degree holders from 20.5% to 3-4% in our study. Conversely, the engineering field almost double its size (4.1% in First Republic compared to 8.3%-9.1% now) and the Humanities almost triple theirs (3.1% in First Republic compared to 7.8%-10.9% now) (ALMEIDA, 2012, p. 46).
In the whole of MPs, during the 11th legislature 206 (89.6%) have graduation (license), in the 12th assembly 210 (91.3%) have a license, and finally, in the 13th assembly 208 (90.9%) have a license and only one is bacharel.
Both men and women deputies have high percentages of bachelor’s degrees, with men mostly in the law, economy and engineering field, while women have almost the double percentages than men in the humanitarian studies (9%-17.7% for women compared to 4.6%-8% for men).
As for political parties, the PSD have the highest percentages of bachelor degree holders, followed by PS. Both the left and right parties were below the 90%. The MPs of all political parties have the clear majority of their diplomas in the social field studies, following by engineering and humanities studies, with the exception of CDS-PP, whose MPs have degrees in health and natural sciences. The MPs of CDS-PP and PSD have in their majority law degrees (57.1%-66.7% and 38.2%-42% respectively), while the opposite applies for the BE deputies (0%-12.5%). MPs with graduation in law are also the majority in the coalition between PCP and PEV, although declining from 40% in 2009 to 37,5% in 2011 and 29.4% in 2015.
Taking a closer look at the PSD, CDS-PP and PS we acknowledge the big significance of economists and managers (29.6% to 22.5% for PSD, 9.5% to 11.1% for CDS-PP and 13.4% to 18.6% for PS) and university professors (17.3% to 20.2%, 33.3% to 22.2% and 16.5% to 25.6% respectively). BE also had a majority of professors in 2009 (31.3% of its deputies) and 2015 (26.3%), the years where it had also its most power in the Parliament.
1.4 Area of Academic Training of MPs
The most significant occupational background of MPs over the three legislatures is one of the ‘traditional’ professions – the lawyers – with values between 29.5% and 33.3% for men and 19.1% to 27.9% for women.
The second biggest group is the one of economists, gestors, businessmen and advisors of companies, with
values between 19.7% and 23.4% for men and 8.8% to 13.2% for women. In the third category comes the university professors, with almost the same value for women (16.1% to 23.7%) and men MPs (19.7% to 21.7%). The fourth place is occupied by school teachers, followed by social scientists and the public administration offices. The numbers of school teachers and university professors represented a very high number, compared to the evolution of the English parliament, in which there is a tendency for the decline since 2005 (BARTON; AUDICKAS, 2016, p. 12). Therefore, we can detect the same pattern as with the Italy´s
case where the professions of ‘managers, industrialists and entrepreneurs’ tended to emerge in the Parliament (FEDELI, FORTE; LEONIDA, 2014, p. 118), even though in our case the legal profession does not lose its importance. In the contrary, compared with the deputies of the First Portuguese Republic we see that the number of lawyers has increased (from a 18.9% then to something between 29.1% and 32.6% now). Also increasing are the numbers of university professors (from 4.8% then to 18.6-22.1% now). Conversely, and following the decrease of the educational degree fields, the military men went from 19.9% to 0% and the doctors from 11.7% then to almost 3.5% now (ALMEIDA, 2012, p. 47).
Table 5
Academic area of MPs with higher educational studies
Area of Academic Training Lawyers Economists/ Gestors Social Sciences* Health Sciences Positive Sciences University professors School professors Engineers/ Architects Consultant Public administratorsOthers** 11th Assembly of the Republic 67 41 14 7 3 43 26 10 8 16 16 (%) 29.13 17.82 6.08 3.04 1.30 18.69 11.30 4.34 3.48 6.96 6.95 MALES 54 32 9 5 2 32 15 7 7 5 12 (%) 33.33 19.75 5.55 3.08 1.23 19.75 9.25 4.32 4.32 3.08 7.40 FEMALES 13 9 5 2 1 11 11 3 1 11 4 (%) 19.11 13.23 7.35 2.94 1.47 16.17 16.17 4.41 1.47 16.17 5.88 12th Assembly of the Republic 75 44 9 8 4 42 26 11 8 14 16 (%) 32.60 19.13 3.91 3.47 1.73 18.26 11.30 4.78 3.47 6.08 6.95 MALES 56 38 5 6 2 31 16 7 6 7 12 (%) 34.56 23.45 3.08 3.70 1.23 19.13 9.87 4.32 3.70 4.32 7.40 FEMALES 19 6 4 2 2 11 10 4 2 7 4 (%) 27.94 8.82 5.88 2.94 2.94 16.17 14.70 5.88 2.94 10.29 5.88 13th Assembly of the Republic 68 39 15 7 3 51 16 17 7 16 14 (%) 29.56 16.95 6.52 3.04 1.30 22.17 6.96 7.39 3.04 6.95 6.08 MALES 47 29 9 5 2 33 10 14 5 9 8 (%) 30.92 19.07 5.92 3.28 1.31 21.71 6.57 9.21 3.29 5.92 5.26 FEMALES 21 10 6 2 1 18 6 3 2 7 6 (%) 26.92 12.82 7.69 2.56 1.28 23.07 7.69 3.86 2.56 8.97 7.69
* Historians, psychologists, sociologists, journalists et al. ** Students, tecnicians, labor workers et al.
An appointment on the occupation of the MPs, we can underscore the proportion of lawyers decreasing as we move from the right side to the left of the political spectrum. CDS-PP has the highest percentages, from 52.4% in 2009, 50% in 2011 to 61.1% in 2015, followed by PSD, whose one third of deputies were lawyers. PS moves between 22.7% in 2009 and 25.7% in 2011. The coalition PCP-PEV had 40% of lawyers MPs in 2009 but dropped to 29.4% in 2015 and BE had not a single lawyer MP in all three legislatures.
Taking a closer look at the PSD, CDS-PP and PS we acknowledge the big significance of economists, businessman and managers (27% to 34.6% for PSD, 12.5% to 16.7% for CDS-PP and 16.5% to 20.9% for PS) and university professors (16.7% to 20.2%, 22.2% to 33.3% and 16.5% to 25.6% respectively). BE also had a majority of university professors in 2009 (31.3% of its MPs) and in 2015 (26.3%), the years where it had also its most power in the Parliament.
2. Political assignments
2.1 Number of terms in office for MPs
The percentage of the first-time elected deputies is far bigger than all the other categories in the 11th and 13th
legislatures, reaching the 37.4% and 36.1%. In the 12th, although it falls to 27.8%, coming second after the
29.6% of deputies who were elected four (4) or more times. In the total of 690 deputies of the three legislatures the 33.8% of them were elected for the first time, a number much lower than the 65% of the deputies of the First Portuguese Republic (more or less a century ago). Conversely in the other categories the percentages are higher than those of the First Republic (elected 2 times in office: 21%, 3 times: 6.1%, 4 or more times: 7.9%), and that is an indicator for the institutional stability of the parliamentary careers of today´s deputies (ALMEIDA, 2012, p. 51). If we compare the 11th legislature of 2009 with the French 13th legislature of 2007 we will find that there are less French deputies elected for the first time (30%) and 4 times or more (22%), but more to the other categories
(2 times in office: 28%, 3 times: 20%) (FRANÇOIS; GROSSMAN, 2011, p. 374).
Graph 4
Number of terms in office for MPs (%)
For the centre-right PSD, 21.4% were elected in all three legislatures and the newcomers were much higher: 46.9% in 2009, 41.7% in 2011 and 32.6% in 2015. In another way, the center-left PS was more stable, with 30.2% of its deputies serving in all three legislatures and having much less newcomers than PSD, with 33% in 2009, 18.9% in 2011 and 41.9% in 2015. The low percentage of 2011 can be explained by the fact that PS lost almost the one fourth of its 2009 power, electing only 74 deputies compared to the 97 in 2009. As a result, the ones elected were those with more political experience (27% were elected 3 times before and 32.4% were elected 4 or more times). In all three elections the percentage of its veteran deputies remained almost the same, from 32% in 2009 and 2011 to 30% in 2015.
Finally, the right party (CDS-PP) had half of its deputies serving in all three legislatures, and its number of newcomers were between 16.7% in 2011 and 38.1% in 2009 and the smaller parties on the left of the political spectrum had usually very small percentages of deputies elected for the first time (0% for the PEV, from 7% to 15.4% for PCP). The two deputies of The Greens (PEV) were always elected 4 or more times. The same image we get from PCP, where 42.9% in 2011 to 53.9% in 2009 of its deputies were veterans (four or more times). In the other hand the BE, in the 12th legislature, when it lost half of its power, had 0% of newcomers. But in 2009 the 37.5% (6 out of 16) of his deputies were elected for the first time, and in 2015 this percentage reached the highest of 52.6% (10 out of 19), with the increase of parliamentary seats. We must also mention that not a single woman was elected 4 or more times with BE or PCP. Only three of BE´s deputies, a 15.8%, were elected in all three legislatures. This percentage was much higher for PCP (66.7%) and PEV (100%).
Table 6
Number of terms in office for MPs by political party (%)
Legislatures Parties 11th 12th 13th PSD PS BE PCP-PEV CDS-PP PSD PS BE PCP-PEV CDS-PP PSD PS BE PCP CDS-PP First Time 46.9 33 37.5 13.3 38.1 41.7 18.9 0 6.2 16.7 32.6 41.9 52.6 11.9 27.7 Two Times 9.9 28.9 37.5 26.7 19.1 26.9 21.6 37.5 18.8 33.3 34.8 14 31.6 17.6 16.7 Three Times 14.8 6.1 12.5 6,7 23.7 8.3 27 37.5 25 12.5 16.9 14 10.5 17.6 16.7 Four or more times 28.4 32 12.5 53.3 19.1 23.1 32.5 25 50 37.5 15.7 30.1 5.3 52.9 38.9 Source: Biographical data of the website of the Portuguese Parliament (own elaboration).
2.2 Previous held positions by MPs
In a total accounting of the three legislatures a large majority of them had previous experience as a deputy in the Republic. Most of the MPs were elected for two or more times to the Parliament, and almost one third of them in all three legislatures were previously members of the local government (either in municipal government
bodies)13. Our research leads us to conclude that an expressive number served in higher local public offices
before becoming MPs. A range between 52.5% (in 2009) to 76.6% (in 2015) were also presidents of their local government, municipal councilors (vereadores) or administration officials. Smaller percentages held high positions in their political parties, ranging from 10.6% of PCP-PEV to 44,4% of CDS-PP. A percentage of
19.7-44.4%14 were previously ministers or secretaries of the State and a few (4%) were members of the European
Parliament. The rest of them, which did not participate in any of the previous categories, were the ones with no important political, economic or party position in the past. These are in some way the ‘outsiders’. Their numbers were always higher for the women deputies, even 2.5 bigger than men in 2011, when a 10.4% of men deputies were ‘outsiders’ compared to a 26.9% of the women deputies. Still, compared with the deputies of the Portuguese First Republic (1910-1926), when 80% of them did not hold a political office in the past (ALMEIDA, 2012, p. 50), the deputies nowadays are more experienced, professionalized and with training or raising required qualifications.
Only 24.8% in 2009, 17% in 2011 and 21.7% in 2015 of them had no previous experience, not considering the ones that previously were only managers in companies or only held a high position in their political party. So, our conclusion must be the opposite from the one extracted from the study of the First Republic. It seems that to be a deputy is not anymore a starting point for a political career. This role is probably played nowadays by the local governments (municipal power), which prepare the next deputies of the Republic.
At the same time, in an analysis of the previously held positions and political parties we can conclude that there are some political asymmetries. In the following table we consider, in a general framework, the distinction between the previous positions of the MPs.
13 In order to examine the previously held positions and activities of the MPs, we regard to all individual cursus honorum and placed it in the prosopo-graphical database.
Table 7
Previous positions of MPs (11th to 13th Assemblies of Republic)15
11th legislature Former members of the Assembly of the Republic Former Ministers or
Secretary of State Local Government16
High positions in
their political party University Professors
n % n % n % n % n % PSD 43 53 16 19.7 37 45 11 13.5 14 17.8 PS 65 67 11 11.3 51 52.5 18 18.5 16 16.4 CDS-PP 13 61.9 4 19.1 6 14.2 8 38.0 7 33.3 PCP-PEV 11 86.7 0 0 8 73 3 15.3 1 7.69 BE 10 62.5 0 0 1 12.5 2 12.5 5 31.2 12th legislature Former members of the Assembly of the Republic Former Ministers or
Secretary of State Local Government16
High positions in
their political party University Professors
n % n % n % n % n % PSD 63 58.3 11 10.1 54 49.9 14 12.9 18 16.6 PS 60 81.1 11 14.8 41 55.3 15 20.2 14 18.9 CDS-PP 20 83.3 4 16.6 8 33.3 8 33.3 7 29.1 PCP-PEV 15 88 0 0 11 82.1 10 10.6 2 14.2 BE 8 100 0 0 0 0 1 12.5 1 12.5 13th legislature Former members of the Assembly of the Republic Former Ministers or
Secretary of State Local Government16 High positions in their political party University Professors
n % n % n % n % n % PSD 65 73 19 21.3 54 60.5 13 14.6 18 20.2 PS 45 52.3 13 15.1 39 22.6 17 19.7 13 15 CDS-PP 13 72.2 8 44.4 7 19.4 8 44.4 6 33.3 PCP-PEV 15 93.3 0 0 10 76.6 2 28.3 2 13.3 BE 9 47.3 0 0 5 26.3 3 15.7 5 26.3
Source: Biographical data of the website of the Portuguese Parliament (own elaboration).
As for political parties and starting the PSD: more than half of its deputies were previously in the Parliament (53%, 58.3% and 73%) and more than one third of them were in the local government (45%, 49.9% and 60.5%). Ex-ministers were also likely to be re-elected as deputies, especially in the elections of 2009, when the percentage
15 All the values are relative to each party and for the main categories of the social background. 16 Presidents, municipal councilors (vereadores) and administration officials.
raised up to 19.7%. The ‘outsider’ MPs were the 27.2% in 2009, 24.1% in 2011 and fell to 12.4% in 2015 of the total number of PSD MPs in each legislature. The women deputies were always more likely to be an ‘outsider’, with percentages (of the total women deputies of the party) from 45.5% in 2009 to 41.9% in 2011 and 21.9% in 2015.
The PS also had high percentages of deputies that had already been elected in Parliament in the past (67%, 81.1% and 52.3%). In 2011, only a 13.5% had no previous political experience, while a 55.3% was part of local government. In 2015 this number falls to 22.6%, but in the other hand there is a significant number, 52.3% of deputies that were previously ministers or secretaries of the State.
As for CDS-PP, in the elections of 2009 and 2015 28% of its MPs had no previous political experience, a percentage which fell to only 12.5% in 2011. A large majority of CDS-PP MPs were previously elected in Parliament (61.9%, 83.3% and 72.2%, 11th, 12th and 13th legislatures, respectively). Some of them came from local government (14.2%, 33.3% and 19.4%) or were previously ministers (19.1%, 16.6% and 44.4%).
Finally, in the left parties, most of the deputies had previous political experience, namely as ex-deputies in the Constitutional Assembly or in the local government. None of them though were president in a local government,
former minister or member of the European Parliament. To particularize, in BE 62.5% in 2009 and 47.3% in 2015
had previous political experience. In the elections of 2011, when BE elected only 8 deputies all of them had been members of the parliament in the past. In 2009 and 2011 though only one and zero deputies were part of the local government, but that changed in 2015, with 5 out of the 19 (26.3%) being elected in the municipal assemblies.
Almost the same image applies for the coalition between PCP and PEV. Most of the MPs were previously elected in Parliament (86.7%, 88% and 93.3%), or in local government (73%, 82.1% and 76.6%). That leaves us with only one deputy (6.7%) in 2009, none in 2011 and two (11.8%) in 2015 with no previous experience.
A final note on the parliamentary distribution of university professors. The range In the 11th legislature a
range of 33.3% to CDS-PP and 7.69% to PCP-PEV. The same advantage remains in the 12th and 13th legislatures, where the CDS-PP is the party with the largest number of high schooling deputies, followed by BE with 31.2%, 12.5% and 26.3%.
2.3 Abandon position as deputy or premature exit of MPs
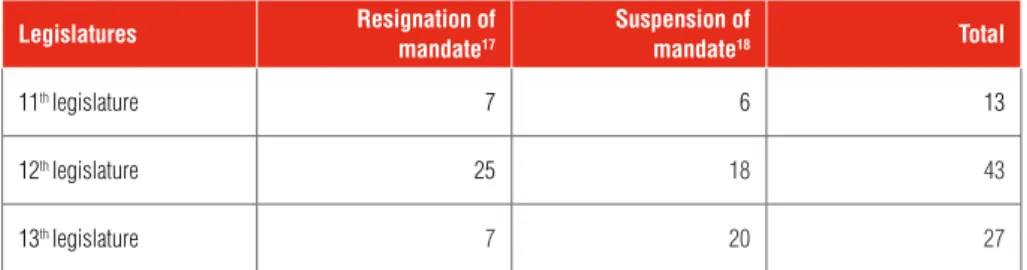
There are big differences in the numbers of deputies that abandoned their position for various reasons in the three
legislatures. During the 20 months of the 11th legislature only 13 deputies (7%) abandon their position, seven
of them resigned to the mandate (four from PS and one for each of PSD, BE and PCP) and six suspended their election (five from PS and one from PSD).
We are getting a completely different image from the 12th legislature, where there was a bigger number
of premature exit of MPs: 25 resigned to the office (11 from PSD, 6 from PS, 3 for each of BE and PCP and 2
CDS-PP) and 18 suspended their election (11 for PSD, 6 from CDS-PP and 1 from PCP). In the 13th legislature
(until nowadays), a smaller number of deputies resigned: 7 (5 from PS and 1 for each of BE and CDS-PP) and 20
suspended their mandate (19 from PS and 1 from BE). Even though the number is more than double of the 11th
legislature. That can be due to the fact that both legislatures were longer than the last legislature and the number of the governments formed is bigger, therefore the number of premature exits is increased.
Table 8
Premature exit of MPs
Legislatures Resignation of mandate17 Suspension of mandate18 Total
11th legislature 7 6 13
12th legislature 25 18 43
13th legislature 7 20 27
Source: Biographical data of the website of the Portuguese Parliament (own elaboration).
We can compare also with the percentages of premature exits of the French Fifth Republic (13%, from which 8% due to appointment in cabinet or mission and 2% due to resignation or dismissal) and with the 12th legislature
of 2002 (11.4%), which is the last one for which we have details (FRANÇOIS; GROSSMAN, 2011, p. 377).
Graph 5
Abandon position as MP (%)
Source: Biographical data of the website of the Portuguese Parliament (own elaboration).
17 According to Article 7 of the Estatutos dos Deputados, the deputies may resign of mandate by written a personally declaration submitted to the Presi-dent of the Assembly of the Republic and this is irreversible.
18 In Articles 4, 5 and 6 of the Estatutos dos Deputados, the suspension may be required for legitimate reasons: illness, maternity or paternity leave and criminal prosecution.
Ending balance
The prosopographical analysis of the Portuguese MPs in the last three legislatures induced some conclusive ideas, from two complementary points of view: socio-demographic and political.
The average age of majority of Portuguese MPs, around 60%, is between 40 and 60 years old. A large number of deputies have long careers, being elected more than three or four times (40% to 46.6% of them). The right party (CDS-PP) is the one with the youngest members. The centre-right (PSD) has a tendency to increase the average age, over the three legislatures; but the center-left (PS) has the higher average age. Curiously, the PCP-PEV (left party) is the most stable. This stability providing a higher degree of professionalization in Portuguese parliamentary groups.
Looking for gender representation, all the right parties increased the women deputies in the last legislature. In this respect, stability is represented by PS (centre-left), but the parties of the radical left emphasize asymmetries: PCP-PEV the one that has greater increase of feminine representation, and BE is the one that most swings. A large majority of Portuguese MPs are graduates (bachelors and license degrees), either men or women, namely in social sciences and law. The center parties (PS and PSD) have the highest percentage of graduates. The majority of parliamentarians are graduated in social sciences, even some parties (CDS-PP and PDS) have a majority of deputies with law degrees. Most of the economists and managers occupy seats in the stands of the PS, PSD and CDS-PP (the first two are parties with more parliamentary seats), but there are significant presence of professors in the Portuguese Legislative Assembly. Most of the MPs, during the three legislatures, develops activity as lawyer, secondly are economists, advisors of companies, in last places the university professors and teachers from schools. For the whole, the higher education seems to constitute indispensable to the professionalization on polity.
As for the political profile, a majority of the deputies were elected more than one time. Even so, the number of the first elected MPs is bigger than other categories. For the relation between number of terms and parties, the PSD and the CDS-PP, the right political forces, are the parties that present a higher tendency, in the three legislatures, for a renewal of the parliamentary group. For contrasts the PS's parliamentary group is more stable compared to the right-wing parties. In this case, most of the MPs had long careers (four times) in the constitutional assembly, represented 32% (11th legislature), 32.5% (12th legislature and 30.1% (13th legislature). In the left parties, the PCP-PEV is the most stable of all parliamentary groups, and in the opposite the BE is least stable of all; due to the loss of parliamentary seats in the 12th legislature and the huge increase in the 13th parliamentary term. In the early exit from parliamentary seats there are big differences between the three legislatures. In fact, the resignation and suspension of mandate in parliament is much higher in the last two legislatures (12th and 13th), mainly because of the short duration of the 11th legislature.
It is time to conclude, the socio-demographic and political portrait and description of Portuguese constitutional assembly, since 2009 to the present, it’s made.
Sources
Portugal. Comissão Nacional de Eleições. Available on: < www.cne.pt>. Portugal. XXI Governo Constitucional. Available on: <www.portugal.gov.pt>.
References
ALMEIDA, M. A., 2008 – Party Politics in Portugal: Municipalities and Central Government. European Societies. 10 (3), p. 357-378.
ALMEIDA, Pedro Tavares de, 2010 – Portugal, in D. Nohlen; P. Stöver (Eds.) – Elections in Europe: A Data
Handbook. Baden-Baden: Nomos Verlag, p. 1525-1577.
ALMEIDA, Pedro Tavares de, 2012 – The MPs of the First Portuguese Republic, 1911-1926: A Prosopographic
Study. Berkeley: Institute of International Studies.
ALMEIDA, Pedro Tavares de; FREIRE, André, 2005 – Two Overwhelming Victories of the Portuguese Left: The 2004 European Election and the 2005 Legislative Election. South European Society and Politics. 10 (3), p. 451-464. ALMEIDA, Pedro Tavares de; PINTO, António Costa, 2003 – Portuguese Ministers, 1851-1999: Social Background and Paths to Power, in P. T. de Almeida; A. C. Pinto; N. Bermeo (Eds.) – Who Governs Southern Europe? Regime
Change and Ministerial Recruitment, 1850–2000. London: Routledge, p. 5-40.
BARTON, Cassie; AUDICKAS, Lukas, 2016 – Social background of MPs 1979-2017. House of Commons Library. Nº CBP 7483, 28 September, p.1-12.
BELCHIOR, Ana Maria, 2010 – Party Democracy and Party Representation: an Assessment of Post-Materialist Forecasts, CIES e-Working Paper N.º 88/2010, p. 1-24.
BEST, Heinrich; COTTA, Maurizio (Eds.), 2000 – Parliamentary representatives in Europe 1848-2000. Legislative
Recruitment and Careers in Eleven European Countries. Oxford: Oxford University Press.
BOURDIEU, Pierre, 1984 – Distinction: A Social Critique of the Judgement of Taste. Cambridge: Harvard University Press.
BULST, Neithard; GENET, Jean-Philippe (Eds.) 1986 – Medieval lives and the Historian. Studies in Medieval
Prosopography. Medieval Institute Publications.
CAMACHO-AVILA, Beatriz, 2018 – Del estilo a la dirección: la representaion política en el congresso de los Diputados. Revista Española de Investigaciones Sociológicas. 162, junio, p. 129-140.
DI VIRGILIO, A.; GIANNETTI, D.; PEDRAZZANI, A.; PINTO, L., 2015 – Party Competition in the 2013 Italian Elections: Evidence from an Expert Survey. Government and Opposition. 50 (1), p. 65-89.
DOMHOFF, G. William, 2012 – How to do power structure research. Available on: <https://whorulesamerica.ucsc. edu/methods/how_to_do_power_structure_research.html>.
DOMHOFF, G. William (Ed.), 1980 – Power structure research. London: Sage Publications.
Estatutos dos Deputados. Available in: <http://www.parlamento.pt/legislacao/documents/legislacao_anotada/ estatutodeputados_simples.pdf>.
FEDELI, Silvia; FORTE, Francesco; LEONIDA, Leonne, 2014 – The law of survival of the political class: An Analysis of the Italian parliament (1946-2013). European Journal of Political Economy. 35, September, p. 102-121. FOSSEY, John M., 1995 – The Study of Ancient Greek Prosopography. London: Ares Pub.
FRANÇOIS, Abel; GROSSMAN, Emiliano, 2011 – Who are the deputies of the Fifth Republic? Some figures.
French Politics. 9, p. 364-380.
FREIRE, André; LISI, Marco; ANDREADIS, Ioannis; VIEGAS, José Manuel L., 2014 – Political representation in bailed-out Sbailed-outhern Europe: Greece and Portugal compared. Sbailed-outh European Society and Politics. 19(4), p. 413-433. FREIRE, André; LISI, Marco; VIEGAS, José Manuel L. (Orgs.), 2014 – Crise económica, políticas de austeridade
e representação política. Lisboa: Assembleia da República.
FREIRE, André; LISI, Marco; VIEGAS, José, 2015 – Eleições, Liderança e responsabilização: a Representação
Política em Portugal, uma perspetiva longitudinal e comparativa. Available in: <http://www.cne.pt/sites/default/ files/dl/newsletter/2015/17/newsletter_cne_28_7_2015_projeto_eleicoes_lideranca_responsabilizacao.pdf>. FREIRE, André; TEPEROGLOU, Eftichia; MOURY, Catherine, 2014 – Awakening the Sleeping Giant in Greece and Portugal? Elites' and Voters' Attitudes towards EU Integration in Difficult Economic Times. South European
Society and Politics. 19(4), p. 477-499.
Inter-Parliamentary Union (IPU) 2016a – Women in Parliament in 2015. The year in review. Geneva, p. 1-12. Inter-Parliamentary Union (IPU) 2016b – Youth participation in national parliaments 2016. Geneva, p. 1-36. Inter-Parliamentary Union (IPU), 2010 – Women in Parliament in 2009. The Year in Perspective. Geneva, p.1-6. Inter-Parliamentary Union (IPU), 2011 – Women in Parliament in 2011. The Year in Perspective. Geneva, p. 1-8. Inter-Parliamentary Union (IPU), 2015 – Youth participation in national parliaments 2016. Geneva, p. 1-2.
JEREZ, Miguel; LINZ, Juan J.; REAL-DATO, José, 2012 – Los diputados en la nueva democracia española, 1977-2011: pautas de continuidad y cambio, in José Ramón Montero; Jeff Miley (Eds.) – Partidos y elites
políticas en España. Madrid: Centro de Estúdios Políticos y Constitucionales, vol. 6, p. 807-887.
LISI, Marco, 2015 – Party Change, Recent Democracies and Portugal. Comparative Perspectives. Laham, MD: Lexington Books.
MAGALHÃES, P., 2011 – Elections, Parties and Policy-Making Institutions, in A. C. Pinto (Ed.) – Contemporary
Portugal. New York: SSM–Columbia University Press, p. 222-247.
MAGONE, José M., 2000 – Political Recruitment and Elite Transformation in Modern Portugal 1870-1999: The Late Arrival of Mass Representation, in Heinrich Best; Maurizio Cotta (Eds.), 2000 – Parliamentary representatives
in Europe 1848-2000. Legislative Recruitment and Careers in Eleven European Countries. Oxford University
Press, p. 341-370.
MAGONE, José M., 2004 – The developing place of Portugal in the European Union, New Brunswick: Transaction Publishers.
MOSCA, Gaetano 1939 [1896] – The Ruling Class. New York: McGraw Hill.
PARETO, Vilfredo 1991 [1901] – The rise and fall of the elites. An application of theoretical sociology. New Jersey: Transaction Publishers.
PINTO, A. Costa; ALMEIDA, Pedro Tavares de, 2017 – The Primacy of Experts? Non-partisan Ministers in Portuguese Democracy, in A. Costa Pinto; M. Cotta; P. Tavares de Almeida (Eds) – Technocratic Ministers and
Political Leadership in European Democracies. U.K: Palgrave, p. 111-137.
PINTO, António Costa; ALMEIDA, Pedro Tavares de, 2009 – Portugal: The Primacy of “Independents”, in K. Dowding; P. Dumont (Eds.) – The Selection of Ministers in Europe: Hiring and Firing. London: Routledge, p. 147-158.
PITKIN, Hannah F., 1967 – The concept of representation. Berkeley, Los Angeles: University of California Press.
PRAUD, Jocelyne; DAUPHIN, Sandrine, 2010 – Parity Democracy: Women's Political Representation in Fifth
Republic France. Toronto: UBC Press.
RIVIÈRE-DE FRANCO, Karine, 2014 – The Parliamentary Behavior of Women and Men MPs: Equal Status, Similar Practices?Revue LISA/LISA e-journal. XII (7). Available in: <http://journals.openedition.org/lisa/6877>.
SIMÓN, Pablo; VERGE, Tània, 2017 – Gender Quotas and Political Representation in Spain and Portugal: Elec-toral Competition, Learning and Emulation. Journal of South European Society and Politics. 22 (2), p. 179-195. TEPEROGLOU, Eftichia; ANDREADIS, Ioannis, 2012 – Investigating consensus versus conflict between the Greek and Portuguese political elites during the economic crisis: a matter of ideology?, in Plenary Conference of the
CCS. The Comparative Analysis of Political Attitudes and Behaviors of Candidates Standing for Office in National Parliament Elections. MZES, University of Mannheim, 27-29 January.
TRUJILLO, José Manuel; PÉREZ, Sergio, s.d. – Legislative Candidate Quotas in Spain: Implementation and Effectiveness in Spanish Elections. International Politic Science Association. Gender Politics and Policy. Available on: <http://paperroom.ipsa.org/papers/paper_17901.pdf>.
TSATSANIS, Emmanouil, FREIRE, André; TSIRBAS, Yannis, 2014 – The Impact of the Economic Crisis on the Ideological in Portugal and Greece: A Comparison of Elites and Voters. South European Society and Politics. 19 (4), p.519-540.
VERGARA, Luis Garrido, 2013 – Elites, political elites and social change in modern societies. Revista de Sociología. 28, p. 31-49.
VERGE, Tânia, 2012 – Institutionalizing Gender Equality in Spain: From Party Quotas to Electoral Gender Quotas.