Within-person variance of the
energy and nutrient intake in
adolescents: data adjustment in
epidemiological studies
Variância intrapessoal da ingestão
de energia e nutrientes em
adolescentes: correção de dados em
estudos epidemiológicos
Eliseu Verly Junior
IChester Luis Galvão Cesar
IRegina Mara Fisberg
IIIDirce Maria Lobo Marchioni
IIII Department of Epidemiology, Institute of Social Medicine, Rio de Janeiro State
University (UERJ).
II Department of Epidemiology, School of Public Health, University of São Paulo
(USP).
III Department of Nutrition, School of Public Health, University of São Paulo
(USP).
This research project was funded by FAPESP (State of São Paulo Research Support Foundation) – process 07/51489-9.
Corresponding author: Eliseu Verly Jr. Department of Epidemiology, Institute of Social Medi-cine, Rio de Janeiro State University. Rua São Francisco Xavier 524, Maracanã, Rio de Janeiro-RJ, 20550-900. E-mail: verlyjr@ims.uerj.br
Abstract
Objective: The aim of this paper is to cal-culate within-person variance component of the energy and nutrient intake that can be useful to adjust intake distribution from adolescents when is available only a single 24-hour recall for each participant. It will also give an example of its use in the intake distribution adjustment in adolescents from
another sample. Methods: It was used 24
hour recall from 215 adolescents living in São Paulo, Brazil. The variance components were estimated using the Software for Intake Distribution Estimation (PC-SIDE). It was made a model for each nutrient and sex of which were included covariates for day and month of intake and weight variable as well.
Results: The within-person variance com-ponent ranged from 0.55 for mono saturated fat (female) up to 0.96 for folate (male). I was found higher values regarding to macronu-trient and energy for males. In the example of the use of the variance component, it was estimated the distribution of intake of vitamin B6 with less bias, when compared to the distribution with no adjustment.
Conclusion: These results can be used to es-timate habitual energy and nutrient intake for adolescent population when it is only a single dietary measurement.
Resumo
Objetivo: Este artigo objetiva fornecer valores de componentes de variância intra-pessoal da ingestão de energia e nutrientes que possibilita estimar a ingestão habitual em adolescentes, em inquéritos dietéticos quando há disponível somente um recor-datório de 24 horas para cada indivíduo. Também será fornecido um exemplo de sua aplicação na correção da distribuição da ingestão de nutrientes proveniente de
adolescentes de outro estudo. Métodos:
Foram utilizados recordatórios de 24 horas de 215 adolescentes do município de São Paulo. Os componentes de variância foram
estimados utilizando o Software for Intake
Distribution Estimation (PC-SIDE). Para cada nutriente foi construído um modelo, estratificado por sexo, que inclui o dia e o mês da coleta, e variáveis de ponderação.
Resultados: Os componentes de variância intrapessoal variaram de 0,55 para gordura mono-saturada (sexo feminino) a 0,96 para o folato (sexo masculino). Entre os macro-nutrientes e energia foram observados va-lores mais elevados para o sexo masculino. No exemplo da aplicação do componente de variância, foi estimada a distribuição da ingestão de vitamina B6 com menos viés comparada à distribuição sem a correção.
Conclusão: Estes dados podem ser utiliza-dos na estimativa da ingestão habitual de energia e nutrientes e cálculo da prevalência de inadequação em adolescentes de popu-lações semelhantes, quando há disponível somente um recordatório de 24 horas para cada indivíduo do estudo.
Palavras-chave: Nutrientes. Adolescente. Inquérito sobre dietas. Avaliação nutricio-nal. Consumo de energia. Métodos.
Introduction
Studies on the prevalence of inadequate nutrient intake are informative for public health, providing useful data for nutrition diagnosis and for the establishment and
monitoring of public policies in nutrition1.
The use of dietary surveys such as the 24-hour dietary recalls (24hR) and food records are recommended to collect the data on nutrient intake required to calculate inadequate intake. This is because these surveys identify food consumption with more details about servings and forms of
preparation of such foods1. However, when
applied to one or few days, these instru-ments fail to identify the daily variations in consumption. Consequently, the intake distribution becomes flatter and wider, having a direct effect on the analysis and interpretation of results. One example is the under- or over-estimation of the propor-tion of individuals below or above a given
criterion of adequacy2. The effect of daily
variation is reduced with the increase in the number of 24hR applied to each individual
in the study population3. However, in
epide-miological studies, collecting multiple 24hR is not usually possible, because of the costs and individuals’ availability to report their consumption in detail on several occasions. One alternative is the use of statisti-cal methods to correct data according to
within-person variability in consumption4.
Ideally, this adjustment is made when there is at least one repetition of the dietary survey in at least one representative sub-sample of the study population. When only one 24hR is applied to each participant, the adjust-ment of intake distribution is possible with the use of external within-person variance, provided that it is obtained from a similar
population. This strategy is recommended5,6
and it has been used in the adjustment of nutrient intake distribution among
adoles-cents of the city of São Paulo7.
and elderly population exclusively8. The
present study aimed: 1) to make available within-person variance components to cor-rect the nutrient intake distribution among adolescents; and 2) to provide an example of its application in the adjustment of nutri-ent intake distribution in adolescnutri-ents from another study.
Methods
Study population
Data from the Inquérito de Saúde de
São Paulo (ISA-Capital – City of São Paulo Health Survey) were used to estimate within-person variance in nutrient intake. This is a population-based cross-sectional study which is routinely conducted in the city of São Paulo. A complex, stratified, cluster sampling process was used and its details were obtained from another
publica-tion9. In the 2003ISA-Capital, a total of 813
adolescents were interviewed. They were subsequently invited to participate in the present study, in 2007. Of all participants, 314 remained in the 14-to-18-year age group; of these, 3% (n = 9) refused to partici-pate, 15% (n = 46) changed their address and could not be located, and 14% (n = 44) could not be found at home, even after three visits made at different times and on different weekdays. This age group is in agreement with what is proposed by the Institute of Medicine as one of the stages of adolescence for which nutrient intake recommendations have been established. The final sample was comprised of 215 adolescents, of which 112 were males and 103 were females.
A sample of male adolescents, who participated in the ISA collected between 2008 and 2009 and who responded to two 24hR (n = 102), was used in the adjustment of nutrient intake distribution to illustrate the effect of application of within-person variance components, obtained from the present study. The 2008 ISA complex sam-pling process was similar to that of the 2003 ISA and its details can be found in another publication10.
Data collection
Interviews were conducted in the ho-mes of the participants by previously trai-ned interviewers, between 2007 and 2008. Food consumption was collected with the
24hR, using the multiple-pass method11.
All adolescents (n = 215) were invited to respond to a new 24hR, after an interval of nearly two months, so that the within--person variance in consumption could be calculated. This collection was conducted by telephone and the response rate was 65% (n = 73) and 70% (n = 73) for males and females, respectively. Both collections (at home and by telephone) were performed in a way that covered all weekdays and months of the year. Before data on food consumption were input, the information contained in each of the collections was checked, aiming to monitor the quality of the interviews and to define a standard for the amounts of foods and recipes of preparations reported.
Data analysis
The reported consumption was con-verted into values of energy and nu-trients using the Nutrition Data System for Research software (NDS, 2007 version, Nutrition Coordinating Center, University of Minnesota, Minneapolis, USA). Mandatory fortification of wheat and corn flours, effec-tive in Brazil since 2004, was considered for iron and folic acid.
Within-person variance components of the distribution of intake of energy and macro- and micro-nutrients were calculated with the method developed by the Iowa
State University (ISU)3, using the Intake
variance using an error measurement model.
A model was developed for each nu-trient, in which the collection day and month and weighting variables (primary sampling unit, stratum and sampling wei-ght) were included. Data were analyzed separately by sex. Descriptive measures of consumption (mean, standard deviation, standard error and percentiles) and within- and between-person variance components were generated for each nutrient. Another parameter required in the adjustment of dietary data, the fourth moment, a measure that refers to the flatness of distribution (kurtosis), was also calculated.
Application of variance components
Using the ISU method, the distribution of B6 vitamin intake, exclusively based on the first 24hR responded by each adoles-cent, was corrected with the within-person variance component and the fourth moment of distribution obtained in the present study, regarding the male sex. Distributions were estimated in two different ways to verify the effect of adjustment: using only the first 24hR for each adolescent without any adjust-ments; and using the within-person variance component obtained by repeating the collec-tion in the sample itself. A frequency density graph was constructed and the mean, stan-dard deviation, percentiles of consumption and prevalence of inadequate intake, i.e. the proportion of individuals with an intake lo-wer than the estimated mean requirements,
were calculated for each distribution1.
Results
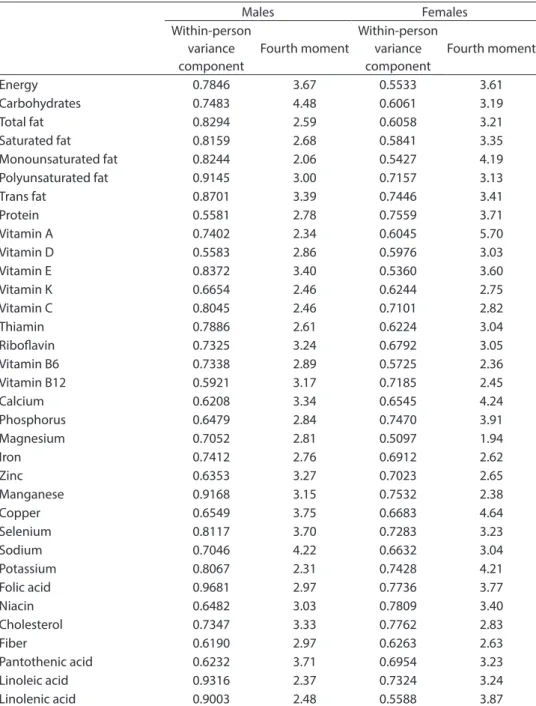
A total of 16% of adolescents were overweight, 67% drank alcohol, 11% smoked and 87% belonged to households whose head had completed up to eight years of school. There were no differences between sexes for these variables. Table 1 shows the within-person variance components and the fourth moment of energy and nutrient intake distribution in males and females.
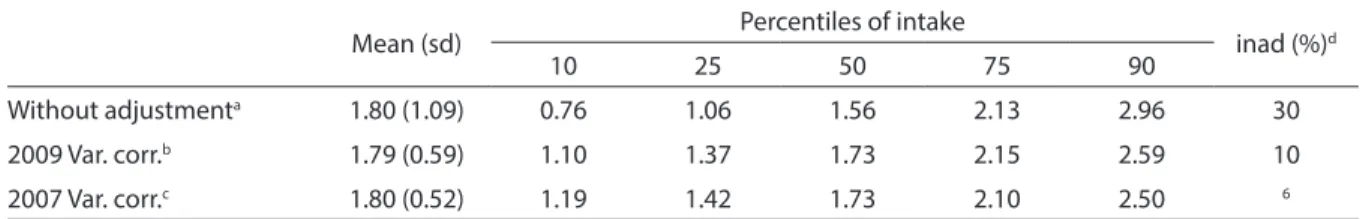
Table 2 shows the mean, standard devia-tion, percentiles of consumption and pre-valence of inadequate vitamin B6 intake in the sample of male adolescents, calculated from the distribution without adjustment, adjusted by the within-person variance (calculated from the sample) and by the ex-ternal variance. The effect of the adjustment with external variance is notable, when compared to the distribution corrected with the within-person variance itself. Standard deviations and percentiles of consumption were similar, as were the prevalences of inadequate intake estimated, 6% and 10% respectively; both substantially lower than the level of inadequacy found when only one 24hR was used (30%). The estimated distributions are shown in Figure 1.
Discussion
The present study revealed components of within-person variance in energy and nutrient intake obtained from a sample of adolescents in the city of São Paulo. These data can be used to estimate the usual ener-gy and nutrient intake in a similar popula-tion, when there is only one 24hR available for each study participant.
The effect of adjustment with within--person variability in consumption is nota-ble, as shown in Figure 1 and well described
in the literature4. Using external variance,
a percentage of adolescents with a level of consumption lower than the recommenda-tions could be obtained, comparable to that obtained when corrected with the within--person variability of the sample itself. Both totaled approximately 1/3 of this percentage when only one 24hR was used. A sample of adolescents similar to that used to calculate within-person variance components was used in the example. Theoretically, its use in a sample with distinct characteristics (for example, adolescents from other cities) could lead to bias in the results. This ques-tion was discussed in the study conducted
by Jahns et al. (2005)5, who compared the
using variance components from two stu-dies, one American and the other Russian. The authors concluded that the use of exter-nal variance should be recommended, even when it is not the same population, as the worst case scenario is the distribution being obtained from only one 24hR.
Data adjustment with external variance components includes a series of statistical procedures, rendering it impractical without the support of the PC-SIDE software. This software is not free of charge. However, the World Health Organization (WHO) is deve-loping a public domain software based on
Table 1 – Within-person component variance and forth moment of the energy and nutrient intake distribution in adolescents. São Paulo, 2007-2008.
Tabela 1 – Componentes de variância intrapessoal e quarto momento da distribuição da ingestão de energia e nutrientes entre adolescentes. São Paulo, 2007-2008.
Males Females
Within-person variance component
Fourth moment
Within-person variance component
Fourth moment
Energy 0.7846 3.67 0.5533 3.61
Carbohydrates 0.7483 4.48 0.6061 3.19
Total fat 0.8294 2.59 0.6058 3.21
Saturated fat 0.8159 2.68 0.5841 3.35
Monounsaturated fat 0.8244 2.06 0.5427 4.19
Polyunsaturated fat 0.9145 3.00 0.7157 3.13
Trans fat 0.8701 3.39 0.7446 3.41
Protein 0.5581 2.78 0.7559 3.71
Vitamin A 0.7402 2.34 0.6045 5.70
Vitamin D 0.5583 2.86 0.5976 3.03
Vitamin E 0.8372 3.40 0.5360 3.60
Vitamin K 0.6654 2.46 0.6244 2.75
Vitamin C 0.8045 2.46 0.7101 2.82
Thiamin 0.7886 2.61 0.6224 3.04
Ribolavin 0.7325 3.24 0.6792 3.05
Vitamin B6 0.7338 2.89 0.5725 2.36
Vitamin B12 0.5921 3.17 0.7185 2.45
Calcium 0.6208 3.34 0.6545 4.24
Phosphorus 0.6479 2.84 0.7470 3.91
Magnesium 0.7052 2.81 0.5097 1.94
Iron 0.7412 2.76 0.6912 2.62
Zinc 0.6353 3.27 0.7023 2.65
Manganese 0.9168 3.15 0.7532 2.38
Copper 0.6549 3.75 0.6683 4.64
Selenium 0.8117 3.70 0.7283 3.23
Sodium 0.7046 4.22 0.6632 3.04
Potassium 0.8067 2.31 0.7428 4.21
Folic acid 0.9681 2.97 0.7736 3.77
Niacin 0.6482 3.03 0.7809 3.40
Cholesterol 0.7347 3.33 0.7762 2.83
Fiber 0.6190 2.97 0.6263 2.63
Pantothenic acid 0.6232 3.71 0.6954 3.23
Linoleic acid 0.9316 2.37 0.7324 3.24
the same methodology. Among other pur-poses, it enables the adjustment of nutrient intake distribution using external variance
components. The development of this sof-tware is part of the WHO Intake, Monitoring, Assessment and Planning Program (IMAPP),
Table 2 – Mean, standard deviation, percentiles of intake and prevalence of inadequate intake of vitamin B6 among male adolescents. São Paulo, 2008-2009.
Tabela 2 – Média, desvio padrão (dp), percentis de consumo e prevalência de inadequação da ingestão de vitamina B6 entre adolescentes do sexo masculino. São Paulo, 2008-2009.
Mean (sd) Percentiles of intake inad (%)d
10 25 50 75 90
Without adjustmenta 1.80 (1.09) 0.76 1.06 1.56 2.13 2.96 30
2009 Var. corr.b 1.79 (0.59) 1.10 1.37 1.73 2.15 2.59 10
2007 Var. corr.c 1.80 (0.52) 1.19 1.42 1.73 2.10 2.50 6
a based on only a single 24-hour recall for each participant;
b distribution adjusted for the within-person variance from the replicate of the 24-hour recall in the same sample; c distribution based on only a single 24-hour recall but adjusted for the external within-person variance; d prevalence of inadequate nutrient intake.
a utilizando-se apenas o primeiro recordatório de 24 horas para cada participante;
b distribuição corrigida pela variância intrapessoal obtida da repetição do inquérito na própria amostra;
c distribuição utilizando primeiro recordatório de 24 horas para cada participante, corrigida pela variância externa;
d prevalência de inadequação da ingestão.
a utilizando-se apenas o primeiro recordatório de 24 horas para cada participante;
b distribuição corrigida pela variância intrapessoal obtida da repetição do inquérito na própria amostra; c distribuição utilizando primeiro recordatório de 24 horas para cada participante, corrigida pela variância externa;
a based on only a single 24-hour recall for each participant;
b distribution adjusted for the within-person variance from the replicate of the 24-hour recall in the same sample;
c distribution based on only a single 24-hour recall but adjusted for the external within-person variance
Figure 1 – Distribution of intake of vitamin B6 among male adolescents. São Paulo, 2008-2009. Figura 1 – Distribuição da ingestão de vitamina B6 entre adolescentes do sexo masculino. São Paulo, 2008-2009.
whose detailed document is available on the Internet*.
The within-person variance component represents the percentage of total variance explained by the daily variation in all indi-viduals of a certain population. The higher the value, the greater the variation in the amount of a nutrient consumed between one day and the next. This component has been described as the main source of variation in
nutrient intake9 and it varies according to
the population, age group and sex studied. The difference between sexes is clearer with regard to energy and macronutrients. Among males, high within-person varian-ce components were observed for energy, carbohydrates and lipids, whereas those for proteins were low. Among females, the opposite was found: lower values for energy, carbohydrates and lipids and higher values for protein. This suggests that the energy intake is more stable among girls, while it shows greater variation between one day and the next among boys.
The ISU method and other methods available generate percentiles of habitual intake distribution for groups of individuals, rather than habitual intake values for each individual in the sample. This restricts the forms of analyses that associate the habitual intake estimated with multiple covariables. Tests of mean differences and proportion
can be calculated by estimating a distribu-tion for each category of the group expected to be compared. As an example, one could test whether men and women differ statis-tically in terms of their intake of a certain nutrient. First of all, the habitual intake for each sex is estimated. The t-test is then calculated using mean values and standard deviation estimated for each group.
The sample used in the present study was based on a representative sample of the population of adolescents of the city of São Paulo. However, due to the great number of individuals who became adults between the time of the random selection of the initial sample in 2003 and the return to their ho-mes for a new data collection in 2007, this sample may have lost its representativeness. Nonetheless, of all 59 census tracts used in the initial sample, 53 remained in it, thus representing the several regions of the city of São Paulo in the same way. Additionally, there were no statistical differences between the strata (according to the percentage of heads of household with higher education) obtained from the 2003 and 2007 samples. In conclusion, within-person variance components can be used in populations similar to the study sample to estimate habitual nutrient and energy intake, when only one 24hR is available for each study participant.
References
1. Institute of Medicine, Food and Nutrition Board. Dietary
Reference Intakes: Applications in Dietary Assessment. Washington, DC: National Academy Press; 2000.
2. Beaton GH. Approaches to analysis of dietary data: relationship between planned analyses and choice of
methodology. Am J Clin Nutr 1994; 59(S): 253-61.
3. Nusser SM, Carriquiry AL, Dodd KW, Fuller WA. A semiparametric transformation approach to estimating
usual daily intake distributions. J Am Stat Assoc 1996; 91:
1440-9.
4. Dodd KW, Guenter PM, Freedman LS, Subar AF, Kipnis V, Midthune D et al. Statistical Methods for Estimating Usual Intake of Nutrients and Foods: A Review of the
Theory. J Am Diet Assoc 2006; 106: 1640-50.
5. Jahns L, Arabe L, Carriquiry A, Popkin BM. The use of external whitin-person variance estimates to adjust nutrient intake distributions over time and across
population. Public Health Nutr 2005; 8: 69-76.
6. Murphy SP, Guenther PM, Kretsch MJ. Using the dietary reference intakes to assess intakes of groups: pitfalls to
avoid. J Am Diet Assoc 2006; 106: 1550-3.
7. Verly-Jr E, Cesar CLG, Fisberg RM, Marchioni DML. Socio-economic variables influence the prevalence of inadequate nutrient intake in Brazilian adolescents:
results from a population-based survey. Public Health
Nutr 2011; 14: 1533-8.
8. Morimoto JM, Marchioni DML, Cesar CLG, Fisberg RM. Variância intrapessoal para ajuste da distribuição
de nutrientes em estudos epidemiológicos. Rev Saúde
9. Verly-Jr E, Cesar CLG, Fisberg RM, Marchioni DML. Source of variation of energy and nutrient intake among
adolescents in São Paulo. Cad Saúde Pública 2010; 26:
2129-37.
10. Bigio RS. Consumo de frutas, legumes e verduras:
relação com níveis sanguíneos de homocisteína entre adolescentes [dissertação de mestrado]. São Paulo: Faculdade de Saúde Pública da Universidade de São Paulo; 2011.
11. Thompson FE, Byers T. Dietary assessment resource
manual. J Nutr 1994; 124(Suppl): 2245-317.