Open Access
Research article
Troponin T isoform expression is modulated during Atlantic Halibut
metamorphosis
Marco A Campinho
1,2, Nádia Silva
1,2, Mari A Nowell
2, Lynda Llewellyn
2,
Glen E Sweeney
2and Deborah M Power*
1Address: 1CCMAR, FERN, Universidade do Algarve, Campus de Gambelas, 8005-139 Faro, Portugal and 2School of Biosciences, University of Wales, Museum Avenue CF11 3US Cardiff, UK
Email: Marco A Campinho - [email protected]; Nádia Silva - [email protected]; Mari A Nowell - [email protected]; Lynda Llewellyn - [email protected]; Glen E Sweeney - [email protected]; Deborah M Power* - [email protected] * Corresponding author
Abstract
Background: Flatfish metamorphosis is a thyroid hormone (TH) driven process which leads to a
dramatic change from a symmetrical larva to an asymmetrical juvenile. The effect of THs on muscle and in particular muscle sarcomer protein genes is largely unexplored in fish. The change in Troponin
T (TnT), a pivotal protein in the assembly of skeletal muscles sarcomeres and a modulator of calcium
driven muscle contraction, during flatfish metamophosis is studied.
Results: In the present study five cDNAs for halibut TnT genes were cloned; three were splice
variants arising from a single fast TnT (fTnT) gene; a fourth encoded a novel teleost specific fTnT-like cDNA (AfTnT) expressed exclusively in slow muscle and the fifth encoded the teleost specific
sTnT2. THs modified the expression of halibut fTnT isoforms which changed from predominantly
basic to acidic isoforms during natural and T4 induced metamorphosis. In contrast, expression of red muscle specific genes, AfTnT and sTnT2, did not change during natural metamorphosis or after T4 treatment. Prior to and after metamorphosis no change in the dorso-ventral symmetry or temporal-spatial expression pattern of TnT genes and muscle fibre organization occurred in halibut musculature.
Conclusion: Muscle organisation in halibut remains symmetrical even after metamorphosis
suggesting TH driven changes are associated with molecular adaptations. We hypothesize that species specific differences in TnT gene expression in teleosts underlies different larval muscle developmental programs which better adapts them to the specific ecological constraints.
Background
Troponin T (TnT) is a class of skeletal muscle specific
pro-teins that are an important component of the thin-fila-ment. TnT proteins are essential for correct assembly of the sarcomeres [1,2] and are responsible for anchoring of the Troponin complex to tropomyosin (Tm) and correct
assembly and function of Troponin I and C [3,4]. In tetra-pods, three TnT genes exist, fast, slow and cardiac, expressed respectively in white (fast-twitch and glyco-lytic), red (slow-twitch and oxidative) and cardiac muscle. However, recent studies indicate that in teleosts a greater number of genes exist and at least two fast TnT (fTnT) and
Published: 18 June 2007
BMC Developmental Biology 2007, 7:71 doi:10.1186/1471-213X-7-71
Received: 6 November 2006 Accepted: 18 June 2007
This article is available from: http://www.biomedcentral.com/1471-213X/7/71 © 2007 Campinho et al; licensee BioMed Central Ltd.
This is an Open Access article distributed under the terms of the Creative Commons Attribution License (http://creativecommons.org/licenses/by/2.0), which permits unrestricted use, distribution, and reproduction in any medium, provided the original work is properly cited.
two slow TnT (sTnT) genes exist as well as an apparently teleost specific intronless TnT (iTnT) gene [5-7].
In terrestrial vertebrates, TnT genes are known to produce multiple protein isoforms by alternative splicing mecha-nisms [3,4,6,8-20]. A number of factors, such as contrac-tile properties [21], intracellular pH [22] in myofibres, calcium dependence modulation during cross-bridge cycling [23] and innervation patterns during development [24], are proposed to be associated with TnT isoform switching in cardiac and fast muscle of foetal and adult terrestrial vertebrates. In contrast, in terrestrial vertebrates, no developmental specific sTnT protein isoform changes occur [4,9,13,18-20], although in adults red-muscle-spe-cific isoforms are detected [3].
We recently reported the existence of three stage specific
fTnT transcripts in a teleost, the sea bream, namely
embry-onic, larval and adult which are splice variants of a single gene [5]. Moreover, in contrast to tetrapods, two para-logue sTnT genes (sTnT1 and sTnT2) that exhibit develop-mental specific expression were also identified in sea bream [6]. The teleost specific gene, sTnT2, is first detected in sea bream in late epiboly stages and is the only sTnT gene expressed up until 4 days post-hatch (dph) the time at which sTnT1 expression starts [6]. Throughout larval development and in early juvenile stages, sTnT1 is the pre-dominant sTnT gene expressed in sea bream red muscle, although in adult red muscle sTnT2 is the predominant isoform and sTnT1 is virtually undetectable [6].
Studies in flatfish indicate that changes occur in muscle during the thyroid hormone driven metamorphosis in which a bilaterally symmetrical larvae changes to an asymmetric juvenile. In pre-metamorphic pelagic larvae of the flatfish Paralichthys olivaceus (flounder) two fTnT immunoreactive proteins of 41.5 and 34 kDa were reported [25]. However, when the larvae enter metamor-phosis to become a benthic flatfish, the 41.5 kDa protein is substituted by a new 33.5 kDa isoform. In post-meta-morphosis juvenile fish only the 34 and 33.5 kDa iso-forms of TnT are present [25]. Similarly, during spontaneous metamorphosis larval 5,5'-dithio-bis-nitrobenzoic acid (DTNB) light chain (myosin light chain 2, MLC2) is replaced by an adult specific isoform [26]. Although it is evident that changes which occur in muscle during metamorphosis are probably associated with changing functional requirements, surprisingly few molecular studies exist of this process. In the present study in order to analyse changes in skeletal muscle and in par-ticular TnT gene expression during halibut (Hippoglossus
hippoglossus) natural and T4 induced metamorphosis,
cDNAs for slow and fast TnT were cloned and their expres-sion and tissue distribution was studied in relation to changing thyroid hormone concentrations and muscle development.
Results
Halibut TnT genes
Five cDNAs corresponding to different skeletal muscle
TnT genes (Fig. 1) were isolated from a cDNA library of
metamorphosing halibut larvae. In tBLASTx analysis [27]
ClustalX multiple protein sequence alignment of halibut predicted TnT protein; Clustal X multiple alignment of predicted pro-tein sequences from halibut fTnThh cDNA isoforms, AfTnThh and sTnT2hh cDNAs
Figure 1
ClustalX multiple protein sequence alignment of halibut predicted TnT protein; Clustal X multiple alignment of predicted pro-tein sequences from halibut fTnThh cDNA isoforms, AfTnThh and sTnT2hh cDNAs. Shaded areas represent sequence similarity. The N-terminal hypervariable region and Tropomyosin- and Troponin I-binding regions are indicated.
against the GeneBank database, three cDNAs gave a highly significant match with teleost, fTnT genes. From the anal-ysis it was determined that the fTnThh cDNAs isolated cor-respond to a putative embryonic/larval halibut fTnT (denominated efTnThh; DQ680173) and two different adult isoforms (denominated fTnThh-1, DQ680174, and
fTnThh-2, DQ680175). The efTnThh cDNA is a full-length
clone with 965 nucleotides (nt) and encodes a 286 amino acids (aa) protein from nt 62 to 919. The size of the deduced protein is 34.6 kDa and the predicted pI is 5.27 (Fig. 1)[28]. The fTnThh-1 isoform is a 752 bp cDNA which encodes a protein of 232 aa from nt 22 to 717 (Fig. 1). The deduced fTnThh-1 protein has a predicted molec-ular weight of 27.89 kDa and a pI of 9.42 [28]. The cDNA of the third isoform, denominated fTnThh-2, is 1,020 bp long and encodes a putative protein of 229 aa from nt 70 to 756 (Fig. 1). The predicted molecular weight and pI for the fTnThh-2 protein isoform is respectively 27.5 kDa and 9.55 [28].
In silico characterisation of the deduced halibut fTnT
pro-teins using ProDom [29] and PRINTS [30] software con-firmed that they possess all the characteristics of fully functional fTnT proteins. ClustalX [31] multiple align-ment analysis of these putative halibut fTnT cDNAs and their deduced protein sequence indicates that they are the products of alternative splicing of the halibut fTnT gene (Fig. 1). Isoform efTnThh shares 80% sequence identity with 1 and -2 isoforms, whereas isoforms fTnThh-1 and -2 are 99% similar. The differences between the hal-ibut TnT cDNA isolated are due to the presence of an insert in efTnThh (aa 12 to 68) and fTnThh-1 (aa 12 to 14) which is lacking in the fThThh-2 isoform (Fig. 1). A further 1,107 bp cDNA was also cloned and tBLASTx analysis [27] suggests that it most closely resembles an
fTnT gene and gave the most significant hit to D. rerio fTnTa gene and it was tentatively designated an atypical fast TnT cDNA (AfTnThh-1; DQ680176) as a consequence of
its tissue distribution. The predicted protein product encoded by AfTnThh-1 cDNA was 289 aa with a pI of 5.07 and molecular weight of 34.21 kDa (Fig. 1)[28].
A halibut cDNA homologous to a previously reported tel-eost specific sTnT2 gene was also cloned. This cDNA, des-ignated sTnT2hh (DQ680172), is 980 bp long and encodes a deduced protein of 246 aa (Fig. 1) with a pre-dicted molecular weight of 29 kDa and a pI of 9.24 [28]. It was not possible, despite extensive cDNA library screen-ing to isolate a cDNA that was the product of a putative halibut sTnT1 gene.
ClustalX multiple sequence alignment [31] of the deduced amino acid sequence of halibut TnT genes show that efTnThh shares 69% and 52% sequence identity,
respectively, with AfTnThh and sTnT2hh. Comparison of the other halibut fTnT-1 and -2 isoforms with AfTnThh and sTnT2hh reveal they share ~59% sequence identity while, AfTnThh and sTnT2hh share 50% identity.
Putative genomic organization of halibut skeletal TnT genes
In silico tBLASTx analysis [27] using halibut fTnT cDNA
sequences gave a highly significant hit to Tetraodon
nigro-viridis genomic scaffold 7217 (SCAF7217). The putative Tetraodon and deduced halibut fTnT gene is composed of
14 exons (Fig. 2A) as previously described for the sea bream [5]. The efTnThh isoform is composed of exons I to III and V to XIV (Fig. 2A). Isoform fTnThh-1 contains all exons except exon V, which codes for the highly acidic peptide containing a glutamic acid (E), proline (P) repeat (Fig. 1 and 2A). In the isoform fTnThh-2 mRNA, exons IV and V are spliced out (Fig. 2A) which results in the loss of 9 nt in relation to fTnThh-1 (Fig. 1). The ATG transcription start signal is located in exon II and exon I bears the begin-ning of the 5'UTR (Fig. 2A). The 3'UTR and the end of the protein coding region are located in exon XIV. Overall coverage of the fTnThh cDNA sequences was 97% and overall identity between it and the Tetraodon fTnT gene sequence was 82%.
Genomic organization of Tetraodon nigroviridis TnT genes; Genomic organization of Tetraodon fTnTtn (A), AfTnTtn (B) and sTnT2tn (C)
Figure 2
Genomic organization of Tetraodon nigroviridis TnT genes; Genomic organization of Tetraodon fTnTtn (A), AfTnTtn (B) and sTnT2tn (C). Open rectangles represent untranslated regions, while shading represents coding exons. The striped rectangles represent alternatively spliced exons. The arrow-heads pointing upwards depict the ATG translational start codon. The three Tetraodon TnT genes have a very similar genomic organizations with exon I containing the start of the 5'UTR, the ATG start site is located in exon II and the last exon codes for the last C-terminal amino acids as well as the entire 3'UTR. In the fTnT gene exons IV and V are alterna-tively spliced both in Tetraodon and halibut. In the AfTnT gene exon VI is alternatively spliced in Tetraodon but seems to be constitutive in halibut (see Discussion).
The halibut AfTnThh gene used in tBLASTx analysis led to the identification of the putative Tetraodon AfTnT locus in scaffold 15099 (SCAF15099) as well as five different
Tetraodon AfTnT cDNA isoforms (numbered 1 to 5) which
seem to be the product of alternative splicing (AfTnTtn-1, CR696067; AfTnTtn-2, CR675364; AfTnTtn-3, CR662746;
AfTnTtn-4, CR727722; AfTnTtn-5, CR673164). The Tetrao-don AfTnT cDNA and the AfTnThh cDNA were used to
deduce the putative genomic organization of the AfTnT gene in Tetraodon scaffold 15099 by aligning the cDNAs and genomic sequences in Spidey [32]. The analysis revealed that the Tetraodon AfTnT gene (AfTnTtn) is com-posed of 16 exons with conserved intron/exon boundaries spanning 8946 bp in Tetraodon scaffold 15099 (Fig. 2B).
Tetraodon AfTnTtn cDNAs had 100% coverage in the Tetraodon genomic sequence of scaffold 15099 and the
majority of exons shared 100% nucleotide sequence con-servation. The halibut AfTnThh cDNA had 100% coverage in the Tetraodon genomic sequence of scaffold 15099 and shared 79% overall sequence identity. Exon I bears part of the 5'UTR while exon II contains the remainder and the ATG translation start site. Exon III is composed of 13 nt and constitutes together with exons I and II the N-termi-nal constitutive exons present in all Tetraodon AfTnT cDNAs identified. Exon II and III share 77% sequence identity between the Tetraodon genomic sequence and hal-ibut AfTnThh cDNA, while exon I shares only 58% iden-tity. Exon IV which codes for 3 acidic residues both in
Tetraodon and halibut is the first N-terminal alternatively
spliced exon in Tetraodon cDNAs, and shares 75% sequence identity between Tetraodon genomic and halibut
AfTnThh cDNA sequence. Exon V is the largest
alterna-tively spliced N-terminal exon in Tetraodon and is the most divergent between the Tetraodon genomic sequence and halibut AfTnT cDNA. In this exon the sequence iden-tity is only 52% and a 41 nt insertion in the third quarter of the Tetraodon genomic sequence renders this exon big-ger in Tetraodon than in halibut. However, the 5' and 3' regions of the Tetraodon sequence are well conserved with the corresponding halibut AfTnT sequence. Exons VI and VII are highly conserved (94%) between the Tetraodon genomic sequence and halibut AfTnT cDNA sequence and are alternatively spliced in Tetraodon. Exons VIII to XVI encode the C-terminal constitutive region present in all vertebrate TnT genes and sequence conservation between the Tetraodon and halibut was always greater than 85% and no splice variants of this region were observed in
Tetraodon. Exon XVI codes for the last 11 amino acid
resi-dues of the protein and the entire 3'UTR. Although exon XVI shares only 47% sequence identity between Tetraodon and halibut the sequence divergence is in the 3'UTR rather than the coding region (86% sequence identity).
The genomic organization of halibut sTnT2 gene in
Tetrao-don was also determined (Fig. 2C). Using the sTnT2hh
sequence in tBLASTx analysis [27] of the Tetraodon genome database [33] a single hit with Tetraodon scaffold 15000 (SCF15000) was found. A single cDNA transcript (CR734482) arising from Tetraodon sTnT2 gene (SCF15000) was isolated and introduced in Spidey align-ing software [32] along with the halibut sTnT2 cDNA sequence to determine the putative genomic organization of sTnT2. The putative Tetraodon sTnT locus is composed of 12 exons and spans 2567 nt in the Tetraodon genomic sequence (Fig. 2C). Exon I bears the first three-quarters of the 5'UTR and the beginning of the coding region is located in exon II. Exon XII contains the 3'-end of the cod-ing region as well as the 3'UTR (Fig. 2C). The halibut
Halibut TnT genes tissue specific expression; (A) Northern blot analysis of the expression of halibut fTnThh, AfTnThh and
sTnT2hh genes in adult white muscle (W), red muscle (R),
heart (H) and liver (L) Figure 3
Halibut TnT genes tissue specific expression; (A) Northern blot analysis of the expression of halibut fTnThh, AfTnThh and
sTnT2hh genes in adult white muscle (W), red muscle (R),
heart (H) and liver (L). All images represent 48 hour expo-sures. Ethidium bromide gel image is shown to give an indica-tion of the quantity of total RNA loaded per sample. (B) RT-PCR analysis of expression of fTnThh, AfTnThh and sTnT2hh in halibut adult white (WM) and red (RM) muscle and heart (H). The 18s rRNA is shown and was used for normalisation. The graphs on the right of the fTnThh and AfTnThh gels repre-sent, respectively, expression of the different fTnThh or AfT-nThh isoforms relative to 18s rRNA.
sTnT2hh cDNA sequence had 86% coverage in the Tetrao-don genomic sequence and shared 82% sequence identity.
Tissue specificity of halibut TnT genes
Northern blot and RT-PCR analysis were carried out in order to determine tissue specificity of the halibut TnT genes isolated. The northern blot results (Fig. 3A) show that fTnThh, as expected, is expressed in adult halibut white (fast) muscle and is absent from red muscle, cardiac muscle and liver. However, the more sensitive RT-PCR technique revealed that fTnThh is also expressed in halibut adult red muscle (Fig. 3B). The tBLASTx and phylogenetic
analysis of AfTnThh classified this cDNA as the product of a fast TnT gene, although its expression is red (slow) mus-cle specific (Fig. 3A) and it is not detected in adult white (fast) muscle, cardiac muscle or liver. The halibut sTnT2 gene is exclusively expressed in halibut adult red muscle (Fig. 3A). The red muscle tissue specificity of AfTnThh and
sTnT2hh was further confirmed by RT-PCR (Fig. 3B).
Phylogenetic analysis of Halibut TnT genes
ClustalX multiple sequence alignment [31] of the deduced protein of halibut TnT and other vertebrate TnT protein sequences and striated muscle TnT from C. elegans was performed and the resulting phylogenetic relation-ships were determined in PAUP* version 4.0b software [34] using the maximum-parsimony method with 1000 bootstraps [35] and C. elegans TnT as an outgroup. The phylogenetic tree shows that the vertebrate fTnTs form a single clade and that within it the tetrapod fTnTs cluster apart from the fish fTnTs (Figure 4). Moreover,
efT-nThh, fTnThh-1 and fTnThh-2 cluster with highly
signifi-cant bootstrap values with other teleost fTnT genes. Within the main fTnT clade, AfTnThh and Tetraodon
AfT-nTtn isoforms clustered together and formed a separate
group and this topology was supported by highly signifi-cant bootstrap values (Fig. 4).
Two principal clades were found for sTnT which corre-sponded to sTnT1 and sTnT2 (Fig. 4). The halibut sTnT2hh clusters with other teleost specific sTnT2 genes (Fig. 4) and forms a group apart from tetrapod sTnT and sTnT1, which clustered together.
TnT expression during halibut metamorphosis
The expression of the isolated halibut fTnT, AfTnT and
sTnT2 genes was analysed by RT-PCR during halibut
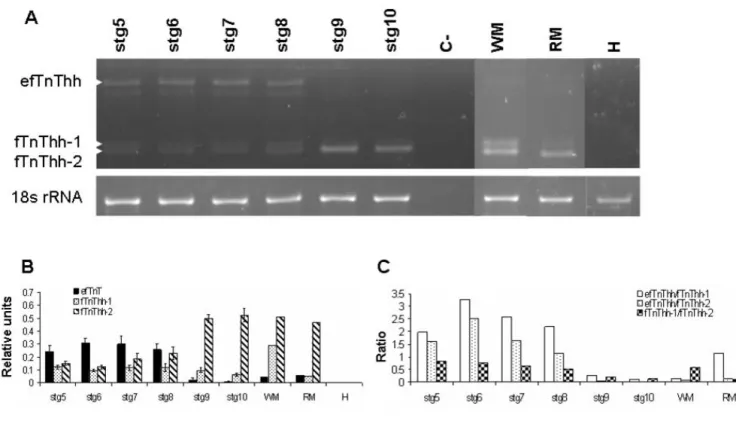
met-amorphosis (Fig. 5, 6 and 7, respectively). The primers used in this analysis encompass the entire N-terminal hypervariable region which is known in vertebrates to generate alternative spliced isoforms [3,4,6,8-20]. Three
fTnThh isoforms were amplified by RT-PCR during halibut
metamorphosis, the largest product corresponded to
efT-nThh (423 bp) while the smaller products correspond to, fTnThh-1 (261 bp) and fTnThh-2 (252 bp; Fig. 5A). A
fur-ther reaction product is observed between the efTnThh and the other two isoforms that does not represent an authentic isoform but a heteroduplex of efTnThh and the other two isoforms since isolation followed by PCR, sub-cloning and sequencing always yield either efTnThh or one of the other two isoforms.
The three halibut fTnT isoforms are all present in pre-metamorphic halibut larvae (stg 5–7) and efTnThh is the predominant isoform expressed up until the beginning of climax and has approximately 2-fold higher expression
Phylogenetic analysis of halibut TnT genes isolated; Maximum parsimony phylogenetic tree using the predicted protein sequence of the different halibut TnT cDNA isolated and that of other vertebrates (Table 1) retrieved from Genebank and the Medaka EST database (see Materials and Methods) Figure 4
Phylogenetic analysis of halibut TnT genes isolated; Maximum parsimony phylogenetic tree using the predicted protein sequence of the different halibut TnT cDNA isolated and that of other vertebrates (Table 1) retrieved from Genebank and the Medaka EST database (see Materials and Methods). The bar in the bottom left-hand corner represents 10% sequence divergence. The species and gene abbreviations are described in Table 1.
than fTnThh-1 and -2 (stg 8; HSD, p < 0.001; Fig. 5A and 5B). At the beginning of climax fTnThh-2 expression starts to increase and at the climax of metamorphosis (stg 9) the efTnThh isoform is downregulated and is almost undetec-table in fully metamorphosed juveniles (stg 10, Fig. 5A and 5B). In parallel fTnThh-2 becomes the most highly expressed fTnThh isoform and increases ~3-fold in juve-niles (Fig. 5A and 5B). Prior to, and after metamorphosis fTnThh-1 expression does not change significantly (Fig. 5A and 5B). Analysis of fTnT isoform expression in adult halibut muscle by RT-PCR confirmed the general pattern encountered by Northern blot (Fig. 3A). However, the more sensitive RT-PCR technique permitted detection of fTnThh isoforms in halibut adult red -muscle (Fig. 3B and 3C). In halibut adult white muscle low expression of efT-nThh (~14-fold lower than fTefT-nThh-2) is observed, fTnThh-2 continues to be the predominant isoform although fTnThh-1 expression has increased and is about half that of fTnThh-2 (Fig. 3B and 3C). The ratio of the dif-ferent fTnThh mRNA in red muscle differs from white muscle since fTnThh-2 is ~10-fold more expressed than efTnThh and fTnThh-1 which are almost undetectable (Fig. 3B and 3C).
In contrast to fTnThh, expression of halibut AfTnThh (Fig. 6A) and sTnT2hh (Fig. 7A) detected by RT-PCR does not change during metamorphosis (Fig. 7). However, 4 alter-natively spliced isoforms of AfTnThh are detected (Fig. 8A and 8D). Sequence analysis reveals that the AfTnThh iso-forms are a result of alternative splicing of exons IV, V and VII (Fig. 2) and are designated AfTnThh-1 to -4. The largest product, AfTnThh-1 (439 bp) is identical to the AfTnThh cDNA isolated by library screening and includes all alter-natively spliced exons (Fig. 6A and 6D); AfTnThh-2 (412 bp; DQ680177) lacks exons IV and VII but exon V is maintained (Fig. 6A and 6D); AfTnThh-3 (301 bp; DQ680178) is composed of exon IV and VII but exon V is spliced out (Fig. 6A and 6D); and in AfTnThh-4 (283 bp; DQ680179) only exon IV is spliced in and all other alter-natively spliced exons (exons V and VII) are spliced out (Fig. 6A and 6D). All the halibut AfTnThh isoforms detected contain exon VI (Fig. 6D) and neither the iso-form expression pattern nor the ratio between these
AfT-nThh isoforms is altered during metamorphosis (Fig. 6A–
C). A small but statistically significant (HSD, p ≤ 0.005; Fig. 6A and 6B) decrease in expression of all the isoforms is observed in stg 10 juveniles; AfTnThh-1 is the
predomi-Expression of fTnThh gene during halibut metamorphosis; Ethidium bromide gel image of RT-PCR amplified fTnThh and 18s
rRNA (A) Figure 5
Expression of fTnThh gene during halibut metamorphosis; Ethidium bromide gel image of RT-PCR amplified fTnThh and 18s
rRNA (A). White arrowheads indicate different fTnThh isoforms. Graphs represent (B) fTnThh expression relative to 18s rRNA
nant isoform throughout the halibut's life. In turn,
AfT-nThh-2 is the second most abundant isoform and its
expression increases after climax (HSD, p ≤ 0.006; Fig. 6A and 6B). However, in adult red muscle the ratio of the two isoforms is identical to pre-metamorphic stg 5 animals (Fig. 6A and 6C). The AfTnThh-3 and -4 isoforms have identical (HSD, p > 0.05), very low expression (Fig. 6A–C)
and their expression and ratio in relation to other iso-forms does not change during metamorphosis (HSD, p > 0.05; Fig. 6A–C). Moreover, in adult red muscle these low molecular weight isoforms are not expressed (Fig. 6A and 6B).
Expression of AfTnThh gene during halibut metamorphosis; Ethidium bromide gel image of AfTnThh and 18s rRNA (A) Figure 6
Expression of AfTnThh gene during halibut metamorphosis; Ethidium bromide gel image of AfTnThh and 18s rRNA (A). C- repre-sents none-template control. White arrowheads indicate the different AfTnThh isoforms found. Graphs present the expression of the different AfTnThh isoforms relative to 18s rRNA(B) and the ratio between the different AfTnThh isoforms (C). The pre-dicted protein sequence of the amplified halibut AfTnThh isoforms is given (D). The exons that encode each peptide are also indicated.
Spatial-temporal expression pattern of halibut TnT genes during metamorphosis
The spatial-temporal expression pattern of TnT mRNA was determined in free- swimming halibut larvae which feed exogenously. In such larvae two distinct muscle lay-ers are evident, an inner white and superficial red muscle layer (Fig. 8). In stage 5 halibut the anatomical organisa-tion of the white muscle is very simple with a "V" shaped myomere and it is composed of several block-like bilater-ally symmetrical myotomes bounded by a septum. The extreme dorsal and ventral myotomes and the lateral region of the myotomes close to the red muscle is charac-terized by the presence of numerous small rounded fibres, characteristic of germinal zones, while in the deeper region of the larger myotomes, fibres are much larger, more block-like and are closely packed. In subsequent stages myotome number increases and in stage 6 halibut larvae they take on the typical "W" shaped myomer organ-isation.
No change in the bilateral symmetry of the muscle anat-omy accompanies metamorphosis, although a significant
increase in the volume of muscle occurs in stages 8, 9 and 10 (Fig. 8). Regions of hyperplastic growth persist in the most ventral and dorsal myotomes in all of the stages ana-lysed. A rapid increase in myotome number is evident from stage 5 through 7 and in subsequent stages hyper-trophic growth leads to a considerable increase in myo-tome and overall muscle volume. In stage 5 the red muscle layer is a monolayer of fibres at the outermost region of the myotomes, although proliferating red mus-cle fibres at the midline region of the myotome generate a small region with a double layer of fibres. In stage 6 larvae this double layer is much more evident and in successive larval stages all the red muscle layer is proliferating so that in stage 9 halibut it is composed of several layers of fibres of different sizes. Notably during the entire metamorphic process the symmetry of the myotomes is maintained even though the skull becomes asymmetric with the right eye migrating to the left side of the head that at the end of metamorphosis constitutes the dorsal side of halibut body.
Expression of sTnT2hh gene during halibut metamorphosis; Ethidium bromide gel image of sTnT2hh and 18s rRNA expression during halibut metamorphosis (A)
Figure 7
Expression of sTnT2hh gene during halibut metamorphosis; Ethidium bromide gel image of sTnT2hh and 18s rRNA expression during halibut metamorphosis (A). Graphs present the relative expression of sTnThh2 after normalisation with 18s rRNA during halibut metamorphosis (B). C- represents non-template control.
Halibut embryonic/larval fTnT exon expression in pre-metamorphic halibut larvae (Stg5 and 6; Fig. 8 and Fig. 9A and 9B) is restricted to white muscle, in the lateral and apical germinal zones of the myotome. As the halibut lar-vae approach metamorphic climax (Stg8; Fig. 8 and Fig. 9C) the efTnThh expression is significantly downregulated and confined to very small fibres and to presumptive sat-ellite cells (arrows in Fig. 8 and Fig. 9C). From climax of metamorphosis (stg 9; Fig. 8 and 9D) onwards no efTnThh expression is detected. The 3'UTR fTnT probe reveals the general fTnThh expression pattern in stage 5 (Fig. 8 and Fig. 9E) and stage 6 larvae (Fig. 8 and Fig. 9F) which is similar to that observed with the embryonic/larval fTnT exon probe. At stage 8 (Fig. 8 and Fig. 9G) fTnT is uni-formly distributed in the white muscle. As the animals reach post-metamorphic juvenile stage 10 (Fig. 8 and Fig. 9H) fTnThh expression looses its uniformity and although still expressed in the entire myotome, the signal is more intense in cells close to the myosepta (Fig. 8).
Halibut AfTnT and sTnT2 gene expression is confined to red muscle fibres in all metamorphic stages analysed. Expression of AfTnT in pre-metamorphic stage 5 larvae (Fig. 8 and Fig. 9I) is highly abundant in the red muscle layer. At the end of larval life, just before the onset of met-amorphosis, (stg 6) in the myotome midline region two red muscle cell layers both expressing AfTnT are present (data not shown). In stage 8 (Fig. 9K) the expression of
AfTnThh is detected uniformly in all the fibres of the red
muscle, while in post-metamorphic juveniles at stage 10 (Fig. 8 and Fig. 9L) it is mostly present in the smaller fibres (arrowheads in Fig. 9L). In the case of sTnT2, expression is restricted to the red muscle layer and is very similar to
AfTnT in stage 5 (Fig. 9M), 6 (Fig. 9N), 8 (Fig. 9O), 10
(Fig. 9P) halibut. The spatial-temporal expression pattern of red muscle specific halibut TnT genes is symmetrical and does not change during halibut metamorphosis (Fig. 8 and 9).
TH levels in metamorphosing halibut
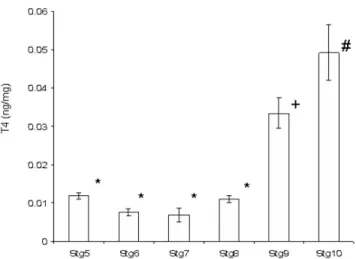
At the beginning of metamorphosis and up until the beginning of climax (stg 8), T4 levels remain low with no significant differences observed between stages 5, 6 and 8 (HSM, p > 0.05; Fig. 10). In fact in larvae at the beginning of metamorphosis (stg 7) T4 levels are lower than in pre-metamorphic larvae (stg 5, HSD, p < 0.05). At the climax of metamorphosis (stg 9), whole-body T4 content increases about 3-fold in relation to all the previous stages (HSM, p < 0.005, Fig. 10). In post-metamorphic juveniles (stg 10) T4 levels continue high and, although not signif-icantly different from stage 9, they are signifsignif-icantly higher than all other preceding stages (stg 5 to 8, HSM, p < 0.001; Fig. 10).
Schematic representation of muscle ontogeny in halibut dur-ing metamorphosis; Schematic representation of the muscle ontogeny in halibut from larvae (stg 5) to juvenile (stg 10) and the overall expression pattern of halibut TnT genes Figure 8
Schematic representation of muscle ontogeny in halibut dur-ing metamorphosis; Schematic representation of the muscle ontogeny in halibut from larvae (stg 5) to juvenile (stg 10) and the overall expression pattern of halibut TnT genes. There is a general increase in myotome volume during meta-morphosis. Note that throughout muscle ontogeny, prior to and after metamorphosis, symmetry is maintained both in the sagital and longitudinal planes. In pre-metamorphic halibut (stg 5 and 6) white muscle hyperplasic small diameter fibers are located in the most apical and lateral sides of the myo-tome regions (insert) which predominantly express efTnThh (black dots). As white muscle fibers increase in size the expression of fTnThh isoforms disappears. The expression of the other fTnThh isoforms (light grey dots) co-localizes with
efTnThh expression up until stg 7. When the animals reach
the beginning of metamorphosis (stg 7) all mature white mus-cle fibers express fTnThh-1 and -2 isoforms (light grey shad-ing) and efTnThh is only found in smaller diameter hyperplasic fibers in the periphery of the myotomes around the
myosepta (black dots). As the animals enter the climax of metamorphosis expression of the low molecular weight
fTnThh isoforms is located in the entire myotome (light grey
shading) and efTnThh is confined to scattered presumptive satellite cells (black dots). At climax (stg 9) and in juvenile (stg 10) white muscle fTnThh-1 and -2 isoforms are expressed in all the myotome with varying intensity and in fibers close to the myosepta expression is higher. In pre-metamorphic halibut red muscle (dark grey) all cells express sTnT2hh and
AfTnThh. The expression of the red muscle specific Troponin T
genes is constant and restricted to the outer red muscle throughout halibut metamorphosis and in juvenile animals.
Before metamorphosis and up until climax of metamor-phosis (stg 9) T3 levels are lower than T4 (HSD, p < 0.001; Fig. 10). In fact, T3 levels decrease from pre-metamorphic larvae (stg 5) until the start of metamorphosis (stg 8) (Fig. 10). However, in halibut at climax (stg 9) T3 levels increase more than 200-fold and are higher than T4 levels (HSD, p < 0.001; Fig. 10). However, after metamorphosis T4 levels are again higher than T3 levels (HSD, p < 0.001; Fig. 10). T3 levels at climax and in fully metamorphosed juveniles are significantly higher than all previous halibut stages (HSD, p < 0.001; Fig. 10).
T4 treatment and halibut TnT expression
Treatment of pre-metamorphic halibut larvae for 10 days with T4 totally repressed efTnThh isoform expression (HSD, p < 0.05, Fig. 11A) without affecting the expression of the other two fTnThh isoforms (HSD, p > 0.05, Fig. 11A). Neither AfTnThh or sTnT2hh expression or isoform profile is altered from that of control larvae by T4 treat-ment (Fig 11B and 11C).
Discussion
We have isolated cDNAs from three different striated mus-cle TnT genes in the halibut one of which is white musmus-cle specific while the other two are red muscle specific. Alter-native splicing of the fTnThh gene gives rise to three alter-native splice variants which encode three proteins varying only in the N-terminal region (Fig. 1). As observed for the fTnT gene of S. auratus [5], halibut fTnT is also expressed in adult red muscle. In fact, the expression of teleost fast-specific genes in red muscle seems to be a common feature in teleost species [36,37]. In relation to fTnThh-1 (pre-dicted MR 27.89 kDa and pI 9.42) and fTnThh-2 (pre-dicted MR 27.5 kDa and pI 9.55), the putative efTnThh protein isoform is bigger (MR 34.6 kDa) and more acidic (pI 5.27) and the difference arises as a consequence of splicing in of exon V (Fig. 2A), in a way similar to that pre-viously reported in S. auratus, a perciform and also in other vertebrates [4,10-13], [38-50]. In the halibut the number of alternatively spliced fTnT isoforms are the same as found in Tetraodon and S. auratus [5]. In common with Tetraodon efTnT, exon V is spliced in and exon IV is spliced out (Fig. 1 and 2A). This is in contrast to efTnT in
S. auratus in which exon IV is also spliced in along with
exon V [5] suggesting that in the halibut and Tetraodon exons IV and V are mutually exclusively expressed (Fig. 2A). Although no data is available about the specific bio-chemical characteristics of muscle fibres in halibut, S.
aurata or Tetraodon larvae, the present study indicates that
differences probably exist between teleost species and these differences are probably an adaptation to their dif-fering ecologies and locomotive strategies.
Halibut whole-body T4 levels during metamorphosis; Change in whole-animal T4 content (pg/mg) during halibut metamor-phosis
Figure 10
Halibut whole-body T4 levels during metamorphosis; Change in whole-animal T4 content (ng/mg) during halibut metamor-phosis. *- No significant statistical difference (HSD, p > 0.05). + and # denote significant statistical differences from all other time points (HSD, p < 0.05).
In situ expression of halibut TnT genes during metamorpho-sis; Temporal and spatial expression of halibut embryonic/lar-val fTnT exon (A-D), General 3'UTR-fTnT probe (E-H), AfTnT (I-L) and sTnT2 (M-P) in transversal sections of halibut larvae, by in situ hybridization using DIG labelled riboprobes Figure 9
In situ expression of halibut TnT genes during metamorpho-sis; Temporal and spatial expression of halibut embryonic/lar-val fTnT exon (A-D), General 3'UTR-fTnT probe (E-H), AfTnT (I-L) and sTnT2 (M-P) in transversal sections of halibut larvae, by in situ hybridization using DIG labelled riboprobes. Pre-metamorphic stg 5 larvae: A, E, I, M; pre-Pre-metamorphic stg 6 larvae: B, F, J and N; larvae at the beginning of metamorphic climax (stg 8): C, G, K and O; larvae at metamorphic climax (stg 9): D; postmetamorphic juveniles (stg 10): H, L and P. In C arrows depict efTnThh expression in putative myogenic satellite cells. In L arrows depicts AfTnT expression. In P arrows depict sTnT2 expression. Scale bars, 50 µm.
In rat, human and mouse it has been reported that some fTnT isoforms predominate over others due to the specific biochemical characteristics of different fibres types [51]. In these mammals acidic, fetal fTnT isoforms predomi-nate in mainly glycolytic fibres whereas more basic iso-forms are predominant in mainly oxidative fibres [51]. However, there are clear differences between teleost and tetrapod fTnT genes. In tetrapods alternative splicing of the fTnT gene generates several N-terminal protein iso-forms through the use of a greater number of alternatively spliced exons [4,11] whereas in teleosts it seems that only two exons undergo alternative splicing (Fig. 2A; [5]). Although the fetal/embryonic exon is bigger in teleosts than in tetrapods they have similar biochemical character-istics as it encodes an acidic peptide containing several glutamic acid residues (present study; [5,12]). No fTnT cDNA isoforms which give rise to 3' spliced variants and therefore proteins with differing C-terminal sequences are
observed in halibut, Tetraodon or S. auratus. Curiously, the deduced C-terminal amino acid sequence of all halibut
fTnT isoforms share greatest identity to tetrapod isoforms
containing the embryonic specific exon 17 [4,10,47,52]. Together with a previous study in teleosts [5] the present data in halibut seem to reinforce the idea that the occur-rence of alternatively spliced exons in the C-terminal region of the fTnT gene is a characteristic exclusive to ter-restrial vertebrates. Nonetheless, the genomic organiza-tion of fTnT genes in teleosts is identical to tetrapods [11] and from an evolutionary perspective, it seems likely that alternative splicing to generate N-terminal protein vari-ants of the fTnT gene in vertebrates already occurred before the divergence of actinoperigii and sarcopterigii vertebrate lineages.
An unexpected observation arising from the present study was the identification of a large (predicted MR 34.21 kDa),
Effect of T4 treatment on halibut TnT genes expression in pre-metamorphic larvae; Ethidium bromide gels showing expression of fTnThh (A), AfTnThh (B), sTnT2hh (C) and 18s rRNA genes in pre-metamorphic larvae treated for 10 days with T4 or untreated (control)
Figure 11
Effect of T4 treatment on halibut TnT genes expression in pre-metamorphic larvae; Ethidium bromide gels showing expression of fTnThh (A), AfTnThh (B), sTnT2hh (C) and 18s rRNA genes in pre-metamorphic larvae treated for 10 days with T4 or untreated (control). Graphs on the right side of gel images represent fTnThh and AfTnThh isoform expression and sTnT2hh expression in relation of 18s rRNA in control and T4 treated pre-metamorphic (stg 5) halibut larvae for 10 days. *- represents significant statistical differences between efTnThh expression in control and T4 treated halibut larvae (HSD, p < 0.05). No ref-erence signifies no significant statistical diffref-erence (HSD, p > 0.05).
highly acidic (predicted pI 5.07) halibut skeletal muscle
TnT (AfTnT) gene with high sequence identity to D. rerio fTnTa gene [7]. A homologue of this TnT gene was found
in Tetraodon together with five splice variants and despite its unusual characteristics it had a similar organization to other vertebrate TnT genes [4,7,10-13,19,38-52]. The highly acidic nature of the protein isoforms encoded by this gene is a consequence of splicing in of exon V which encodes a very acidic stretch (~50 aa) of amino acids. Regardless of the fact that both sequence similarity and phylogenetic analysis categorise the putative AfTnThh protein as a fast TnT the tissue expression analysis (Fig. 3) indicates that the AfTnT is a red muscle specific gene in halibut. This is the first time to our knowledge that a gene presumed to be fast muscle specific in vertebrates is exclu-sively expressed in red muscle. The observations of TnTs in halibut and zebrafish [7] indicate that despite the appar-ent anatomical simplicity of striated skeletal muscle in tel-eosts, at the molecular level they have novel adaptations that probably underline species-specific control mecha-nisms of muscle development.
Halibut TnT genes expression during metamorphosis
The expression of AfTnThh and sTnT2hh transcripts does not appear to change at climax of metamorphosis, although changes in the expression of fTnT gene isoforms do coincide with this developmental stage in halibut. The transition in expression of fTnT isoforms is correlated with the increase in whole-body T3 and T4 levels and the downregulation of efTnThh (Fig. 5) In turn, TH levels cor-relate positively with the increase in expression of
fTnThh-2 (Fig. 5, 9 and 10). A similar situation also occurs in
other flatfish, Paralichthys olivaceus [25], Solea solea and
Scophthalmus maximus [53] and at the climax of
metamor-phosis an acidic efTnT isoform is downregulated and lower molecular weight and more basic isoforms are upregulated, and detected in juvenile and adult white muscle.
The changes in fTnT isoform expression in different tele-ost (present study, [5,25,53]) are reminiscent of what occurs in tetrapods in which fetal acidic fTnT isoforms are downregulated immediately after birth and are substi-tuted by basic adult isoforms [10,54,55]. Moreover, a common mechanism of alternative splicing of 5' exons in the fTnT gene in teleosts, birds and mammals, implied by similar codon splitage combinations [5,11], further rein-forces the hypothesis that alternative splicing of the fTnT gene is conserved and occurs in order to cope with similar developmental demands on muscle in all vertebrates. The transition from acidic to a basic isoforms in fTnT genes seems to be a common trend in vertebrates and represents a physiological, mechanistic and functional adaptation of developing striated muscle [3,10,22,23]. This strong con-servation suggests that the same factors responsible for
fTnT isoform transition during development are common
throughout vertebrates and may be a trait acquired long before the divergence of the actinoperigii and sarcopterigii vertebrate lineages. In fact, teleost muscle and tetrapod muscle face similar physiological and biochemical changes during development. Foetal mammalian muscle grows by hyperplasia up until birth and muscle fibres are mainly glycolytic while the mainly oxidative adult muscle fibres, that differentiate after birth, express predominantly basic fTnT isoforms [51]. In teleosts, the muscle fibres also change their biochemical and physiological characteristics during development and up until metamorphosis white muscle is the major respiratory surface of the larvae and fibres are mainly aerobic and rich in mitochondria whereas the adult muscle fibres are mainly anaerobic [56-62].
As shown by others, and in contrast to tetrapod post-embryonic muscle development, in teleost species of large size, like the halibut, post-embryonic muscle develop-ment takes place in two steps in which hyperplasia is the main mechanism of muscle growth [36,56,58,60,61,63,64]. The first hyperplasic phase of post-embryonic muscle development in large size teleost larvae is characterised by proliferative epaxial and lateral areas of the myotome and as animals reach the juvenile stage these regions are depleted and a second stage of hyperplasic growth continues in scattered myogenic cells throughout the myotome. Notably, the efTnThh isoform is mainly found at the most epaxial and lateral zones of hal-ibut pre-metamorphic larval white muscle myotome, especially in small diameter white muscle fibres (Fig. 8 and 9A–E and A'-E'). The early differentiated halibut lar-vae white-muscle myoblasts appear to first express pre-dominantly efTnT and as they mature and are incorporated in the myotome expression is downregu-lated and other fTnT isoforms take their place. In verte-brates the embryonic to adult fTnT isoforms pattern of change is related to alterations in cellular pH, metabolic and physiological characteristics of maturing muscle fibres [3,10,22,23]. The transition from acid to basic pI fTnT isoforms in developing halibut muscle may be asso-ciated with the transition from proliferative small diame-ter muscle cells to more basic larger white muscle fibres. In fact, in S. auratus it was found that larval small diameter myoblast cells located in the hyperplasic lateral and epax-ial region of the larval myotome contain acid mATPase activity whereas mature large diameter muscle fibres have mild alkali mATPase activity [36]. Together with the downregulation of expression of efTnThh at halibut meta-morphosis these hyperplasic proliferative areas of the myotome are gradually depleted just as metamorphosis starts and totally absent in animals entering climax (Fig. 8 and 9A–E and A'-E'). This resembles the situation in S.
apical hyperplasic white muscle germinative areas are depleted [65]. However, and in contrast to what occurs in
S. auratus [5], the treatment of pre-metamorphic halibut
larvae with T4 shows that thyroid hormones control the expression profile of fTnT isoforms in the halibut and also in other flatfish [25].
The relationship between THs and change in fTnT isoform expression has yet to be directly demonstrated in teleosts. It is notable that despite the accepted role of THs in driv-ing flatfish metamorphosis and the change from a sym-metrical larvae to an asymsym-metrical juvenile, the way in which muscle symmetry changes has been largely ignored. In the present study muscle development was found to be a bilaterally symmetrical process before, during and after metamorphosis as revealed by histology and in situ gene expression studies. Nonetheless, the changes in TnT iso-form expression in halibut, S. solea, S. maximus and P.
oli-vaceus indicate muscle is TH responsive [53,25] as has
been demonstrated in mammals. In rats T3 increased the expression of Ca2+ ATPase specifically in white muscle fibres and the increase in relaxation rate of post-embry-onic white muscle was strictly dependent on THs [66]. Moreover, in mammals THs are necessary to complete development of skeletal muscle [67]. The results from experiments in teleosts suggest that various post-embry-onic muscle development mechanisms exist. For example, in S. auratus [5] slow muscle seems to be more sensitive to THs than white muscle, whereas in halibut, expression of the slow-muscle specific genes sTnT2hh and AfTnThh does not alter during metamorphosis (when endogenous T4 levels rise) or in response to exongenous T4 (Fig. 6, 7 and 11).
Conclusion
Together with previous studies in teleost TnT genes [6,7,25,53] the present work shows that teleost muscle, although apparently simpler and having a smaller number of specialized muscles in comparison to tetrap-ods [3,4] shows remarkable genetic heterogeneity and species-specific regulation. The diversity of TnT forms in teleost muscle arise from alternative splicing but also from a new teleost specific TnT gene and this heterogeneity probably contributes to better adapt the musculature to the specific functional demands of different teleost spe-cies. In common with other flatfish, but in contrast to the round fish, S. auratus [5], the halibut fTnT gene isoform expression profile is regulated at metamorphosis by THs, although halibut red muscle specific genes seem to be insensitive. Interestingly, the asymmetry arising during flatfish metamorphosis does not extend to the muscula-ture and the temporal and spatial expression patterns of
TnT genes and muscle fibre organization remains
sym-metrical before, during and after metamorphosis (Fig. 8 and 9). Clearly THs regulate muscle development but far
more work is required to establish the specific molecular and cellular events during flatfish and round fish muscle development.
Methods
TnT cDNA library screening
A lambda phage cDNA library made from metamorphos-ing larvae of halibut was plated in densities rangmetamorphos-ing from 1,000–5,000 plaque forming units (pfu). A probe was obtained for skeletal TnT by randomly isolating and sequencing 10 clones. A putative halibut fTnT obtained in this way was used as a probe for cDNA library screening or alternatively a PstI/EcoRI digested cDNA fragment from a sea bream sTnT2 gene (sTnT2sb)[6] was utilised. In each screen using the halibut fTnT or the sTnT2sb probe, nitro-cellulose membrane lifts were performed and membranes pre-hybridized for 2 hours, respectively, at 65°C or 60°C in hybridization solution (6×SSC, 0.1%SDS, 100 µg/mL tRNA, 5× Denhardt's). DNA probes were labelled with [32P] by random priming (Megaprime, random labelling kit, Amersham Biosciences, UK) and purified on a sepha-dex column. Radioactively labelled probes were diluted in new hybridization mix and allowed to hybridize over-night with the membranes. Two post-hybridisation strin-gency washes were carried out for ~30 minutes at room temperature (1×SSC, 0.1%SDS) followed by two 30 minute washes (1×SSC, 0.1%SDS) at 65°C or 60°C, respectively. Membranes where then exposed overnight at -80°C to Biomax MS film (Kodak, Palo Alto, CA, USA) and several positive plaques were isolated and automati-cally excised into pBluescript SK+/- (Stratagene), DNA purified and cDNA clones sequenced to give 3-fold cover-age using BigDye Version 3 (Perkin-Elmer, UK) chemistry and an ABI 3700 sequencer.
Phylogenetic analysis
The identity of the halibut TnT cDNA isolated was assigned by tBLASTx analysis [27] against GenBank and the Medaka (Oryzia latipes) EST database [68]. All tetrapod and teleost TnT cDNA sequences were retrieved and their deduced amino acid sequence compared to that of halibut TnTs using ClustalX software [31]. The phylogenetic rela-tionship of halibut TnT genes with other vertebrate TnT genes was analysed using the maximum-parsimony method option of PAUP* version 4.0b software [34] with 1000 bootstraps [35] and TnT sequences available from databases (Table 1). Caenorhabditis elegans striated muscle TnT (GenBank accession no. NP509076.1) was used as outgroup. All the sequences obtained during this study have been submitted to EMBL/GenBank data library under the accession numbers DQ680172 to DQ680179 (corresponding respectively to sTnThh2, efTnThh, fTnThh-1, fTnThh2, AfTnThh-1, AfTnThh-2, AfTnThh-3 and AfTnThh-4).
Putative genomic organisation of halibut TnT genes
The putative genomic organisation of isolated halibut TnT genes was established in silico using the Tetraodon
nigro-viridis genome database [69]. The Tetraodon scaffolds
giv-ing the most significant hit by tBLASTx analysis [27] with the halibut TnT sequences were recovered. Pairwise align-ment of halibut and Tetraodon TnT cDNA sequences with the selected Tetraodon scaffold using Spidey mRNA-to-genome software [32] permitted identification of the putative exon/intron boundaries of the halibut TnT genes
Animal sampling
Atlantic halibut at different developmental stages (Saele et al. 2004) ranging from pre-metamorphic larvae to fully metamorphosed juveniles were obtained from Fiskey (Ice-land). Animals (n = 10) were anesthetized in MS-222
(Sigma) and immediately collected for total RNA extrac-tion by preservaextrac-tion in RNAlater (QIAgen, UK) according to the manufacturers instruction. An adult halibut was anesthetised in MS-222 (Sigma-Aldrich, UK) and killed by decapitation and white muscle, red muscle, heart and liver were immediately collected into RNAlater (QIAgen) according to the manufacturers instructions. Alternatively, for in situ hybridization and histology anaesthetized hali-but larvae and juveniles were fixed in paraformaldehyde (4% PFA) at 4°C overnight. Samples were subsequently washed twice for 5–10 minutes with PBT and stored in 100% methanol at 4°C. Samples where embedded in par-affin and 5 µm post-anal transverse section were made from each animal.
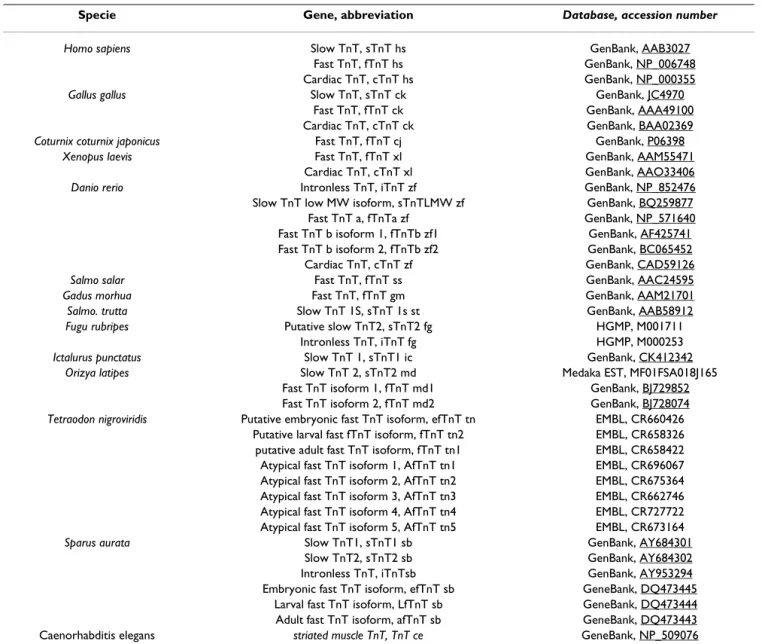
Table 1: Vertebrate TnT sequences used in phylogenetic analysis
Specie Gene, abbreviation Database, accession number
Homo sapiens Slow TnT, sTnT hs GenBank, AAB3027 Fast TnT, fTnT hs GenBank, NP_006748 Cardiac TnT, cTnT hs GenBank, NP_000355 Gallus gallus Slow TnT, sTnT ck GenBank, JC4970
Fast TnT, fTnT ck GenBank, AAA49100 Cardiac TnT, cTnT ck GenBank, BAA02369 Coturnix coturnix japonicus Fast TnT, fTnT cj GenBank, P06398
Xenopus laevis Fast TnT, fTnT xl GenBank, AAM55471 Cardiac TnT, cTnT xl GenBank, AAO33406 Danio rerio Intronless TnT, iTnT zf GenBank, NP_852476 Slow TnT low MW isoform, sTnTLMW zf GenBank, BQ259877 Fast TnT a, fTnTa zf GenBank, NP_571640 Fast TnT b isoform 1, fTnTb zf1 GenBank, AF425741 Fast TnT b isoform 2, fTnTb zf2 GenBank, BC065452 Cardiac TnT, cTnT zf GenBank, CAD59126 Salmo salar Fast TnT, fTnT ss GenBank, AAC24595 Gadus morhua Fast TnT, fTnT gm GenBank, AAM21701 Salmo. trutta Slow TnT 1S, sTnT 1s st GenBank, AAB58912 Fugu rubripes Putative slow TnT2, sTnT2 fg HGMP, M001711
Intronless TnT, iTnT fg HGMP, M000253 Ictalurus punctatus Slow TnT 1, sTnT1 ic GenBank, CK412342
Orizya latipes Slow TnT 2, sTnT2 md Medaka EST, MF01FSA018J165 Fast TnT isoform 1, fTnT md1 GenBank, BJ729852 Fast TnT isoform 2, fTnT md2 GenBank, BJ728074 Tetraodon nigroviridis Putative embryonic fast TnT isoform, efTnT tn EMBL, CR660426
Putative larval fast fTnT isoform, fTnT tn2 EMBL, CR658326 putative adult fast TnT isoform, fTnT tn1 EMBL, CR658422 Atypical fast TnT isoform 1, AfTnT tn1 EMBL, CR696067 Atypical fast TnT isoform 2, AfTnT tn2 EMBL, CR675364 Atypical fast TnT isoform 3, AfTnT tn3 EMBL, CR662746 Atypical fast TnT isoform 4, AfTnT tn4 EMBL, CR727722 Atypical fast TnT isoform 5, AfTnT tn5 EMBL, CR673164 Sparus aurata Slow TnT1, sTnT1 sb GenBank, AY684301
Slow TnT2, sTnT2 sb GenBank, AY684302 Intronless TnT, iTnTsb GenBank, AY953294 Embryonic fast TnT isoform, efTnT sb GeneBank, DQ473445
Larval fast TnT isoform, LfTnT sb GeneBank, DQ473444 Adult fast TnT isoform, afTnT sb GeneBank, DQ473443 Caenorhabditis elegans striated muscle TnT, TnT ce GeneBank, NP_509076
For radioimmunoassay five individual samples were col-lected for each stage, anesthetised in MS-222 (100ng/mL, Sigma-Aldrich) and immediately frozen in dry ice.
Total RNA extraction
Total RNA was extracted from whole-body metamorphos-ing larvae and 100 mg of adult halibut tissue usmetamorphos-ing Tri rea-gent (Sigma-Aldrich) according to the manufacturer's instructions, quantified in a GeneQuant (Amersham Bio-sciences) spectrophotometer and stored at -80°C until use.
Northern Blot
Three micrograms of total RNA obtained from adult hali-but white muscle, red muscle, heart and liver where frac-tioned on a 1.5% agarose/5.5% formaldehyde gel which was run in 1× MOPS. RNA was transferred to nylon Hybond-N membranes (Amersham Biosciences) with 10× SSC overnight and cross-linked using UV light (Stra-talinker, Stratagene). Hybridisations were carried out using 3'UTR probe prepared from each cloned halibut TnT gene (~10 µg) by digestion for 2 hours at 37°C with 10U of appropriate restriction enzyme (Promega) and 1× buffer (Table 2). The resulting DNA for probes was puri-fied by electrophoresis followed by extraction of DNA using the GFX gel band extraction kit (Amersham Bio-sciences).
Individual membranes were hybridized overnight at high stringency (65°C in 6×SSC, 5× Denharts solution, 100 µg/ mL tRNA and 0.1%SDS) with its respective 32 P-dCTP-labeled halibut TnT probe. The membranes were then washed twice for 30 minutes at room temperature (1×SSC and 0.1%SDS) followed by two 30 minute high strin-gency washes (65°C in 1×SSC and 0.1%SDS) and exposed at -80°C to Biomax MS film (Kodac, USA).
Semi-quantitative RT-PCR analysis of TnT expression during halibut metamorphosis
In order to determine expression of halibut TnT genes dur-ing metamorphosis a semi-quantitative RT-PCR assay was developed. For that, 0.5 µg of total RNA were DNased with the Ambion DNA Free kit (Ca, USA), according to the manufacturers instruction, and used for first strand cDNA synthesis which was carried out in a 20 µL volume using 0.05 M Tris-HCl, pH8.3, 0.075 M KCl, 3 mM MgCl2, 0.01 M DTT, 1 mM dNTP, 5 pmol/µl random hexamer
primers, 4U of RNAse inhibitor (Promega, UK) and 10U of Superscript II reverse transcriptase (Invitrogen, UK). Synthesis reactions were carried out in an iCycler thermo-cycler (Perkin Elmer) for 10 minutes at 25°C followed by 50 minutes at 42°C and heating for 2 minutes at 70°C ter-minated synthesis. Five individual cDNA synthesis reac-tions corresponding to five individual animals per stage were performed.
Initial RT-PCR amplifications with primers specific for each halibut TnT gene were conducted to determine opti-mal cycle number and ensure that amplification occurred in the logarithmic phase of the reaction. The expression of
18s ribosomal RNA (rRNA) was used as an internal
stand-ard for normalisation.
RT-PCR analysis of halibut TnT genes was carried out in a 25 µl reaction volume containing ~20 ng of cDNA for each sample and 1.5 mM MgCl2, 0.1 mM dNTP's, 1 pmol/ µl of halibut specific TnT gene forward and reverse primer (Table 3) and 0.6U Taq polymerase (Sigma-Aldrich). Primers for all the halibut TnT genes analysed were selected to amplify the entire N-terminal region, which in terrestrial vertebrates [4] and sea bream [5,6] undergoes alternative splicing. The forward primer was located in the 5'UTR region of the isolated halibut TnT cDNAs. The reverse primer was designed in a constitutively expressed region of the halibut TnT cDNAs.
The PCR reactions were performed in an iCycler (Perkin Elmer) thermocycler, using the following cycle; 1 minute at 95°C followed by 27 cycles, for fTnThh and sTnT2hh, or 28 cycles, for AfTnThh of; 30 seconds at 95°C, 1 minute at 56°C and 30 seconds at 72°C, followed by a final step of 1 minute at 72°C. Negative reactions without sample cDNA were also performed.
Table 3: Primer sequence and concentration used for RT-PCR analysis of fTnThh, TnThh and sTnT2hh during halibut metamorphosis.
Gene Forward Primer Reverse Primer
fTnThh TCTCAGGTTGCAAAGTCCAC GACGCTTCTCAATCCTGTCC
AfTnThh CTCTGAGGTGTGAAGTCTG CTCGACGCTTCTCAATTCGATC
sTnT2hh ATCTTGCTGAGCTCATTCAT ACGCTGATCCTCCATCTCC
Table 2: Restriction enzymes used to produce 3'UTR probes for northern blot hybridization.
Gene Restriction enzyme Probe size (bp)
fTnThh PstI/XhoI 492
AfTnThh PstI 364
Amplification of the housekeeping gene 18s rRNA used for normalisation was carried out as described above using 1 pmol/µl of forward and reverse primer (5'-TCAA-GAACGAAAGTCGGAGG-3' and 5'-GGACATCTAAG-GGCATCACA-3' respectively). The thermocycle utilised was: 1 minute at 95°C followed by 16 cycles of 30 seconds at 95°C, 1 minute at 56°C and 30 seconds at 72°C, fol-lowed by a final step of 1 minute at 72°C. All RT-PCR reaction products were fractionated on 2.5% agarose gels and analysed by densitometry using LabWorks software, version 4.5 (Ultra-Violet Products Cambridge, UK). Results are expressed as the mean and standard error of five independent samples.
In situ hybridisation
The developmental ontogeny of halibut muscle was char-acterised using 5 µm post-anal transverse section from several larvae from each stage. Several sections per fish were dewaxed, rehydrated and stained using haematoxy-lin and eosin and mounted in DPX reagent (Sigma-Aldrich).
The spatial-temporal expression pattern of halibut fTnT gene, and its efTnT isoform, sTnT2 and AfTnThh in meta-morphosing halibut larvae and post-metamorphosed juveniles was investigated by in situ hybridisation using specific digoxygenin riboprobes. For fTnThh gene expres-sion a 582 bp riboprobe for the conserved 3'UTR region in all fTnThh isoforms was generated. The expression of
efTnThh isoform was established by generating a
ribo-probe complementary to the embryonic/larval exon (aa 12 to 68). AfTnThh gene expression was established using a 641 bp riboprobe complementary to the constitutive 3' coding region and the 3'UTR of the AfTnThh cDNA. Ribo-probes were generated by linearising AfTnThh cDNA clones with the appropriate restriction enzyme for 1.5 h at 37°C and isolating the linearised vector by phenol (pH 8) extraction and precipitation in 3 M sodium acetate (pH 5) and ethanol overnight at -20°C.
Specific riboprobes were generated by in vitro transcrip-tion using the linearized vector as template and was car-ried out using 20U of T7 RNA polymerase or SP6 RNA polymerase in the case of efTnThh, in transcription buffer (Promega) with 1 µl of digoxigenin-RNA labelling mix (Roche Diagnostics, Mannheim, Germany), for 1.5 h at 37 °C. The reaction was stopped with 2 µl of 0.2 M EDTA. The digoxygenin labelled riboprobes were purified by lith-ium precipitation and ressuspended in 25 µl of water. Riboprobe purity and concentration were determined by fractionation of reaction products on an agarose gel (1.5%). To assess potential cross hybridization between probes and target sequences dot blots were performed. Each digoxygenin labeled riboprobe was hybridized with all the halibut TnT target sequence, no cross hybridization
reactions were detected and each probe was found to be specific for its target template.
For in situ hybridisation experiments adjacent transverse tissue sections of halibut larvae were dewaxed, rehydrated and then prehybridised at 58°C for 2 h in hybridisation solution without probe (50% formamide, 4× SSC, 1 mg ml-1 torula RNA, 0.1 mg ml-1 heparin, 1× Denhardt's, 0.04% CHAPS). Tissues were then hybridised overnight in a humidified box at 58°C in 100 µl per section of hybrid-isation solution containing approximately 2 ng µl-1 of the riboprobes. Control sections were pretreated with RNase prior to hybridization with riboprobes or the riboprobes were excluded from the hybridizations.
Stringency washes were 3 × 5 min at 58°C with 2× SSC and 5 min at 58°C in 1× SSC. Tissue sections were then washed 2× 5 min with 2× SSC:0.12% CHAPS at RT, fol-lowed by a wash for 5 min in 2× SSC:PTW (1:1, v/v) and finally 5 min in PTW. Blocking was performed by incuba-tion in blocking reagent (Boehringer Mannheim, Ger-many) with 10% heat inactivated sheep serum, detection of hybridised probe was carried out using sheep anti-dig-oxigenin-alkaline phosphatase (AP) Fab fragments (1/ 600) (Roche, Lisbon, Portugal). The chromagens for col-our detection were NBT (4-nitroblue tetrazolium chlo-ride) and BCIP (5-bromo-4-chloro 3-indolylphosphate) and colour development was carried out over 2 h at 38°C. Stained sections from in situ hybridisation were rinsed in PBS, fixed for 15 min in 4% formaldehyde at room tem-perature, rinsed in PBS and mounted in glycerol gelatine. Histological and in situ sections were analysed using a microscope (Olympus BH2) coupled to a digital camera (Olympus DP11) linked to a computer for digital image analysis.
Radioimmunoassay for thyroid hormones
Larval extracts were used to assess T4 and T3 content of whole larvae by radioimmunoassay (RIA) using a double-antibody method under equilibrium conditions.
Frozen larvae (n = 8 per stage) were extracted individually in 50 µl methanol, 200 µl chloroform and 100 µl barbital buffer, centrifuged (3,000 rpm for 30 min at 4°C) and the upper phase removed, lyophilized, reconstituted in assay buffer, heat denatured (75°C for 2 hours) and assayed. Standard curves were prepared with T4 or T3 standards (Sigma-Aldrich) dissolved in 0.1N NaOH and diluted to appropriate concentrations in assay buffer. T3 and T4 assays were conducted in barbital buffer (0.07 M, pH 8.6) and Tris buffer (0.1 M, pH 7.4), respectively, and con-tained 0.1% BSA and 0.1% sodium azide. In both RIA, either 100 µl of standard or larval extract was added. For both hormones, the total assay volume was 300 µl and
included 100 µl of 125I-T3 (Amersham Biosciences, Buck-inghamshire, UK) or 125I-T4 and 100 µl T3 antisera (1:15,000, Sigma-Aldrich) or T4 antisera (1:10,000, Sigma-Aldrich). Antisera were added to all tubes apart from those to determine total count (cpm) and non-spe-cific binding. The T3 and the T4 assays were incubated for 16–24 h at 4°C and subsequently, the free hormone was separated from the bound hormone using precipitation with a second antibody [70].
Two-way analysis of variance (ANOVA) was performed in order to establish if significant differences in the concen-tration of T4 or T3 were detected between different meta-morphic stages. If the two-way ANOVA detected significant differences in T4 or T3 between stages the Holm-Sidak (HSM) multiple comparison analysis was performed to determine which stages have different T4 or T3 levels. Both T4 and T3 concentration values were trans-formed using the logarithmic function before statistical analysis. Significance was considered if p < 0.05. All statis-tical analysis was performed using SigmaStat version 3 software (SPSS Corp.)
T4 treatment and halibut TnT expression
Pre-metamorphic halibut larvae (stage 5) were treated for 10 days with T4 (Sigma-Aldrich). The halibut larvae were maintained in 100 L vessels with sea water at 10.5°C. The waterflow was kept at around 0,3 l/min, with the oxygen level at full saturation and disinfected clay dissolved in water was put in the tanks prior to each feeding to shade the environment and ensure maximum feed uptake and the right distribution of light in the tanks.
The hormone (T4) was administered by feeding the larvae T4-enriched artemia and control animals were fed with unenriched artemia. In order to enrich the artemia a solu-tion (1 mg/ml) of sodium-pentahydrate salt of thyroxin (3-(4-(hydroxy-3,5-diiodophenoxy)-3,5-diiodophenyl)L-alanine, Sigma T2501) was prepared in distilled water. Artemia was enriched using 1 ml of T4 stock per liter of artemia (each liter containing 300.000 artemia naupli). T4-enriched artemia was fed to the larvae in the afternoon (2/3 of the total feedings) but in the morning the larvae were fed regular artemia (only 1/3 of the total feedings). The experiment lasted for 10 days. Samples of the artemia were taken and RIA for T4 was performed to validate the uptake of T4 by the artemia which contained a T4 concen-tration of 2 µg T4/g artemia.
At the end of the experiment animals were anesthetized with MS-222 (Sigma-Aldrich) and immediately fixed in RNAlater (Sigma-Aldrich) and kept at -20°C until analy-sis. Four individual treated and control larvae were used for RNA extraction and first strand synthesis reactions which were carried out as described previously. All
exper-iments and animals collection were performed in accord-ance with EU legislation for Animal Welfare.
RT-PCR for fTnThh, AfTnThh, sTnT2hh and 18s rRNA was performed with the primers and conditions described pre-viously. Results are presented as the ratio between the gene of interest and 18s. Results are presented as the mean expression of fTnThh, AfTnThh and sTnT2hh of four indi-vidual larvae from control and T4 treated groups. One-way ANOVA was performed to determine if statistically significant differences in halibut TnT gene expression occurred between control and T4-treated animals. If one-way ANOVA gave significant differences between the con-trol and the T4-treated group in any of the halibut TnT genes analysed a multiple comparison test was performed using the Holm-Sidak multiple comparison test (HSD). All statistical analysis was performed using SigmaStat ver-sion 3 software (SPSS Corp.) and significance was consid-ered at p < 0.05.
Abbreviations
TnT- Troponin T AfTnT- Atypical fast TnT fTnT- fast muscle TnT sTnT- Slow muscle TnT iTnT- Intronless TnT TH- Thyroid hormone bp- base pairs kb- kilobase aa- amino acids kDa- kilodaltonsMHC- Myosin heavy chain MLC- Myosin light chain Tm- Tropomyosin UTR- Untranslated region stg- stage
Authors' contributions
MAC contributed to the devise of the experiments and acquisition and analysis of molecular data from the exper-iments, including all bioinformatics analysis, as well as drafting and revision of the manuscripts. NS carried out histological and microscopical data acquisition and