Article
, Vol. 29, No. 7, 1367-1372, 2018 Printed in Brazil - ©2018 Sociedade Brasileira de Química*e-mail: [email protected]; [email protected]
Prediction of Sulfur Content in Diesel/Biodiesel Blends Using LED-Induced
Fluorescence Associated with Multivariate Calibration
Alessandra T. Campos,*,a Cristina M. Quintella,*,a Marilena Meirab and Saionara Lunaa
aLabLaser, Instituto de Química, Universidade Federal da Bahia, Campus Ondina,
40170-290 Salvador-BA, Brazil
bInstituto Federal de Educação, Ciência e Tecnologia da Bahia (IFBA), Campus Simões Filho,
Via Universitária, s/n, Pitanguinhas, 43700-000 Simões Filho-BA, Brazil
The present paper concerns to predict the sulfur concentration in biodiesel/diesel blends in the range of 5-100 mg L-1 of sulfur using spectrofluorimetry and partial least squares multivariate
calibration (PLS). The calibration set consisted of samples with 10 and 20% (B10 and B20) of biodiesel in diesel with sulfur addition of 5-100 mg L-1. Two PLS models were constructed, one to
predict the concentrations of sulfur in B10 blends that presented coefficient of determination (R2)
values of 0.9867377 and 0.9801064, respectively, for calibration and validation. The other PLS model predict the concentrations of sulfur in B20 that presented R2 values of 0.9949219 and
0.8573713, respectively, for calibration and validation. Therefore, the models showed adequate efficiency to predict changes in the concentration of sulfur in biodiesel/diesel blends B10 and B20.
Keywords: biodiesel, multivariate analysis, spectrofluorimetry, sulfur, diesel
Introduction
Until recently, one of the main problems regarding to the emission of particulate matter was the high sulfur content in diesel fuel commercialized by the Brazilian automotive industry.1 Sulfur oxides are classified as
emission compounds which pose a risk to human health; however, they are subject to regulations.2 In Brazil, to
reduce the atmospheric pollution caused by the sulfur present in the petroleum derivative, this fuel has been produced with a lower sulfur content, gradually passing from S1800 (1800 mg kg-1 of sulfur) to S500 (500 mg kg-1
of sulfur), followed by S50 (50 mg kg-1 of sulfur) to S10
(10 mg kg-1 of sulfur).3
Diesel fuel is mainly composed of alkanes with 10 to 20 carbon chains, therefore, consisting mostly of long-chain saturated hydrocarbons. They also have aromatic compounds, alkylated cycloalkanes, and even compounds that feature heteroatoms, such as sulfur, nitrogen and oxygen. Benzothiophenes and dibenzothiophenes are among the sulfur compounds found in diesel fuel.4
There are reports of the determination of sulfur content in fuels using different analytical methods, namely:
energy-dispersive X-ray fluorescence, inductively coupled plasma optical emission spectrometry (ICP OES), inductively coupled plasma mass spectroscopy, atomic absorption spectroscopy and X-ray fluorescence spectrometry. With the results obtained it was possible to conclude that high sulfur containing diesel fuels were from heavy diesel engines and diesel fuel-like liquids obtained by thermal degradation of waste polymers.5
There are also procedures using inductively coupled plasma optical emission spectrometry (ICP OES).6,7 The
norms ISO 20884:20048 and ISO 20846:20119 are used
to determine sulfur content of automotive fuels using wavelength-dispersive X-ray fluorescence spectrometry and ultraviolet fluorescence method.
It was developed a procedure for the determination of total sulfur in petroleum and derivatives using ICP OES.10,11
For this procedure, the samples were prepared as emulsions. The developed procedure has allowed the determination of the total sulfur content with limit of detection (LOD) and limit of quantification (LOQ) of 0.72 and 2.4 µg g-1,6
It was developed a liquid phase micro extraction method for the determination of sulfur compounds in crude oil and diesel. The analyzes were performed by gas chromatography equipped with a sulfur chemiluminescence detector. Under optimal conditions, linearity was obtained for the extraction of sulfur compounds between 0.10 and 250 g mL-1 with a correlation varying from 0.98 to 0.99.12
It was applied the high-resolution continuum source molecular absorption spectrometry (HR-CS MAS) graphite furnace to determine the sulfur in diesel using palladium nanoparticles as a chemical modifier. The following figures of merit were obtained: 120 and 400 mg kg-1, LOD and
LOQ, respectively, R2 0.9972 and standard deviation of
1-5%. The accuracy of the method was evaluated with two reference samples.13
It was applied the atomic absorption spectrometry with graphite furnace for determination of sulfur in diesel with characteristic mass of 17 ± 3 ng and LOD and LOQ of 1.4 and 4.7 mg kg-1, respectively.14
Other example is an analytical method for the separation, identification, and quantification of sulfur-containing compounds and their groups in diesel fuels (170-400 °C) using comprehensive two-dimensional gas chromatography coupled to a sulfur chemiluminescence detector. Another application is quantitative analysis in major and total sulfur compounds performed based on the linear response of detector and the internal standards method. The results of the total sulfur determination in the samples were compared with those of the standard method ASTM D4294,15 with relative standard deviation (RSD)
percentages < 6.02%.16
Samples of diesel fuel with sulfur concentrations
varying from 400 to 2500 mg kg-1 were analyzed by
two methodologies: X-ray fluorescence according to ASTM D429415 and by Fourier transform infrared (FTIR).
The spectral data between 665 and 856 cm-1 and 1145 and
2717 cm-1 were used to construct partial least squares (PLS)
models.5,17,18
It was studied a methodology for the determination of sulfur, using enzymatic partial oxidation of sulfur compounds of diesel, followed by the selective determination of the sulfur content from the emission spectra of the oxidized diesel using simple regression analysis.19
These methods for the determination of sulfur, although precise and accurate, are generally expensive, and obtaining the analytical results is time-consuming when compared to the spectrofluorimetry method. Therefore, it is necessary to create a method that rapidly, accurately and cost-effectively informs whether there is compliance or not with the sulfur content stipulated by the current legislation at the time of fuel distribution. Methods using spectrofluorimetry
associated with multivariate calibration have been studied in other works and proved effective as analytical methods.20-22
The Brazilian standard NBR 14533:200023 determines
sulfur in petroleum products by X-ray fluorescence spectrometry. The standard describes the determination of sulfur in diesel using di-n-butylsulfide as the standard sample and the applicable sulfur concentration range is 0.0150 to 5.00% in mass.20
The present study used light emitting diode (LED)-induced fluorescence and partial least squares multivariate calibration (PLS) to predict the sulfur concentration in biodiesel/diesel blends in the range of 5-100 mg L-1 of sulfur.
Experimental
Samples
The biodiesel sample (B100) was provided by Petrobrás (Candeias, Bahia, Brazil) and was received on November 28, 2014. The diesel sample was provided by RLAM (Candeias, Bahia, Brazil) and received on January 16, 2015. Inorganic sulfur (S2) was purchased from
Vetec (Rio de Janeiro-RJ, Brazil).
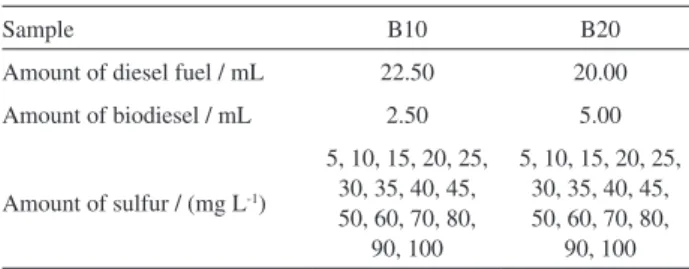
The data set consisted of two concentrations of biodiesel/diesel blends B10 and B20 with sulfur content in the range of 5-100 mg L-1, according to Table 1.
After addition of the inorganic sulfur in the samples, they were submitted to the ultrasonic bath (Quimis, Diadema, São Paulo, Brazil) for a period of 15 to 20 min depending on the added concentration of sulfur.
Spectrofluorimeter
The blends were analyzed using a LED-induced fluorescence spectrometer (Quimis, model Q798FIL). These samples, which had not been subject to any previous treatment, were analyzed using the natural fluorescence of the fluids in 1 cm quartz cuvettes. In this work, the samples were scanned using a LED spectrofluorimeter, equipped
Table 1. Biodiesel and diesel fuel concentrations
Sample B10 B20
Amount of diesel fuel / mL 22.50 20.00
Amount of biodiesel / mL 2.50 5.00
Amount of sulfur / (mg L-1)
5, 10, 15, 20, 25, 30, 35, 40, 45, 50, 60, 70, 80,
90, 100
5, 10, 15, 20, 25, 30, 35, 40, 45, 50, 60, 70, 80,
with violet LED as the excitation source and the emission was detected from 335-1000 nm with intervals of 0.38 nm (2048 wavelength).
Multivariate calibrations
Two regression models were developed in this study. Each PLS model was built using mean-centered fluorescence spectra as independent variables and the measured corresponding values of sulfur content. The calibration models were constructed using the software Unscrambler 10.0.1. The number of latent variables for PLS was based on the validation error using the default software. The general matrices with dimension 15 × 2048 were used to construct the mathematical models using PLS. For the calibration step, the relationship between the spectra and sulfur content was estimated from a set of reference samples. In the prediction step, the results from the calibration were used to estimate the concentration of sulfur from an unknown sample spectrum.
Results and Discussion
PLS is a very convenient tool for constructing predictive models. In general, it is used on predicting the responses and not to understand the underlying relationship between the variables. PLS converts a set of highly correlated variables to a set of independent variables. PLS is, in general, performed in two steps. The first step involves calculating a PLS regression model for a sample data set. The second step involves validating this model with a different set of data. Coefficient of determination (R2) values indicates
the model’s ability to predict new responses. Origin software24 fitting model is by cross validation, which is the
leave-one-out method. Predicted residual sum of squares and its root mean are used to find the optimal number of
factors by cross-validation.
Calibration of the PLS model
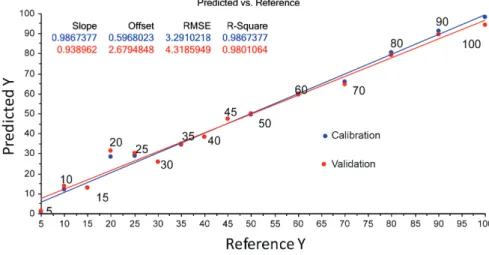
The PLS model shown in Figure 1 was constructed using the fluorescence data as the independent variable and the sulfur content in the B10 samples as the dependent variable. Table 1 shows the sulfur concentrations added to the B10 biodiesel/diesel blend (15 samples).
The model presented high correlation between variables, with a correlation coefficient near to 1. In addition, the PLS model presented R2 values of 0.9867377
and 0.9801064, respectively, for calibration and validation. The R2 (R-squared) is defined as the proportion of
variance (%) in the dependent variable that can be explained by the independent variable. In others words, the R2 values
indicate the accuracy of the model to predict answers to new observations. Values closer to +1 suggest higher correlation between data. This PLS model showed good predictive capacity and can be used to predict the concentrations of sulfur in B10 blends. This validation is internal validation, where Origin software24 fitting model is by cross validation,
which is the leave-one-out method. In this case, the original calibration set also serves as a validation set.
External validation of the PLS model of samples B10
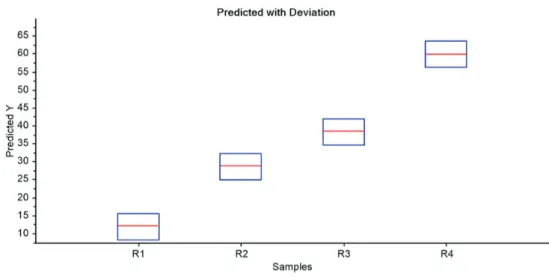
External validation consists in introducing new data to evaluate the predictive capacity of the PLS model. External validation is recommended for using unused samples in the construction of the calibration model. Figure 2 shows the plot of predicted value of sulfur content with deviation for four new samples of B10. The Table 2 shows mean deviations in 3.6 mg L-1 of sulfur.
The PLS model in Figure 3 was constructed using the fluorescence spectra as independent variables and
the sulfur content in the B20 samples as dependent variable. Table 1 shows the sulfur content added to the B20 biodiesel-diesel blend (15 samples). The PLS model presented a high correlation between variables, with a correlation coefficient near to 1. In addition, the PLS model presented a high correlation between the actual and predicted values according to the R2 values
(0.9949219 and 0.8573713, respectively, for calibration and validation). Based on these parameters, this model can be used to predict the concentrations of sulfur in B20 blends.
External validation of the PLS model of samples B20
Figure 4 shows the plot of predicted value of sulfur content and deviation for four new samples of B20. The Table 3 shows mean deviations in 9.587 mg L-1 of
sulfur. External validation shows that this PLS model has good predictive capacity and can be used to predict the concentrations of sulfur in B20 blends.
Conclusions
LED-induced fluorescence detection associated with PLS showed to be simpler and more cost-effective than other methods used to determine the presence of sulfur, such as infrared spectroscopy. In addition, it has the advantage of being easy to use for on-site analysis.
The coefficients of correlation and R-square values of the PLS models constructed with fluorescence data of samples B10 and B20 with sulfur addition in the range of 5-100 mg L-1
presented values near to 1. Therefore, PLS models showed
Table 2. Predicted value of sulfur content with deviation for four new samples of B10
Predicted / (mg L-1) Deviation / (mg L-1)
11.8741 3.6755
28.5859 3.6214
38.2049 3.6105
59.7544 3.6698
Figure 2. Predicted value of sulfur content and deviation for new samples of B10.
adequate efficiency to predict changes in the concentration of sulfur in biodiesel/diesel blends B10 and B20.
Acknowledgments
We acknowledge CAPES, CNPq and FAPESB for technological scholarships and grant support for this work.
References
1. Braun, S.; Appel, L. G.; Schmal, M.; Quim. Nova 2004, 27, 472.
2. Neeft, J. P. A.; Makkee, M.; Moulijn, J. A.; Fuel Process. Technol. 1996, 47, 1.
3. Agência Nacional de Petróleo, Gás Natural e Biocombustível (ANP); Resolução No. 65, de 9/12/2011, publicado no Diário Oficial da União (DOU) em 12/12/2011.
4. Speight, J. G.; Adv. Chem. Ser. 1996, 251.
5. Miskolczi, N.; Bartha, L.; Borszeki, J.; Halmos, P.; Talanta
2006, 69, 776.
6. Santelli, R. E.; Oliveira, E. P.; Carvalho, M. F. B.; Bezerra, M. A.; Freire, S. A.; Spectrochim. Acta, Part B2008, 63, 800. 7. Mello, P. A.; Barin, J. S.; Flores, E. M. M.; Talanta2015, 144,
1052.
8. ABNT NBR ISO 20884: Petroleum Products-Determination of Sulfur Content of Automotive Fuels-Wavelength-Dispersive
Table 3. Predicted value of sulfur content with deviation for four new samples of B20
Predicted / (mg L-1) Deviation / (mg L-1)
11.5002 9.9930
17.2999 9.6809
41.5431 9.6631
61.1040 9.0110
Figure 4. Predicted value of sulfur content and deviation for new samples of B20.
X-Ray Fluorescence Spectrometry, ABNT: Rio de Janeiro, 2000.
9. ABNT NBR ISO20846: Petroleum Products-Determination of Sulfur Content of Automotive Fuels-Ultraviolet Fluorescence
Method, ABNT: Rio de Janeiro, 2011.
10. Cruz, S. M.; Tirk, P.; dalla Nora, F. M.; Shmidt, L.; Wiltsche, H.; Bizzi, C. A.; Knapp, G.; Flores, E. M. M.; Fuel 2015, 160, 108.
11. Amais, R. S.; Donati, G. L.; Nóbrega, J. A.; Spectroscopy2014, 29, 24.
12. Al-Zarani, I.; Basheer, C.; Htun, T.; J. Chromatogr. A 2014, 1330, 97.
13. Nakadi, F. V.; Soares, A. L. C.; Veiga, M. A. M. S.; J. Anal. At. Spectrom. 2014, 29, 1871.
14. Barker, L. R.; Kelly, W. R.; Guthrie, W. F.; Enegy Fuels2008, 22, 2488.
15. ASTM D4294: Standard Test Method for Sulfur in Petroleum and Petroleum Products by Energy Dispersive X-Ray Fluorescence
Spectrometry, ASTM International: West Conshohocken, PA, 1998.
16. Hua, R.; Li, Y.; Liu, W.; Zheng, J.; Wei, H.; Wang, J.; Lu, X.; Kong, H.; Xu, G.; J. Chromatogr. A2003, 1019, 101. 17. Soares, I. P.; Rezende, T. F.; Fortes, I. C. P.; Ecl. Quim. 2010,
35, 71.
18. Breitkreitz, M. C.; Raimundo Jr., I. M.; Rohwedder, J. J. R.; Pasquini, C.; Dantas Filho, H. A.; José, G. E.; Araújo, M. C. U.; Analyst 2003, 128, 1204.
19. Aburto, P.; Zuñaiga, K.; Campos-Terán, J.; Aburto, J.; Torres, E.; Energy Fuels 2014, 28, 403.
20. Meira, M.; Quintella, C. M.; Ferrer, T. M.; Gonçalves, H. R.; Guimarães, A. K.; Santos, M. A.; Quim. Nova2011, 34, 621.
22. Meira, M.; Quintella, C. M.; Pepe, I. M.; Costa Neto, P. R.; Tanajura, A. S.; Silva, H. R. G.; Cent. Eur. J. Chem. 2012, 10, 1328.
23. ABNT NBR 14533: Produtos de Petróleo-Determinação de Enxofre por Espectrometria de Fluorescência de Raios X
(Energia Dispersiva), ABNT: Rio de Janeiro, 2000.
24. Origin, OriginLab; available at https://www.originlab.com/, accessed on December 18, 2017.
Submitted: March 24, 2017
Published online: December 19, 2017