Article
J. Braz. Chem. Soc., Vol. 26, No. 7, 1351-1356, 2015. Printed in Brazil - ©2015 Sociedade Brasileira de Química 0103 - 5053 $6.00+0.00
A
*e-mail: [email protected]
Determination of Adulterants in Diesel by Integration of LED Fluorescence Spectra
Marilena Meira,*,a Cristina M. Quintella,b Erika M. O. Ribeiro,b Humbervânia R. G. Silva,b Alexandre K. Guimarães,b Saionara Luna,b Weidson L. Silvab and Irlane J. de Britob
aInstituto Federal de Educação, Ciência e Tecnologia da Bahia, Campus Simões Filho,
43700-000 Simões Filho-BA, Brazil
bInstituto de Química, Universidade Federal da Bahia, Campus de Ondina,
40170-290 Salvador-BA, Brazil
This paper describes a simple and rapid methodology for determining the content of adulterants in diesel by the integration of fluorescence spectra. The procedure consists of constructing analytical curves using the concentrations of each adulterant in diesel and the relative change in the fluorescence area of each blend with respect to the fluorescence area of the diesel. The results indicated that the proposed method can be used to determine adulterants such as non-transesterified residual cooking oil, kerosene, and turpentine in diesel. The detection limits were 3, 4 and 5% for non-transesterified residual cooking oil, kerosene and turpentine in diesel, respectively. The method was also successfully used to determine the non-transesterified residual cooking oil content in B5 biodiesel-diesel blend (5% biodiesel) in the range of 0-70%, with a limit of detection of 4%.
Keywords: adulterants, diesel, LED fluorescence spectroscopy
Introduction
The intentional addition of adulterants, such as kerosene, turpentine, or non-transesterified residual cooking oil (RCO) to diesel has a negative effect on fuel properties and, consequently, on the engine performance, such as engine start-up control, engine heating, acceleration, and fuel consumption; it also increases the emission of particulate material, hydrocarbons, and exhaust gases.1
Patra and Mishra2 developed a method for detecting
diesel fuel contamination by excitation-emission matrix spectral subtraction fluorescence, which has good accuracy and sensitivity. However, it requires more expensive equipment, as an excitation-emission matrix fluorescence spectrum is collected in the excitation wavelength range of 250-500 nm within an interval of 5 nm and in the emission wavelength range of 300-600 nm within an interval of 5 nm. Corgozinho et al.1 also developed
a method with good accuracy and sensitivity for the determination of non-transesterified residual vegetable oil in diesel oil using a spectrofluorimetric technique. However, the method of Corgozinho et al. requires skill in chemometric analysis.1 Oliveira et al.3 reported
a method for the determination of the adulteration of diesel-biodiesel blends of vegetable oil by Fourier transform (FT) near-infrared (NIR) spectrometry and FT Raman spectroscopy. Vasconcelos et al.4 developed
a method based on NIR overtone regions to determine the biodiesel content and adulteration of diesel-biodiesel blends with vegetable oils. Pontes et al.5 reported screening
analysis to detect adulteration in diesel-biodiesel blends using NIR spectrometry and multivariate classification. Gaydou et al.6 developed a multiblock NIR/mid-infrared
(MIR) partial least squares (PLS) predictive model to detect the adulteration of diesel-biodiesel blends by vegetable oil. Roy7 reported a fiber-optic sensor for determining the
adulteration of petrol and diesel by kerosene. Raman and FTIR spectroscopy are techniques with good accuracy and sensitivity. However, Raman and FTIR spectrometers are more expensive than the equipment used in this work, and they also require specialized personnel to handle them.
In previous work, we developed a method and a sensor for monitoring the quality during processes for obtaining fuels using spectrofluorimetry and principal component analysis (PCA).8 The study also reported a method for
whose technology was transferred to the company Quimis and is now being marketed as the Model Q798FIL.
The Q798FIL is a single-beam UV-Vis spectrofluorimeter, which is compact with system of acquisition and processing of embarked data, lightweight, easy to handle, and robust in construction. The major advantage is the low cost of the equipment when compared with other spectroscopic apparatus, as the cost of Q798FIL is about three times less than an FTIR spectrometer and nearly four times less than a fluorescence spectrometer with a pulsed xenon lamp and 3D excitation-emission scans. Another advantage is the analysis time, as the signal integration time is between 1 ms and 65 s.
Despite the various sophisticated methods developed, it is essential to develop simpler methods that are less costly, but maintain the capability of detecting and quantifying adulterants in diesel, in order to help control the quality of the fuel. Spectrofluorimetry is one of the most sensitive techniques for determining several fluorescence compounds, especially aromatics that exhibit particularly intense fluorescence.10 Fluorescence in diesel is attributed to
the presence of polycyclic aromatic hydrocarbons (PAHs) of various ring sizes.11 The fluorescence of petroleum
products has been studied by several authors.1,2,9,11–17
The present paper describes a simple, fast, accurate, and low-cost methodology for determining adulterants such as kerosene, turpentine, and non-transesterified RCO contents in diesel by the integration of fluorescence spectra; this is based on the assumption that the fluorescence area caused by the presence of PAHs in a sample of neat diesel or diesel blended with non-transesterified RCO is quantitatively related to these PAHs of a similar standard. The present work is different from the method developed previously,9
owing to its simplicity, as it does not require covariant analysis and has the advantage of being able to quantify the adulterants.
Experimental
A sample of S50 diesel was supplied by Landulpho Alves Refinery (RLAM) located in São Francisco do Conde, Bahia State, Brazil. The sample of RCO was collected from restaurants, and was obtained following the frying of foods. Samples of kerosene and turpentine were purchased from a local market. Daily samples of used oils were collected throughout one month in a restaurant. The samples of RCO were mixed, homogenized, and filtered to extract any solid residues. After filtration, the RCO was immediately blended with diesel.
A known volume of diesel and each adulterant (kerosene, turpentine, or non-transesterified RCO) was pipetted in order to prepare the desired adulterated synthetic
mixture at concentrations of 0-100% (v/v). The standards were analyzed in triplicate without any fluorescent additive being used; the region of fluorescence for the aromatic compounds present in diesel was analyzed.9
The equipment used in this procedure was a Quimis Q798FIL LED fluorescence spectrometer with a quartz cuvette of 1 cm path length as well as one violet light-emitting diode (LED) centered at 400 nm as the excitation source. The emission range was 350-700 nm at intervals of 0.38 nm. The average values of triplicate spectral data were calculated, which were then integrated using Origin Pro8 software.
To assess the applicability of the fluorescence method in quantifying the adulterant content, an analytical curve was constructed using the concentrations of each adulterant in diesel and the relative change in fluorescence area of each blend with respect to the fluorescence area of the diesel (δ parameter). This relative change (δ), as a percentage, is calculated as δ = [(A0 – Ai) / A0 ] × 100, where A0 and
Ai are the integrated fluorescence areas of the diesel and
adulterated diesel, respectively.
Similarly, the proposed method was also used to determine the non-transesterified RCO content in a B5 biodiesel-diesel blend (5% biodiesel) in the range of 0-70%.
To determine the validity and variability of the analytical curve, predictions were made for the concentrations of samples that were not used in the construction of the individual analytical curves (external validation).
Results and Discussion
Figure 1 shows the spectra of the diesel and non-transesterified RCO after excitation with a violet LED and emission from 350 to 700 nm. The emission was concentrated in a range of 400-600 nm. Diesel oil presents two peaks of greater intensity at 452 and 480 nm, owing to the presence of PAHs, whereas the spectrum of non-transesterified RCO presents two peaks of greater intensity at 407 and 488 nm. Pure RCO produces an emission, but it is very minor when compared to the signal from pure diesel. The difference in signal intensity between RCO and diesel in the region of 400-600 nm is one of the reasons why the present method works. The sample of non-transesterified RCO has a variable composition, which includes animal fats, vegetable oils, food, refuse, and other organic material. However, the fluorescence region of non-transesterified RCO is concentrated in the range of 400-600 nm, which is the same fluorescence region for diesel when both are excited with a violet LED.
0-100% using the LED spectrofluorimeter. The emission was concentrated in a range between 400 and 600 nm, showing two bands; the first was initially centered at 452 nm and the second at 480 nm. The addition of non-transesterified RCO to diesel promotes a significant decrease in the intensity of the peaks of diesel. Figure 3 shows the reduction in the spectral areas (Table 1) with increasing non-transesterified RCO concentration, as the adulterants effectively dilute the diesel.
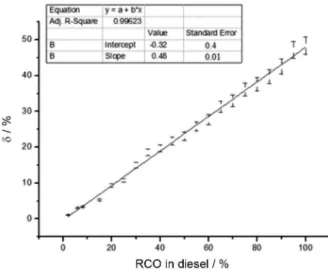
Using the procedure proposed in this paper for the spectra obtained with an LED spectrofluorimeter, we obtained a straight line, which increased in the plot of δ vs. non-transesterified RCO concentration with good linear correlation, R² = 0.99623 using all data (Figure 4) and R² = 0.99868 (Figure 5) when some samples were omitted for external validation (Table 2).
Similarly, the same procedure was performed for the other adulterants mixed with diesel. When comparing the
turpentine, kerosene, and diesel spectra, diesel is more fluorescent. This is expected, considering that both kerosene and turpentine are formed predominantly from paraffinic hydrocarbons and diesel has a higher concentration of aromatic hydrocarbons. We obtained a straight line, rising in the plot of δvs. the concentration of kerosene in diesel and the concentration of turpentine in diesel, with R2 = 0.99834
(Figure 6) and R2 = 0.9976 (Figure 7), respectively. Table 1. Integrated spectral areas of diesel and mixtures of RCO and diesel, as well as the relative changes in fluorescence area of each blend with respect to the fluorescence area of the diesel (δ parameter)
Residual oil in diesel Spectral area δ / %
0 261222.6 0
2 258478.7 1.05
6 253151.7 3.09
8 252566.6 3.31
15 247393.2 5.29
20 236836.5 9.34
25 233117.9 10.76
30 222139.2 14.96
35 212757.3 18.55
40 209814.5 19.68
45 204319.3 21.78
50 200818.2 23.12
55 193699.7 25.85
60 188878.5 27.69
65 179500.5 31.28
70 175080.9 32.98
75 166975.9 36.08
80 163136.2 37.55
85 157585.5 39.67
90 150066.8 42.55
95 137899.9 47.21
100 135082.3 48.29
Figure 1. Spectrum of diesel and RCO after excitation with a violet LED, with emission from 350 to 700 nm at intervals of 0.38 nm, which were obtained using a Quimis model Q798FIL spectrofluorimeter.
Figure 2. Spectrum of mixtures of RCO in diesel excited with violet LED and emission from 350-700 nm at intervals of 0.38 nm obtained in a Quimis model Q-798FIL spectrofluorimeter.
To determine the validity and variability of the method, predictions were made for the concentrations of samples that were not used in the construction of each analytical curve through Student’s t-test, which was applied to the actual concentrations of adulterant in the diesel and those concentrations predicted by the linear equations of each curve. For RCO in diesel, a calculated t-value of –0.336738 (Table 2) was found.
The t-value calculated for nine degrees of freedom was –2.262. Thus, it follows that the Student’s t-test showed no significant difference at 95% confidence between the actual and the predicted concentrations of non-transesterified RCO in diesel.
Similarly, the Student’s t-test showed no significant difference at 95% confidence between the actual and the
Table 2. External validation by application of the Student’s t-test for paired data of RCO in diesel
Actual RCO in diesel / %
Predicted RCO
in diesel / % d (actual – predicted) a
8 6.5 1.5
15 10.8 4.2
25 22.4 2.6
35 39.0 –4.0
40 41.4 –1.4
55 54.5 0.5
70 69.7 0.3
80 79.4 0.6
95 100.0 –5.0
100 102.3 –2.3
aStudent’s t-test for paired data: d
m = –0.3, s = 2.88, Sm = 0.91,
tcal = –0.336738, ttab = –2.262, where d is the difference between each pair, dm is the mean of the differences, s is the standard deviation, Sm is the standard error of the differences, and tcal = dm / Sm.
Figure 4. Graph constructed using the concentration values of RCO in diesel as the x axis and the relative change in the fluorescence area of each blend with respect to the fluorescence area of the diesel (δ parameter) as the y axis.
Figure5. Graph constructed excluding anomalous samples using the concentration values of RCO in diesel as the x axis and the relative change in the fluorescence area of each blend with respect to the fluorescence area of the diesel (δ parameter) as the y axis.
Figure6. Graph constructed using the concentration values of kerosene in diesel as the x axis and the relative change in the fluorescence area of each blend with respect to the fluorescence area of the diesel (δ parameter) as the y axis.
predicted concentrations of kerosene in diesel or turpentine in diesel (Tables 3 and 4, respectively).
Table 5 shows the validation parameters found from the analytical curves (Figures 5-7). The detection limits were 3, 4 and 5% for non-transesterified RCO, kerosene, and turpentine in diesel, respectively.
Table 3. External validation by application of Student’s t-test for paired data of kerosene in diesel
Actual kerosene in diesel / %
Predicted kerosene
in diesel / % d (actual – predicted) a
2 4.3 –2.3
4 4.7 –0.7
6 7.4 –1.4
8 7.1 0.9
10 10.8 –0.8
20 19.3 0.7
30 29.8 0.2
40 40.2 –0.2
50 51.2 –1.2
60 57.3 2.7
70 69.4 0.6
80 79.4 0.6
90 90.0 0.0
aStudent’s t-test for paired data: d
m = –0.07, s = 1.27, Sm = 0.35,
tcal = –0.19434, ttab = –2.179, where d is the difference between each pair, dm is the mean of the differences, s is the standard deviation, Sm is the standard error of the differences, and tcal = dm / Sm.
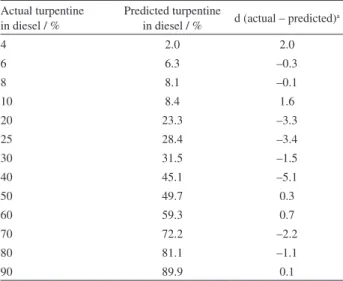
Table 4. External validation by application of Student’s t-test for paired data of turpentine in diesel
Actual turpentine in diesel / %
Predicted turpentine
in diesel / % d (actual – predicted) a
4 2.0 2.0
6 6.3 –0.3
8 8.1 –0.1
10 8.4 1.6
20 23.3 –3.3
25 28.4 –3.4
30 31.5 –1.5
40 45.1 –5.1
50 49.7 0.3
60 59.3 0.7
70 72.2 –2.2
80 81.1 –1.1
90 89.9 0.1
aStudent’s t-test for paired data: d
m = –0.94, s = 2.10, Sm = 0.58,
tcal = –1.62438, ttab = –2.179,where d is the difference between each pair, dm is the mean of the differences, s is the standard deviation, Sm is the standard error of the differences, and tcal = dm / Sm.
Figure7. Graph constructed using the concentration values of turpentine in diesel as the x axis and the relative change in the fluorescence area of each blend with respect to the fluorescence area of the diesel (δ parameter) as the y axis.
Table 5. Validation parameters found for the determination of adulterants in diesel
Validation parameters RCO in diesel Kerosene in diesel Turpentine in diesel
Number of points 11 24 21
Degrees of freedom (DOF) 9 22 19
Residual sum of squares (RSS) 2.44154 14.5146 24.2346
Residual standard deviation (RSD)a / % 0.52 0.81 1.12
Limit of detection (LOD)b / % 3 4 5
Limit of quantification (LOQ)c / % 11 12 15
Sensibility (slope) 0.5 0.6 0.7
aRSD = RSS / DOF; bLOD = 3RSD / slope; cLOQ = 10RSD / slope.
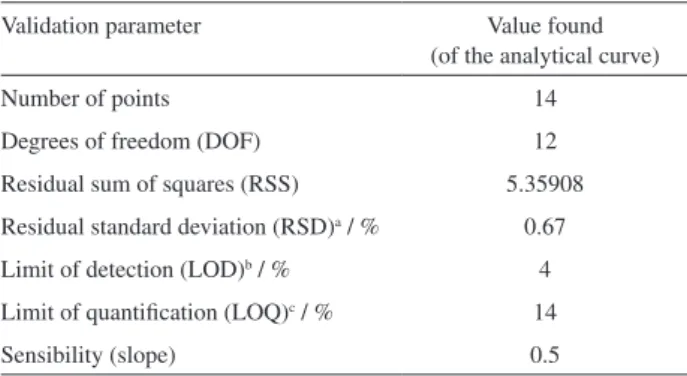
Table 6. Validation parameters found for the determination of RCO in B5
Validation parameter Value found (of the analytical curve)
Number of points 14
Degrees of freedom (DOF) 12
Residual sum of squares (RSS) 5.35908
Residual standard deviation (RSD)a / % 0.67
Limit of detection (LOD)b / % 4
Limit of quantification (LOQ)c / % 14
Sensibility (slope) 0.5
aRSD = RSS / DOF ; bLOD = 3RSD / slope; cLOQ = 10RSD / slope.
Conclusions
The results confirm that the proposed method is simple, fast, and efficient, and that it can be used for the determination of adulterants such as non-transesterified RCO, kerosene, and turpentine in diesel, in the range of 0-100%. The detection limits were 3, 4, and 5% for non-transesterified RCO, kerosene, and turpentine in diesel, respectively. The method was also successfully used to determine the non-transesterified RCO content in a B5 biodiesel-diesel blend (5% biodiesel) in the range of 0-70%, with a limit of detection of 4%. High LOQ values limit the application of the method, as many adulterations occur at concentrations below 10%.
Acknowledgements
We acknowledge CNPq, FAPESB, and CAPES for technological scholarships and grant support for this work. We also thank Quimis for partnership. C. M. Q. acknowledges a senior research scholarship from CNPq. E. M. O. R acknowledges CAPES for a postdoctoral scholarship. M. M. acknowledges FAPESB for a research scholarship.
References
1. Corgozinho, C. N. C.; Pasa, V. M. D.; Barbeira, P. J. S.; Talanta
2008, 76, 479.
2. Patra, D.; Mishra, A. K.; Anal. Chim. Acta2002, 454, 209. 3. Oliveira, F. C. C.; Brandão, C. R. R.; Ramalho, H. F.; Costa,
L. A. F.; Suarez, P. A. Z.; Rubim, J. C.; Anal. Chim. Acta2007,
587, 194.
4. Vasconcelos, F. V. C.; Souza Jr., P. F. B.; Pimentel, M. F.; Pontes, M. J. C.; Pereira, C. F.; Anal. Chim. Acta2012, 716, 101. 5. Pontes, M. J. C.; Pereira, C. F.; Pimentel, M. F.; Vasconcelos,
F. V. C.; Silva, A. G. B.; Talanta 2011, 85, 2159.
6. Gaydou, V.; Kister, J.; Dupuy, N.; Chemom. Intell. Lab.Syst.
2011, 106, 190.
7. Roy, S.; Sens. Actuators, B1999, 55, 212.
8. Quintella, C. M.; Guimarães, A. K.; Musse, A. P.; Br PI
000022080730742-1, 2009.
9. Meira, M.; Quintella, C. M.; Ferrer, T. M.; Silva, H. R. G.; Guimarães, A. K.; Santos, M. A.; Costa Neto, P. R.; Pepe, I. M.;
Quim. Nova 2011, 34, 621.
10. Mzoughi, N.; Dachraoui, M.; Villeneuve, J. P.; C. R. Chim.
2005, 8, 97.
11. Patra, D.; Mishra, A. K.; Anal. Bioanal. Chem.2002, 373, 304. 12. Divya, O.; Mishra, A. K.; Talanta2007, 72, 43.
13. Prakash, J.; Mishra, A. K.; Fuel2013, 108, 351. 14. Patra, D.; Sens. Actuators,B 2008, 129, 632.
15. Insausti, M.; Romano, C.; Pistonesi, M. F.; Band, B. S. F.;
Microchem. J. 2013, 108, 32.
16. Divya, O.; Mishra, A. K.; Anal. Chim. Acta2007, 592, 82. 17. Caires, A. R. L.; Lima, V. S.; Oliveira, S. L.; Renewable Energy
2012, 46, 137.
Submitted: October 3, 2014