First environmental DNA (eDNA) record of central Amazon in a
floodplain lake: extraction method selection and validation
Primeiro registro de DNA ambiental (eDNA) da Amazônia central em um
lago de várzea: seleção e validação de método de extração
DOI:10.34117/bjdv6n11-254
Recebimento dos originais: 11/10/2020 Aceitação para publicação: 12/11/2020
Danniel Rocha Bevilaqua
Doutorado em Biologia de Água Doce e Pesca Interior
Instituto Federal de Educação, Ciência e Tecnologia do Amazonas/Campus Avançado Manacapuru
Estr. Manoel Urbano, km 77 - Morada do Sol, Manacapuru - AM, 69400-000 E-mail: [email protected]
Sabrina Araújo de Melo Graduação em Biomedicina Fundação de Medicina Tropical
Av. Pedro Teixeira, s/n - Dom Pedro, Manaus - AM, 69040-000 E-mail: [email protected]
Carlos Edwar de Carvalho Freitas Doutorado em Ciências da Engenharia Ambiental
Universidade Federal do Amazonas
Av. General Rodrigo Octavio Jordão Ramos, 1200 - Coroado I, Manaus - AM, 69067-005 E-mail: [email protected]
Ana Caroline Viana da Silva Graduação em Ciências Biológicas
Programa de Pós Graduação em Genética, Conservação e Biologia Evolutiva (PPG GCEBv) Av. André Araújo, 2936 - Petrópolis, Manaus - AM, 69067-375
E-mail: [email protected]
Jacqueline da Silva Batista
Doutorado em Genética, Conservação e Biologia Evolutiva.
Instituto Nacional de Pesquisas da Amazônia (INPA), Coordenação de Biodiversidade (COBIO), Laboratório Temático de Biologia Molecular (LTBM)
Av. André Araújo, 2936, Manaus, AM, Brasil, CEP 69067-375. Email: [email protected]
ABSTRACT
In recent years, environmental DNA (eDNA) has emerged as an effective method for detecting aquatic organisms. The current study tested a method of DNA extraction from water samples from Central Amazonian floodplain lake. Water collections were performed in a floodplain lake on Paciência Island, on the Solimões River (Amazon Basin, Brazil) during the high water period. Seven commercial DNA extraction methods/kits were tested with samples collected from Lake Cacau. After quantification, eDNA samples were amplified with 12S and 16S
mitochondrial gene universal primers. The DNeasy Blood & Tissue kit (Qiagen), with modifications developed during the current study (adapt 03), gave the best overall result showing expected gene amplification, and intense agarose gel banding. eDNA concentrations ranged from 0.00 to 22.90 ng/µL for the other methods, with either lower intensity of the amplicon size to target gene correspondence when compared to that obtained with the DNeasy Blood & Tissue kit adapt 03 method, or there was an absence of amplification.The concentration of eDNA extracted from the lake sample was 2.68ng/µL. Prochilodus nigricans and Potamorhina altamazonica genomic DNA (gDNA) samples were extracted for use as a positive controls. The 12S and 16S genes from eDNA were amplified and sequenced with next generation Sequencing (NGS). Using a metabarcode approach, we used the 12S (12S-V5) and 16S (L2513/H2714) minibarcode universal primers to detect fish species DNA traces present in water samples from the Cacau lake. The NGS produced 18 and 492,454 12S and 16S minibarcode readings, respectively, for three taxonomic groups (Actinopterygii, Mammalia and Squamata). Adding the two genes, a total of 492,472.00 readings, with 15 readings with 12S and 4,431.082 readings with 16S for fish. Fish (Actinopterygii) represented 83.33% and 0.60% (three Orders, five families and five genus identified according to BLASTN), mammals had 11.11% and 99.40% and reptiles with 5.56% and 0.00% for the total readings of the 12S and 16S respectively, with more than 97% similarity to NCBI-available reference sequences. Taxonomic classification at the level of species was not very resolute when comparing OTU's with sequences published in NCBI.This study sets a milestone in the methodology of DNA extraction from floodplain lake, and shows the method can be used to monitor Amazon basin ichthyofauna, as it was possible to detect the presence of fish species DNA in collected water samples.
Keywords: Monitoring, Environmental DNA, DNA extraction RESUMO
Nos últimos anos, o DNA ambiental (eDNA) surgiu como um método eficaz para a detecção de organismos aquáticos. O estudo atual testou um método de extração de DNA de amostras de água de um dos lagos da planície de inundação da Amazônia Central. As coletas de água foram realizadas em um lago de várzea na Ilha da Paciência, no rio Solimões (Bacia Amazônica, Brasil) (Lago Cacau) durante o período de cheia. Sete métodos/kits comerciais de extração de DNA foram testados com amostras coletadas. Após a quantificação, as amostras de eDNA foram amplificadas com os primers universais do gene mitocondrial 12S e 16S. O kit DNeasy Blood & Tissue (Qiagen), com modificações desenvolvidas durante o estudo atual (adaptado 03), apresentou o melhor resultado geral mostrando a amplificação esperada com alta intensidade da banda revelada em gel de agarose. As concentrações de eDNA variaram de 0,00 a 22,90 ng/µL para os outros métodos, com menor intensidade da banda do amplicon correspondente ao gene alvo quando comparada à obtida com o método DNeasy Blood & Tissue kit adapto 03, ou houve ausência de amplificação. A concentração do eDNA extraído da amostra do lago foi de 2,68ng/µL. Amostras de DNA genômico (gDNA) de Prochilodus
nigricans e Potamorhina altamazonica foram extraídas para uso como controles positivos. Os
genes mitocondriais 12S e 16S foram amplificados e sequenciados com a metodologia de sequenciamento de próxima geração (NGS). Usando uma abordagem de metabarcode, usamos os primers universais de minibarcode 12S (12S-V5) e 16S (L2513/H2714) para detectar traços de DNA de espécies de peixes presentes em amostras de água do lago Cacau. Com a metodologia NGS foram geradas 18 e 492.454 leituras dos minibarcodes 12S e 16S, respectivamente, para três grupos taxonômicos (Actinopterygii, Mammalia e Squamata). Somando os dois genes, um total de 492.472,00 leituras, com 15 leituras com 12S e 4.431.082 leituras com 16S para peixes. Peixes (Actinopterygii) representaram 83,33% e 0,60% (três ordens, cinco famílias e cinco gêneros identificados de acordo com BLASTN), mamíferos
tiveram 11,11% e 99,40% e répteis com 5,56% e 0,00% para as leituras totais de 12S e 16S respectivamente , com mais de 97% de semelhança com as sequências de referência disponíveis no NCBI. A classificação taxonômica em nível de espécie não foi muito resolutiva ao comparar OTU's com sequências publicadas no NCBI. Este estudo é um marco na metodologia de extração de DNA de lago de várzea e mostra que o método pode ser usado para monitorar a ictiofauna da bacia amazônica, pois foi possível detectar a presença de DNA de espécies de peixes nas amostras de água coletadas.
Palavras-chave: Monitoramento, DNA ambiental, Extração de DNA
1 INTRODUCTION
With a geographical area of some 6,500 km2 and an extensive and complex network of rivers and aquatic habitats, the Amazon basin hosts the richest freshwater fish fauna on the planet, with over 2,411 described species (Reis et al. 2016). However, it is also threatened by events at the local, regional and planetary-scale (Castello et al. 2013). Despite these events, the abundance and richness of the basin’s ichthyofauna is reflected in the high human consumption of fish, which ranges from 19 to 805 g/per person/day (Ruffino & Isaac 1994; Cerdeira et al. 1997; Batista & Petrere, 2003).
Some lines of research on amazonian fish biology are of critical importance for the understanding of fish life strategies, such as reproductive (Schwassmann 1978) and feeding biology (Knoppel, 1970), respiratory metabolism (Kramer et al. 1978), reproduction and development (Bayley 1988; Loubens & Panfili 1997; Fabré & Saint‐Paul 1998; Campos et al. 2015), and migration (Barthem & Goulding 1997; Batista & Alves-Gomes, 2006; Sousa et al. 2016). Despite this importance, fish ecological studies, including biodiversity monitoring, are conventionally performed using visual detection and counting. The means by which such data are collected generally lack standardization due to the selectivity of fishing gear and reliance on practical taxonomic knowledge (Hopkins & Freckleton 2002; Wheeler et al. 2004). In addition, several species are difficult to detect, especially during some periods of the year or particular stages of development (Gotelli & Colwell 2001; MacKenzie et al. 2005).
In this context, application of Environmental DNA (eDNA) methodology can provide an effective means to detect and identify species in bodies of water across a great diversity of habitats, precisely as occurs within the Amazon basin. Environmental DNA is made available when animals and / or plants undergo cell renewal in all systems, old cells that suffer cell death are eliminated by urine, feces and epidermal flaking (Haile et al. 2009; Thomsen and Willerslev 2012; Mahon et al. 2013). Once eliminated, they are released into the terrestrial or aquatic environment and can be a source of information about these organisms, whether in aquatic or
terrestrial environments (Levy-Booth et al. 2007; Pietramellara et al. 2009; Taberlet et al. 2012).
Molecular analyzes of eDNA can allow the diagnosis of free-living species (Willerslev et al. 2003; Rees et al. 2014; Jane et al. 2015), terrestrial (Valiere and Taberlet 2000; Andersen et al. 2012; Mahon et al., 2013) and aquatic (Lodge et al. 2006; Ficetola et al. 2008; Jerde et al. 2011; Mahon et al. 2013) with applications in conservation programs (Rees et al. 2014), critical species detection threatened, invasive species (Jerde et al. 2011; Eichmiller et al. 2016) and the quantification of aquatic organisms (Thomsen and Willerslev 2012; Pilliod et al. 2013; Takahara et al. 2013) especially when traditional selection classes are inadequate (Darling and Mahon 2011; Jerde et al. 2011). DNA extraction from environmental samples allows the characterization of organisms that occur within the sampled environment without the need to kill, or even collect, them (Venter et al. 2004). However, considering that short DNA sequences may be present at high density in the environment, their potential for studying current communities of organisms remains largely untapped (Dejean et al. 2012).
Given the potential use of eDNA in the detection of species in the natural environment, the current study records the first attempt to obtain environmental DNA from a floodplain lake of the Central Amazon, during the selection and testing of seven commercial DNA extraction methods/kits more frequent in studies with fish species, as well as how to detect the presence of fish species in the study area.
2 MATERIALS AND METHODS 2.1 STUDY AREA
Water samples were collected during the flooded periods in the Cacau floodplain lake (03°96'36" S, 60°38'31 "W) on Paciência island, a fluvial island of the lower Solimões river (Figure 1).
Figure 1 – Location of the island of Paciência and its lakes, including Cacau lake, municipality of Iranduba, Amazon, Brazil.
2.2 WATER SAMPLE COLLECTION AND FILTRATION AND TISSUE SAMPLE PROCUREMENT
For greater coverage of the lake, five 1L samples of surface water were collected in autoclaved 1L flasks (Nalgene - Thermo Scientific), each one in different collection points . In the field, the collected water was kept in a cool box with ice until it reached the laboratory, where vacuum filtration was carried out. Of the 1L of water, 200 ml of each sample was vacuum filtered using HA cellulose ester 0.45mm pore, 47mm diameter membranes (Millipore). At the end of the set of filtered water sampling from the lake, 1L of ultra pure water was filtered as negative control to monitor for possible contamination.
Potamorhina altamazonica (branquinha) proved to be the most abundant species present
in four lakes, with Prochilodus nigricans (curimatã) also present in all of them (Freitas et al. 2010). These authors performed an analysis of the correspondence carried out - DCA (Hill & Gauch, 1980) to identify possible patterns in the structure of the fish community between the lakes. This analysis was chosen to avoid the arc effect, a common feature in the results of the correspondence analysis (Manly, 2005). For this reason, muscle tissue samples from one specimen of each these species were acquired from the INPA Genetic Resource Collection, Manaus, Amazonas, Brazil in order to be used as a positive controls.
2.3 STANDARDIZATION OF STEPS INVOLVED IN ENVIRONMENTAL DNA EXTRACTION: MEMBRANE FRAGMENTATION, PROTOCOL DEFINITION AND TESTING EDNA EXTRACTION KITS, EDNA QUANTIFICATION AND PCR VALIDATION
The membranes were placed in 2 ml tubes containing two 0.5 mm stainless steel spheres and processed with 2800 oscillations for 80 seconds using Bead Beater equipment (Biospec Products, Bartlesville, USA). Three replicates were performed for each extraction method, obtained from the filtration of a randomly-selected water sample from Cacau lake on which the seven extraction methods/kits were to be tested for (Table 1). The filters were preserved in falcon tubes at a temperature of -200C. The extraction of environmental DNA was carried out in a dedicated sterile room, to avoid contamination, following the good practices defined in molecular biology laboratories. Thus, the mean and standard deviation of eDNA concentration were calculated for each extraction method. These were pre-selected based on reports for kit performance with different types of biological material, as well as the cost/benefit. All methods tested (except the method 5) used commercial kits to avoid possible contaminations.
The eDNA samples were quantified using Qubit equipment (ThermoFisher), with an HS reagent kit (high sensitivity) that quantifies up to 100ng/µL of DNA. In addition to the concentration, the extracted eDNA was subjected to PCR using two mitochondrial gene primers (12S-V5) (Riaz et al. 2011) and 16S (L2513/H2714) (Kitano et al. 2007), both primers amplify the vertebrate taxonomic group.
2.4 EDNA EXTRACTION AND AMPLIFICATION FROM THE CACAU FLOODPLAIN LAKE SAMPLES
After choosing the appropriate eDNA extraction method (Table 1, Method 3 / Dneasy Blood & Tissue kit with modifications designed during the present study), the eDNA was extraction from five membrane separatedely (one for each lake collection points) and were concentrated into one tube in a vacuum centrifuge (Eppendorf® centrifugal vacuum concentrator) in order to have a pool representative from 1L water sample. One membrane of filtered ultrapure water (1L) were also used as negative controls during the eDNA extraction. The genomic DNA from Potamorhina altamazonica and Prochilodus nigricans (curimatã) was extracted using a wizard genomic DNA purification kit (Promega), following the manufacturer's recommendations, and subsequently defined as the positive PCR control. gDNA and eDNA samples were quantified as reported above, and checked with Diamond Stained (Promega) 1% Agarose gel electrophoresis.
PCR was performed using 12S (~ 100 bp) (12S-V5) (Riaz et al. 2011), and 16S (~ 200 bp) (L2513/H2714) (Kitano et al. 2007) universal primers, which were developed for vertebrates. The conditions of volumes, reagents and temperature for the PCR used for the primer set 12S (12S-V5) and 16S (L2513 / H2714) followed the protocol of the manufacturer of the Taq polymerase kit (Invitrogen). Subsequently, the product was checked on a Diamond stained (Promega) 1% agarose gel. To confirm fish species presence in their environment, either 12S and 16S mtDNA minibarcodes amplicons were carried out in next generation sequencing (NGS).
2.5 EDNA NEXT GENERATION SEQUENCING
Two PCRs were performed using eDNA samples. The first one it was inserted an adapter sequence into the 5´ portion of each forward (5´-TCGTCGGCAGCGTCAGATGT
GTATAAGAGACAG) and reverse primers
(5´-GTCTCGTGGGCTCGGAGATGTGTATAAGAGACAG), and the second PCR occurred to facilitate the future anealing of codified identifiers, according to the Illumina 16S Metagenomic sequencing Library Preparation protocol ( Illumina, San Diego, CA, United States).
In the first PCR, each minibarcode (12S and 16S) was amplified separately. Each reaction contained 1X KAPA HiFi Hot Start master mix (KAPA Biosystems, Wilmington, MA, USA), ultra-pure water, 0.3 μM of each primer and 2.0 μL of eDNA. The temperature profile was: 95 ° C for 3 min; 35 cycles of 98 ° C for 20 sec, 65 ° C for 15 sec and 72 ° C for 15 sec followed by final extension at 72 ° C for 5 min. Then the PCR product was checked on 1.8% agarose gel and purified with magnetic beads Agencourt AMPure XP (Beckman Coulter) according to the manufacturer's recommendations. Subsequently, the amplifier concentration was accessed with the aid of the Quibit equipment.
The second PCR was structured so the reaction pooled the two eDNA sample amplicons and allowed their annealing with the the Illumina adapter primer linked to an Illumina NGS kit cell flow matrix. PCR was peformed using the 1X KAPA HiFi HotStart master mix, 0.3 μM of the adapter (nextera XT Index illumina), 1.0 μL of each amplificon and ultra-pure water. The thermal cycle profile was 95 °C for 3 min; 12 cycles of 98 °C for 20 sec, 55 °C for 30 sec and 72 °C for 30 sec and a final extension for 5 min at 72 °C. The amplified product was purified with Agencourt AMPure XP magnetic beads (Beckman Coulter) according to the manufacturer's recommendations, quantified in Qubit and the concentration adjusted to 4 nM using ultra-pure water. After that, 5 μL of the product were denatured with 0.2N NaOH, and the resulting volume diluted to 12 pmol with the HT1 buffer (Illumina). DNA from a Phix
DNA reference library (20%) was added to improve data quality in low diversity samples. The mixture was placed in the NGS MiniSeq Mid Output kit 2x150 bp (300-cycles) (Illumina) and analysed on an Illumina MiniSeq according to the manufacturer's recommendations.
The initial evaluation for sequencing data reading metrics was conducted with the program FastQC version 0.11.4 (http://www.bioinformatics.babraham.ac.uk/projects/fastqc/). Subsequently, the amplicons/genes were demultiplexed using a python script that recognizes the primers (Caporasa, 2010). Only paired readings were maintained. The forward and reverse sequences were merged to produce a mounted FastQ file, using a script using the Qiime pipeline (Caporasa, 2010).
Quality control steps included filtering low-quality, truncated-sized readings and removing strings that occurred less than 10 times, using the VSEARCH program (Rognes et. al, 2016) (https://github.com/torognes/vsearch). Clustering reads into Operational Taxonomic Units (OTUs) was performed using the UPARSE method of the UCLUST program (http://drive5.com/usearch/manual/uclust_algo.html), with minimum similarity set at 97%. Then, the readings were mapped against OTUs, and taxonomic identities assigned individually for each minibarcode, via the BLASTN method (data option - nucleotide collection nr), using the BROCC program (Dollive et. al, 2012). Specific identity filters were used at the genus (91%) and species (98%) levels in BLAST, in addition to the main identity filter used for all other levels. Following taxonomic classification, the frequency of readings (%) for each OTU was obtained using the Qiime program (Caporasa, 2010), and the number of readings then recovered.
3 RESULTS
3.1 METHODS FOR EDNA EXTRACTION
For all tested methods Qubit-based quantification showed the presence of eDNA in a randomly-chosen sample. Concentrations ranged from 0.001 to 22.98 ng/µL (Table 1). However, the best intensity PCR results for a 12S fragment (mtDNA) came from eDNA extracted with method 3, the Dneasy Blood & Tissue Kit, when used with the adaptations developed in the present study. This result may have been due to the membrane, which in this method is totally submerged in a solvent so allowing digestion optimization via the inclusion of 400 μL of lysis buffer. eDNA extraction from water sampled at the Cacau floodplain lake followed this protocol.
Table 1 – Protocols and kits for DNA extraction tested to obtain environmental DNA from central Amazonian floodplain lake and Environmental DNA extraction methods tested and the respective concentrations obtained. Method Protocoles/ Kits
tested Reference/ Manufacturer Adaptatation tested DNA Concentration (repetitions) - ng/µL 12S PCR Result 1 2 3 𝑥 ± 𝑠
1 Dneasy Blood &
tissue kit
Qiagen*
0.83 0.58 0.34 0.58±0.25 ±
2 Dneasy Blood &
Tissue Kit adaptation 1 Qiagen Adapted by Thomsen, et al. 2012a: Ddifferent volumes of reagents than kit
standard
0.63 1.34 1.53 1.17±0.47 -
3 Dneasy Blood &
Tissue Kit adaptation 2 Qiagen adapted by current study: 400 µL of Lysis Buffer **, membrane digestion and 100 µl of ATL Buffer*** 1.37 1.38 0.82 1.19±0.32 + 4 Wizard® Genomic DNA Purification Kit Promega* 0.00 22.8 4.94 9.25±11.99 - 5 Phenol/Cloroform Sambrook et al. 2001 1.38 4.22 1.96 2.52±1.50 ± 6 PureLink™
Genomic DNA Mini Kit Invitrogen* 1.71 1.15 2.12 1.66±0.49 ± 7 PureLink® Viral RNA
/DNA Mini Kit
Invitrogen*
1.98 2.22 2.36 2.19±0.19 ±
* Tests using the full manufacturer's suggested protocol; ** Composition: TrisHCl 1M; EDTA 0,5M; NaCl 5M; SDS 20%; Ultra-pure Water; *** Buffer provided with the Dneasy Blood & Tissue (Qiagen) kit; -: No amplification of 12S fragment; ±: Amplification of weak 12S fragment; +: High intensity 12S fragment amplification; *:protocol followed maker’s recommendations; 𝑥 ± 𝑠: Mean and Standard deviation.
3.2 PCR VALIDATION OF EDNA SAMPLES FROM CACAU FLOODPLAIN LAKE USING UNIVERSAL PRIMERS (12S AND 16S)
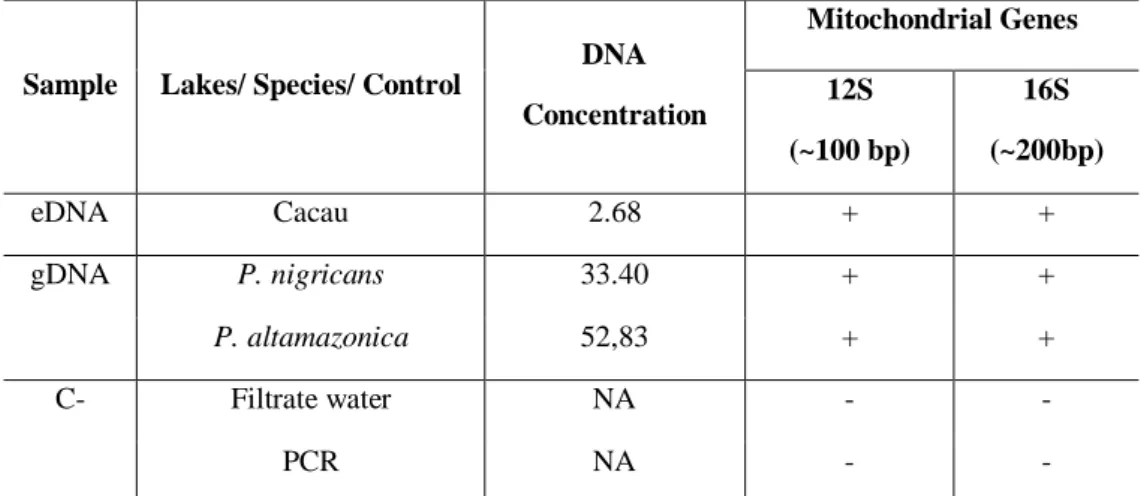
In general, eDNA Concentrated sample extracted from from Cacau lake (2.68 ng/µL) water gave satisfactory results for 12S and 16S mitochondrial gene amplification using universal primers (Table 2). These genes were amplified using P. nigricans and P.
samples did not amplify, indicating the absence of contamination during the filtering process and reaction. Thus, it was possible to proceed with the experiments sequencing the 12S and 16S amplicons. None of the ultra-pure water samples, and none of the negative filtration control, showed DNA values above zero after Qubit quantification.
Table 2 – Environmental DNA concentration (ng/µL) in water samples collected from the floodplain lake Cacau and the 12S and 16S mitochondrial gene PCR validation of eDNA samples using universal primers. gDNA from Prochilodus nigricans and Potamorhina altamazonica were used as positive controls. C-: Negative control (PCR and ultra-pure water fitrate).
Sample Lakes/ Species/ Control
DNA Concentration Mitochondrial Genes 12S (~100 bp) 16S (~200bp) eDNA Cacau 2.68 + + gDNA P. nigricans 33.40 + + P. altamazonica 52,83 + + C- Filtrate water NA - - PCR NA - -
NA: not applicable; (+):Intense amplification ; (±): Weak amplification ; (-): No amplification.
3.3 ENVIRONMENTAL DNA NGS AND OPERATIONAL TAXONOMIC UNIT (OTU) CLASSIFICATIONS
The nucleotide sequencing of the eDNA sample from the Cacau lake generated a total of 18.00 readings for the 12S, and 492,472.00 for 16S gene.
The OTUs generated with the two minibarcodes DNA readings/sequences were used to construct a list of taxa present in the eDNA, at the highest possible taxonomic level. Fish (Actinopterygii) represented 83.33% and 0.60% (three Orders, five families and five genus identified according to BLASTN), mammals had 11.11% and 99.40% and reptiles with 5.56% and 0.00% for the total readings of the 12S and 16S respectively, with more than 97% similarity to NCBI-available reference sequences (Table 3).
Table 3 - Composition of ichthyofauna, obtained from environmental DNA at Cacau Lake, Ilha da Paciência, central Brazilian Amazonia, during the peak water flooding period, according to OTU’s (genu) generated by New Generation Sequencing. The total number of readings (DNA sequences) obtained for the two sequenced minibarcodes (12S and 16S) is given for each taxon.
Class Order Family Genus 12S 16S
Actinopterygii Not determined Not determined Not determined 0 1,477 Characiformes Not determined Not determined 2 0
Characidae Not determined 1 0
Paracheirodon 0 1,477
Prochilodontidae Prochilodus 1 0
Siluriformes Not determined Not determined 7 0
Pimelodidae Brachyplatystoma 1 0
Gymnotiformes Not determined Not determined 1 0
Rhamphichthyidae Gymnorhamphichthys 1 0
Sternopygidae Eigenmannia 1 0
Mammalia Rodentia Muridae Mus 2 0
Primates Hominidae Homo sapiens 0 484,592
Homo 0 4,432
Not determined 0 492
Squamata Squamata Dactyloidae Anolis 1 0
Total readings/sequences 18 492,472
4 DISCUSSION
The sensitivity of any molecular diagnostic method is largely dependent on DNA extraction efficiency (Nakatani et al. 2004). Good quality DNA is a prerequisite for any molecular analysis. Several methods and commercial kits are available for gDNA isolation but, in practice, such procedures are empirical due to the different types and conditions of biological samples. For this reason, it is hard to reproduce conventional DNA extraction methods for all species and sample types, so that adaptations and modifications are often required (Aras et al. 2003).
One of the keys to obtaining fully reproducible results is the integrity of the DNA extracted from different biological sources. Several factors (quantity, origin, type, storage conditions and duration) must be analyzed and compared to identify ways by which DNA of the greatest purity and volume can be best stored so that degradation over time is minimized.
In the current study, seven methods were evaluated, some with and some without methodological adaptations, to extract, for the first time, eDNA from water samples from
Amazonian floodplain lake, and do so with the best possible quality and suitablity for use with PCRs. Method 3 (Dneasy Blood & Tissue Kit with adaptations developed during the current study) gave the best results for extracted eDNA when tested with PCR (Table 1) and thus NGS data (Table 3). The presence of inhibitors may have been responsible for the unsatisfactory PCR results for some eDNA samples obtained with other tested methods, which may not have been able to eliminate contamination. This is key, since environmental samples may contain a variety of PCR interfering substances (inhibitors). These include fuvic acids, DNA degradation due solar to irradiation, possible effects of DNAses, and action of microoganisms. All of these may inhibit or interfere with eDNA capture and amplification. For example, humic acids, which are released from decaying leaves, are known to inhibit PCR operation (Dejean et al. 2011).
An eDNA assay, therefore, must be carefully designed to suit the species, location, and sampling conditions under consideration. Although no inhibitors were used during PCR testing in this study, the concentrations and quality of the DNA obtained with method 3 were sufficient for conventional PCR validation and would this allow the application of other techniques (eg: qPCR and nucleotide sequencing).
To assay eDNA samples, universal primers were used (Yamamoto et al. 2017). This illustrates the capacity of the technique to detect the presence of a fish DNA trail in water samples collected from lake, as well as amplify gDNA samples of fish species. The results were successful and matched the efficiency tests performed on gDNA in a variety of vertebrate taxonomic groups (Riaz et al. 2011; Kitano et al. 2007).
In this study, we also evaluated the ability to detect up to, whenever possible, the taxonomic level of species, the eDNA extracted via 12S and 16S minibarcodes amplification and sequencing. Fish species in nine families (five identified according BLASTN analyses) across in four orders (three identified according BLASTN analyses) were recorded from the floodplain Cacau lake.
In the current study, the genus Paracheirodon, Brachyplatystoma, Gymnorhamphichthys and Eigenmannia were recored while the traditional capture methods had not detected them in the same lake (Freitas et al. 2010). These results support the need to associate eDNA detection and traditional capture methods.
Although the presence of fish species in the Cacau lake was detected, Homo sapiens DNA sequences comprised more than 99% of the readings obtained with the 16S gene. This is probably because the set of primers (L2513/H2514) have also been developed for mammals and due to the presence of human communities around the lake whose inhabitants use the lake
as a fishing area and other activities. In this case, it is recommended to expand the variety of different genes used or extend coverage via other primers of the 12S or 16S genes, so that better detection of Amazon floodplain lakefish species assemblage compositions is possible. It is also important to emphasize the need to increase the number of sequences available in the public data banks of the 12S and 16S genes so fish species detection at the levels of genus and species becomes more efficient. The taxonomic classification not determined for some Orders, families and genus/species (table 3), comparing OTU's with sequences published in NCBI, Probably occurred due this fact.
In the current study, it was possible to validated a method to record the first eDNA from a Amazonian floodplain lake using universal minibarcodes amplicons. This is a pioneering way, for the geographical area sampled. The eDNA metabarcode approach can be used to detect fish species and demonstrates its capacity as a potential tool for used in surveying ichthyofaunal communities (Yamamoto, 2016) in Amazonian floodplain lakes.
5 CONCLUSIONS
Of the seven methods tested, the Dneasy Blood & Tissue Kit (Qiagen), with modifications developed during the present study, gave the best results for the extraction of DNA from the lake of the Amazon floodplain. The eDNA samples were tested satisfactorily via PCR. The results of NGS, obtained for sample of environmental DNA from Cacau lake in using universal primers (mitochondrial genes 12S and 16S), indicated the presence of fish DNA in the concentrated sample of collection points, however the greatest number of readings went to Homo sapiens, which may indicate the presence of fishermen who live in communities around the lake.
ACKNOWLEDGMENT
To the project's funding agencies: Amazonas Research Support Foundation (GOVERNO DO ESTADO DO AMAZONAS/SEDECT/FAPEAM: RH-INTERIORIZAÇÃO/Edital 003/2014; Universal Amazonas 062.01350/2018; POSGRAD 2016/2017). For the opportunity offered by Dr. Vera Silva, researcher at the Aquatic Mammals laboratory (INPA), to conduct a training at the University of Kobe (Japan). For training the method of detecting fish species using environmental DNA received by Ph.D. Toshifumi Minamoto (Department of Human Environmental Science - Division of Natural Environmental Science) at Kobe University.
REFERENCES
Aras S, Duran A, Yenilmez G (2003). Isolation of DNA for RAPD analysis from dry leaf material of some Hesperis L. specimens. 21, 461-462.
Barthem R, Goulding M (1997). The catfish connection: ecology, migration, and conservation of Amazon predators. Columbia University Press.
Batista V, Petrere M (2003). Characterization of the commercial fish production landed at Manaus, Amazonas State, Brazil. 33, 53-66.
Bayley P (1988). Factors affecting growth rates of young tropical floodplain fishes: seasonality and density-dependence. 21, 127-142.
Campos C, Freitas CEC, Amadio S (2015). Growth of the Cichla temensis Humboldt, 1821 (Perciformes: Cichlidae) from the middle rio Negro, Amazonas, Brazil. 13, 413-420.
Castello L, Mcgrath DG, Hess LL, Coe MT, Lefebvre PA, Petry P, Macedo MN, Renó VF, Arantes CC (2013). The vulnerability of Amazon freshwater ecosystems. 6, 217-229.
Cerdeira RGP, Ruffino ML, Isaac VJ (1997). Consumo de pescado e outros alimentos pela população ribeirinha do Lago Grande de Monte Alegre, PA-Brasil. 27, 213-228.
Dejean T, Valentini A, Duparc A, Pellier-Cuit SP, Pompanon F, Taberlet P, Miaud C (2011). Persistence of environmental DNA in freshwater ecosystems. PloS One, 6, e23398.
Dejean T, Valentini A, Miquel C, Taberlet P, Bellemain E, Miaud C (2012). Improved detection of an alien invasive species through environmental DNA barcoding: the example of the American bullfrog Lithobates catesbeianus. Journal of Applied Ecology, 49, 953-959.
Duponchelle F, Pouilly M, Pécheyran C, Hauser M, Renno JF, Panfili J, Darnaude AM, GARCÍA‐Vasquez A, Carvajal‐Vallejos F, García‐Dávila CJ (2016). Trans‐Amazonian natal homing in giant catfish. 53, 1511-1520.
Fabré N, Saint‐Paul UJ (1998). Annulus formation on scales and seasonal growth of the Central Amazonian anostomid Schizodon fasciatus. 53, 1-11
Freitas CEC, Siqueira-Souza FK, Guimarães AR, Santos FA, Santos IL (2010). Interconnectedness during high water maintains similarity in fish assemblages of island floodplain lakes in the Amazonian Basin. Zoologia, 27.
Gotelli NJ, Colwell RK (2001). Quantifying biodiversity: procedures and pitfalls in the measurement and comparison of species richness. 4, 379-391.
Hopkins G, Freckleton RP (2002). Declines in the numbers of amateur and professional taxonomists: implications for conservation. 5, 245-249.
Kitano T, Umetsu K, Tian W, Osawa M (2007). Two universal primer sets for species identification among vertebrates. 121, 423-427.
Knoppel H (1970). Food of Central Amazonian fishes; contribution to the nutrient-ecology of Amazonian rain-forest-streams.
Kramer D, Lindsey C, Moodie G, Stevens E (1978). The fishes and the aquatic environment of the central Amazon basin, with particular reference to respiratory patterns. 56, 717-729.
Loubens G, Panfili J (1997). Biologie de Colossoma macropomum (Teleostei: Serrasalmidae) dans le bassin du Mamoré (Amazonie bolivienne). 8, 1-22.
Mackenzie DI, Nichols JD, Sutton N, Kawanishi K, Bailey LL (2005). Improving inferences in population studies of rare species that are detected imperfectly. Ecology, 86, 1101-1113.
Nakatani S, Burger M, Assef M, Brockelt S, Cogo L, Messias-Reason I, Diseases I (2004). Efficient method for mycobacterial DNA extraction in blood cultures aids rapid PCR identification of Mycobacterium tuberculosis and Mycobacterium avium. 23, 851-854.
Reis RE, Albert JS, Didario F, Mincarone MM, Petry P, Rocha LA 2016. Fish biodiversity and conservation in South America. Journal of Fish Biology, in press
Riaz T, Shehzad W, Viari A, Pompanon FO, Taberlet P, Coissac E (2011). ecoPrimers: inference of new DNA barcode markers from whole genome sequence analysis. Nucleic Acids Research, 39, e145-e145.
Ruffino M., Isaac V.J. (1994) The fisheries of the lower Amazon: questions of management and development. 15, 37-46.
Sambrook J, Fritsch EF, Maniatis T. (1989). Molecular cloning: a laboratory manual. 2.ed. Cold Spring Harbor.
Sousa R, Humston R, Freitas C (2016). Movement patterns of adult peacock bass Cichla temensis between tributaries of the middle Negro River basin (Amazonas–Brazil): an otolith geochemical analysis. 23, 76-87.
Thomsen P., Kielgast J, Iversen LL, Møller PR, Rasmussen M, Willerslev E (2012a). Detection of a diverse marine fish fauna using environmental DNA fromseawater samples. PLoS ONE 7, e41732.
Venter JC, Remington K, Heidelberg JF, Halpern AL, Rusch D, Eisen JA, Wu D, Paulsen I, Nelson KE, Nelson WJS (2004). Environmental genome shotgun sequencing of the Sargasso Sea. 304, 66-74.
Vié JC, Hilton-Taylor C, Stuart SN (2009). Wildlife in a changing world: an analysis of the 2008 IUCN Red List of threatened species. IUCN.
Wheeler QD, Raven PH, Wilson EO (2004). Taxonomy: impediment or expedient? American Association for the Advancement of Science.
Yamamoto S, Masuda R, Sato Y, Sado T, Araki H, Kondoh M, Minamoto T, Miya M (2017). Environmental DNA metabarcoding reveals local fish communities in a species-rich coastal sea. Scientific Reports, 7, 40368.