UNIVERSIDADE DA BEIRA INTERIOR
Ciências Sociais e Humanas
In-season training load quantification of a top
elite European soccer male team
Rafael Franco Soares Oliveira
Tese para obtenção do Grau de Doutor em
Ciências do Desporto
(3º ciclo de estudos)
Orientador: Prof. Doutor Mário António Cardoso Marques
Co-orientador: Prof. Doutor João Paulo R. G. Moreira de Brito
To my mother, Teresa Isabel, who guide in life me through the years and
make me doing the entire academic course.
Academic thesis submitted with the purpose of obtaining a doctoral degree in Sport Sciences according to the provisions of Portuguese Decree-Law 107/2008 of 25 June.
Funding
This thesis was supported by the National Funds through FCT—Portuguese Foundation for Science and Technology (UID/DTP/04045/2013)—and the European Fund for Regional Development (FEDER) allocated by European Union through the COMPETE 2020 Programme (POCI-01-0145-FEDER-006969)—competitiveness and internationalization (POCI). The authors disclose funding received for this work from any of the following organizations: National Institutes of Health (NIH); Welcome Trust; Howard Hughes Medical Institute (HHMI); and other(s).
Acknowledgments
First, I must thank to all people that cross my life in some way because everyone contributes to the person I am today and consequently to make this thesis.
Specifically, I would like to thank:
-my mother for the biggest support, encouragement and counselling. I would never achieve such a degree if was not for her;
-grandfather for the constant support even with a critical clinical situation, he never gives up on life and on me;
-my friends for all the talk, share, support and friendship with a special appreciation to Fátinha for the corrections made on the “résumé” (in French);
-professor Mário António Cardoso Marques for his supervision, for their exceptional knowledge, excellent guidance, counselling and support;
-professor João P. M. Brito for his supervision, guidance, counselling and all the support. Thank you for your exceptional knowledge, patience and friendship all these years… thanks everything over the last years;
-professor Ricardo Ferraz, for their exceptional knowledge, excellent guidance, counselling and support;
-professor Daniel A. Marinho for your encouragement and counseling; -all co-workers for their collaboration;
-all the clubs and players that participated in the studies;
-my girlfriend that besides being with me every day and helping me to continue my work, she actualy help in formatting and production the figures and the thesis.
List of Publications
This Doctoral Thesis was supported by the following papers:
• Oliveira, R., Brito, J., Martins, A., Mendes, B., Calvete, F., Carriço, S., Ferraz, R. & Marques, M.C. (2019). In-season training load quantification of one-, two- and three-game week schedules in a top European professional soccer team. Physiology and
Behaviour, 201, 146-156. doi: 10.1016/j.physbeh.2018.11.036.
• Oliveira, R., Brito, J., Martins, A., Mendes, B., Marinho, D., Ferraz, R., & Marques, M.C. (2019). In-season internal and external training load quantification of an elite European soccer team. Plos One, 14(4): e0209393. https://doi.org/10.1371/journal. pone.0209393.
This Doctoral Thesis was also supported by the following congress presentations:
• Oliveira, R., Brito, J., Martins, A., Mendes, B., Ferraz, R. & Marques, M.C. (2019). In-season training load quantification of one-, two- and three-game week schedules in a top European professional soccer team. Revista Motricidade 15(s1), 96. http://dx.doi.org/10.6063/motricidade.16967. CIDESD 2019 International Congress. Instituto Universitário da Maia (ISMAI). Oral Presentation.
• Oliveira, R., Brito, J., Martins, A., Mendes, B., Marinho, D., Ferraz, R. & Marques, M.C. (2019). In-season internal and external training load quantification of an elite European
soccer team. Revista Motricidade 15(s1), 116.
http://dx.doi.org/10.6063/motricidade.16967. CIDESD 2019 International Congress. Instituto Universitário da Maia (ISMAI). Poster presentation.
Abstract
The higher level of competitiveness in soccer lead coaches to a better training load management in order to avoid accumulative fatigue, to keep the best performance possible of their team and, consequently, to prepare the team to win the game. Thus, it is relevant to quantify training load applied to the players to get better the control and monitoring of the team as well as to get knowledge about the periodization applied. Therefore, the general aim of this thesis was to quantify external and internal training load during in-season 2015-2016 from a top elite European soccer male team. For the accomplishment of this purpose, the following sequence was used: (i) literature review of the current subject; (ii) the study of training load quantification during in-season; (iii) the study of training load quantification of one, two and three games week. The main conclusions were: (i) there were minor changes across the in-season period for the internal and external training load variables used; (ii) there was a decrease of training load until the day prior to the match for all variables; (iii) external training load was reduced from the following day of the match until the day prior to the match, however internal training load variables does not reveal the same pattern; (iv) training load
applied in weeks with different number of matches seems similar.This thesis allows to obtain
references about the periodization pattern observed across a full competitive season and allows generate reference values for elite players that can be considered for the coaches in the control and monitoring of the training load.
Keywords
Soccer Training; Internal Load; External Load; Training Load; Periodization; Training Load Quantification; Global Positioning System; Session Rating of Perceived Exertion; Hooper Index.
Resumo
O aumento da competitividade no futebol tem obrigado aos treinadores uma melhor gestão do treino para prevenir fadiga acumulada da sua equipa, para que seja possível jogar na melhor com elevado rendimento e, consequentemente, ganhar jogos. Dessa forma, torna-se relevante quantificar a carga de treino aplicada aos jogadores e perceber qual o tipo de periodização aplicada. Assim sendo, o objetivo geral da presente tese foi quantificar a carga de treino externa e interna da época 2015-2016, numa equipa europeia elite de classe mundial masculina de futebol. Para operacionalizar o objetivo geral, utilizou-se a seguinte sequência: (i) revisão da literatura; (ii) estudo sobre a quantificação da carga de treino da época completa; (iii) estudo sobre a quantificação da carga de treino em semanas com um, dois e três jogos. As principais conclusões foram: (i) existem alterações mínimas nas variáveis de carga externa e interna usadas durante a época; (ii) existe uma redução da carga de treino no dia antes do jogo em todas as variáveis; (ii) a carga externa vai sendo reduzida desde o primeiro dia após jogo até ao dia anterior ao jogo seguinte, no entanto as variáveis de carga interna nem sempre revelam o mesmo comportamento; (iii) a carga aplicada em semanas com números de jogos diferentes é semelhante. Esta tese permite obter referências sobre o padrão de periodização observado ao longo de uma temporada competitiva completa e permite gerar valores de referência para jogadores de elite que podem ser considerados pelos treinadores no controle e monitorização da carga de treino.
Palavras-chave
Treino de futebol; Carga Interna; Carga Externa; Carga de Treino; Periodização; Quantificação da Carga; Sistema de Posicionamento Global; Perceção Subjetiva de Esforço da Sessão; Índice de Hooper.
Résumé
La compétitivité accrue dans le football a obligé les entraîneurs à mieux gérer l'entraînement pour éviter la fatigue accumulée de leur équipe, afin qu'il soit possible de jouer dans les meilleures conditions et, par conséquent, de gagner les matchs. Ainsi, il devient pertinent de quantifier la charge d’entraînement appliquée aux joueurs, de comprendre le type de périodisation appliqué. L'objectif général de cette thèse était donc de quantifier la charge d'entraînement interne et externe de la saison 2015-2016, au sein d'une équipe de football de haut niveau, composée d'hommes européens. Afin de rendre l'objectif général opérationnel, la
séquence suivante a été suivie: (i) revue de la littérature; (ii) quantifier la charge
d'entraînement de la saison complete; (iii) quantifier la charge d'entraînement appliquée en semaines avec un, deux et trois matchs. Les principales conclusions sont les suivantes: (i) il y a eu des changements mineurs au cours de la période de la saison pour les variables internes et externes de TL utilisées; (ii) il y a une réduction de la charge d'entraînement la veille du match pour toutes les variables; (iii) la charge externe révélée est réduite dês le lendemain du match jusqu'à la veille du match suivant, cependant les variables de la charge externe ne présentent pas toujours le même comportement; (iv) la charge appliquée pendant les semaines avec un nombre de matchs différents est similaire.Cette thèse permet d'obtenir des références sur le schéma de périodisation observé pendant une saison de compétition complète et de générer des valeurs de référence pour les joueurs d'élite pouvant être prises en compte par les entraîneurs dans le contrôle et le suivi de la charge d'entraînement.
Mots-clés
Entraînement de Football; Charge Interne; Charge Externe; Charge D'entraînement; Périodisation; Quantification de la Charge; GPS; s-RPE; Index Hooper.
Table of Contents
Dedication iii Acknowledgements vii List of Publications ix Abstract xi Resumo xiii Résumé xvIndex of Figures xix
Index of Tables xxi
List of Abbreviations xxiii
Chapter 1. General Introduction 1
Chapter 2. Literature Review 5
Chapter 3. Experimental Studies
Study 1. In-season internal and external training load quantification of an
elite European soccer team
19
Study 2.In-season training load quantification of one-, two- and three-game
week schedules in a top European professional soccer team 39
Chapter 4. General Discussion 65
Chapter 5. Overall Conclusions 69
Chapter 6. Suggestions for future research 71
Chapter 7. References 73
Appendix I 103
Index of Figures
Chapter 3 Study 1Figure 1. External TL data for training duration, total distance and HSD in respect to mesocycles between player positions.
Abbreviations: (A) training duration; (B) total distance; (C) HSD; (CD), central defenders; (WD), wide defenders; (CM), central midfielders; (WM), wide midfielders; (ST), strikers. a denotes significant difference in CD versus WD, (b) denotes significant difference in WD versus WM, (c) denotes significant difference in WD versus ST, (d) denotes significant difference CM versus WM, all p < 0.05.
25
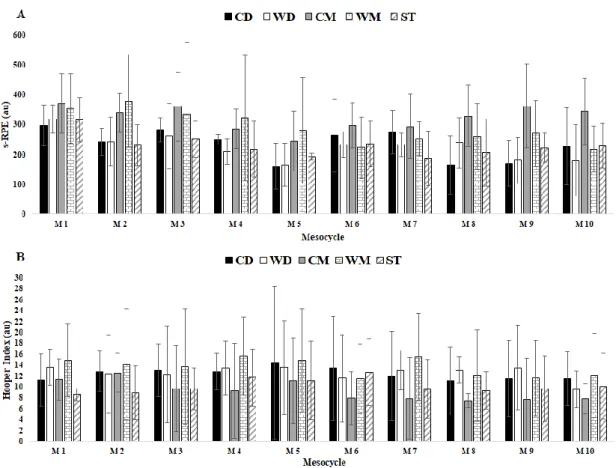
Figure 2. Internal TL data s-RPE and HI in respect to mesocycles between player positions.
Abbreviations: (A) s-RPE; (B) HI; (CD), central defenders; (WD), wide defenders; (CM), central midfielders; (WM), wide midfielders; (ST), strikers. a denotes significant difference in CD versus WD, (b) denotes significant difference in WD versus WM, (c) denotes significant difference in WD versus ST, (d) denotes significant difference CM versus WM, all p < 0.05.
27
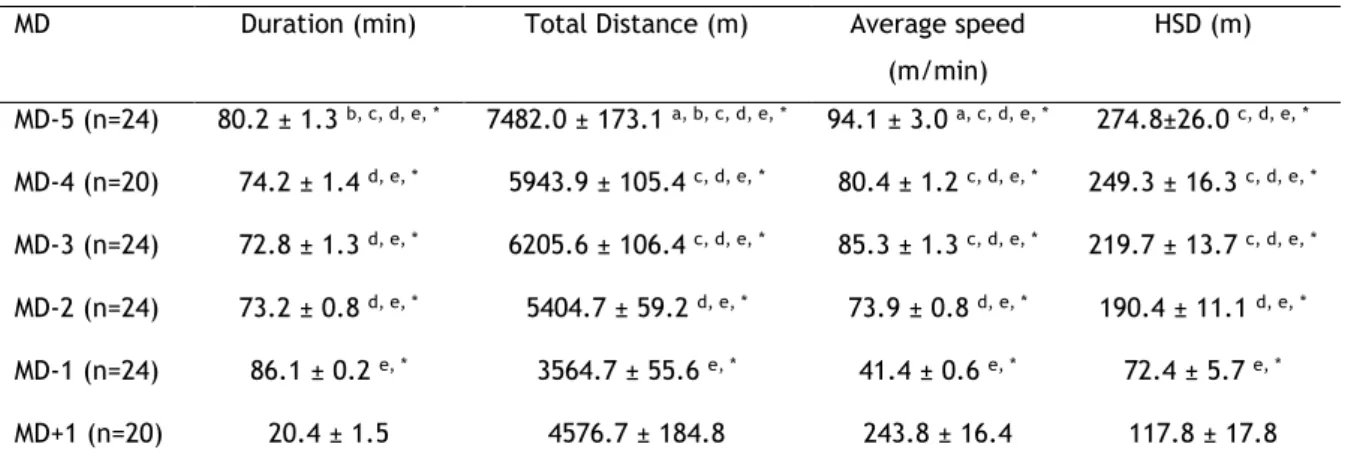
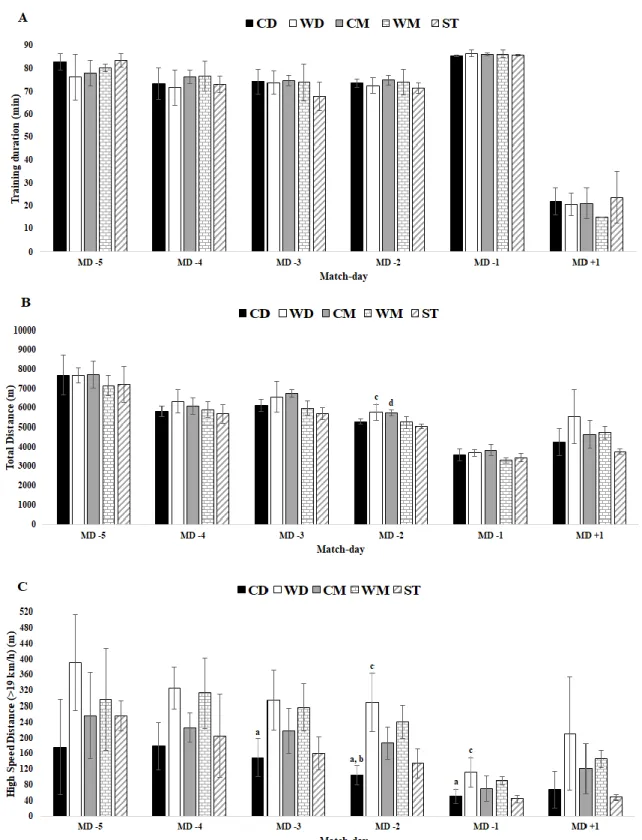
Figure 3. External TL data for training duration, total distance and HSD in respect to days before a competitive match between player positions.
Abbreviations: A) training duration; (B) total distance; (C) HSD; (CD), central defenders; (WD), wide defenders; (CM), central midfielders; (WM), wide midfielders; (ST), strikers. (a) denotes significant difference in CD versus WD, (b) denotes.
29
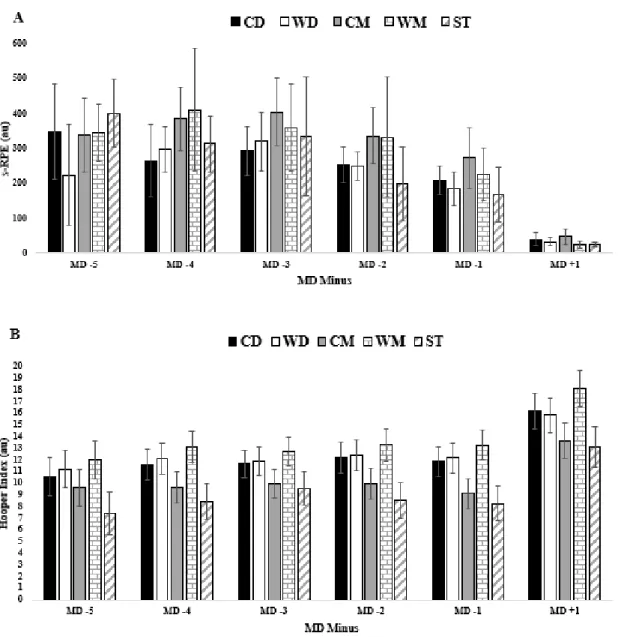
Figure 4. Internal TL data for s-RPE and HI in respect to days before a competitive match between player positions.
Abbreviations: A) s-RPE; (B) HI; (CD), central defenders; (WD), wide defenders; (CM), central midfielders; (WM), wide midfielders; (ST), strikers. (a) denotes significant difference in CD versus WD, (b) denotes.
31
Chapter 3 Study 2
Figure 1. Comparisons between 5 microcycles/weeks for total distance and training intensity of zone 1 (0-10.9km/h). a denotes difference from M1, b denotes difference from M2, c denotes difference from M3, d denotes difference from M4 and e denotes difference from M5, all P < 0.05. * moderate effect size, ** very large effect size.
Figure 2. Comparisons between 5 microcycles/weeks for training intensity of zones 2 (11-13.9 km/h) and zone 3 (14-18.9 km/h). a denotes difference from M1, b denotes difference from M2, c denotes difference from M3, d denotes difference from M4 and e denotes difference from M5, all p < 0.05. * moderate effect size, ** very large effect size.
53
Figure 3. Comparisons between 5 microcycles/weeks for training intensity of zone 4 (19-2.9 km/h) and zone 5 (> 24km/h). a denotes difference from M1, b denotes difference from M2, c denotes difference from M3, d denotes difference from M4 and e denotes difference from M5, all p < 0.05. * moderate effect size, ** very large effect size.
54
Figure 4. Comparisons between 5 microcycles/weeks for duration and s-RPE. a denotes difference from M1, b denotes difference from M2, c denotes difference from M3, d denotes difference from M4 and e denotes difference from M5, all p < 0.05. * moderate effect size, ** very large effect size.
55
Figure 5. Comparisons between 5 microcycles/weeks for RPE and CK. a denotes difference from M1, b denotes difference from M2, c denotes difference from M3, d denotes difference from M4 and e denotes difference from M5, all p < 0.05. * moderate effect size, ** very large effect size.
Index of Tables
Chapter 2. Literature Review.Table 1. Averages distances covered during matches. Adapted from Vigne et al. (2010). 7 Table 2. Rating of perceived exertion scale. 13
Chapter 3. Study 1.
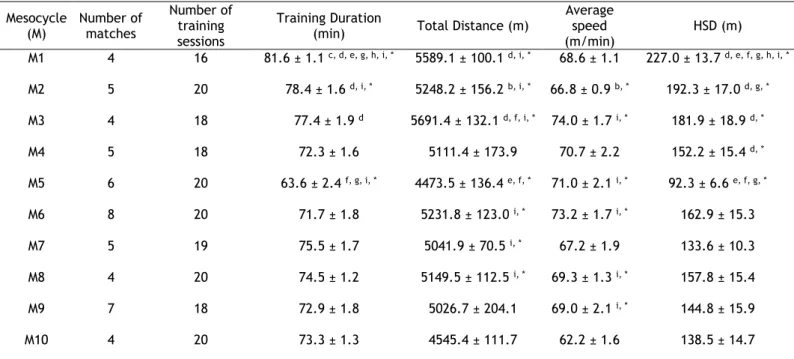
Table 1. External Training Load Data during the ten mesocycles for squad average, Mean ± SD.
24
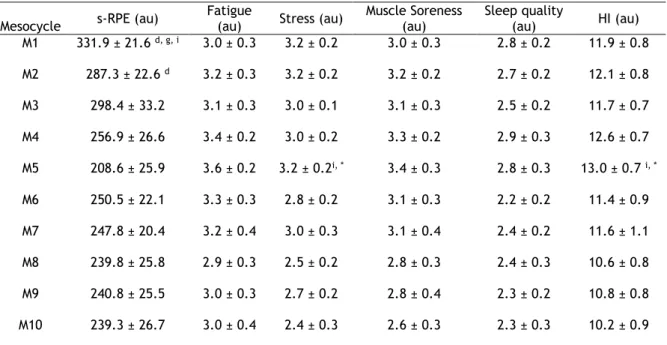
Table 2. Internal Training Load Data during the ten mesocycles for squad average, Mean ± SD.
26 Table 3. External Training Load Data during the MD minus for squad average, Mean ± SD.
28
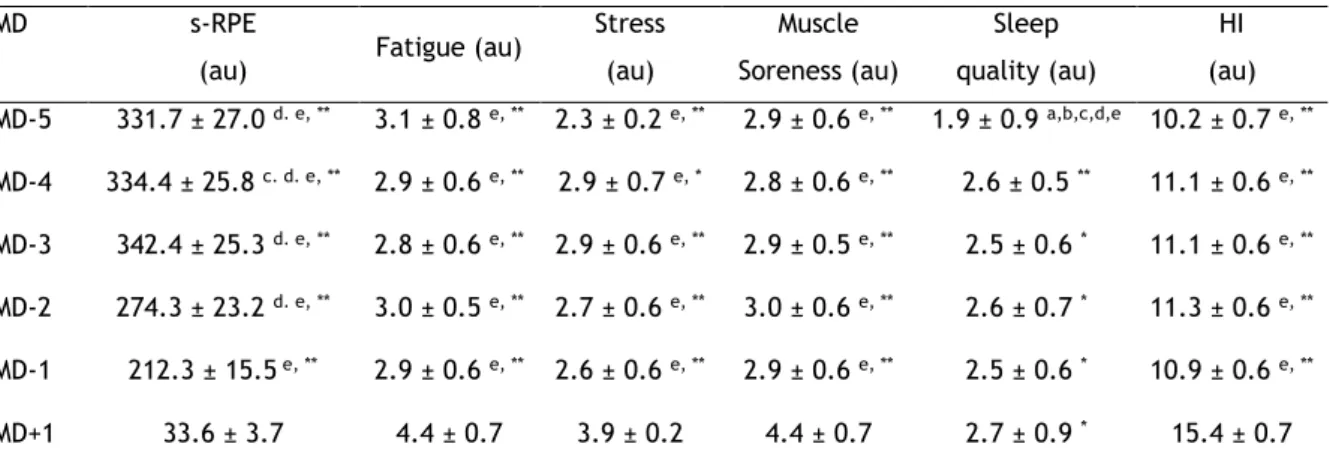
Table 4. Internal Training Load Data during the MD minus for squad average, Mean ± SD.
30
Chapter 3. Study 2.
Table 1. Weekly training for microcycles with one-, two- and three-games week. Abbreviations MD- = matchday minus (5, 4, 3, 2, 1); MD+1 = matchday plus 1.
43 Table 2. Training and match duration (minutes) during the 7-day testing period for squad average.
46
Table 3. Distances covered at different speed thresholds (representative of squad average data) during training and matched completed in the 7-day testing period.
47
Chapter 4. General Discussion.
Table 1 - Average interval ranges values for external and internal TL variables with one-game week.
List of Abbreviations
ANOVA Analysis of Variance
ATP Adenosine Triphosphate
au Arbitrary Units
AvS Average Speed
CK Creatine Kinase
CD Central Defenders
CM Central Midfielders
CNS Central Nervous System
CV Coefficient of Variation
DOMS Delayed Onset Muscle Soreness
ES Effect Size
GPS Global Positioning System
HI Hooper Index
HR Heart Rate
HSD High-speed distance
HSRD High-speed Running Distance
Hz Hertz
ITL Internal Training Load
km Kilometer
Km/h Kilometre per hour
MD Match Day
MD- Match Day Minus
MD+ Match Day Plus
m Meters
m/min Meters per minute
m/s Meters per second
min Minutes
RPE Rating of Perceived Exertion
SEE Standard Error of the Estimate
s-RPE Session Rating of Perceived Exertion
ST Strikers
TL Training Load
U/L Units per litre
UEFA Union of European Football Associations
VO2 max Maximal Oxygen Uptake
WD Wide Defenders
Chapter 1. General Introduction
Elite soccer teams that play in Europe competitions such Union of European Football Associations, (UEFA) Champions League or UEFA European League had a scheduling dictated by external factors (e.g. television subscription rights) and consequently, they have congestive periods by playing two or three games per week. For this reason, the number of weekly soccer training sessions depends on the number of games played each week. Usually, in top elite European teams, training frequency can vary between 2–6 training sessions per week. Moreover, adequate recovery time is required between matches to maximise physiological adaptations and technical/tactical performance and it should also be considered in the periodization model chosen by the coach. (Anderson, Orme et al., 2016a; Duppont et al., 2010; Morgans, Orme, Andreson, Drust & Morton, 2014a; Thorpe, Atkinson, Drust & Gregson, 2016a).
The concept of periodization is a common topic of discussion among coaches and sports scientists. Classically, periodization can be divided into 3 levels: the macrocycle (long-length, lasting 3–4 months); the mesocycle (mid-length, lasting 2-4 weeks); and the microcycle (short-length, lasting 1-7 days). Each macrocycle generally begins with a format of high-volume, low-intensity training and ends with a reverse format of high-low-intensity, low-volume training (Bompa & Haff, 2009; Matveyev, 1981; Plisk & Stone, 2003). In general, the macrocycle comprises four phases: (a) preparation (general and special); (b) competition; (c) peaking; and (d) transition or active rest. All these phases have different goals and degrees of variation.
However, classic periodization is somewhat difficult to put into practice during soccer trainings, because it is essential that the team is well-prepared for the game every week. For instance, top European players usually participate in 1-2 training sessions between two consecutive matches. For this reason and in this case, coaches can only implement recovery training. (Akenhead, Harley & Tweddle, 2016a; Anderson et al., 2016a, 2016b; Malone et al. 2015; Stevens, Ruiter, Twisk, Savelsbergh & Beek 2017).
In order to ensure proper periodization during the in-season, it is necessary to quantify the training load (TL). The TL is a combination of different variables, such as volume and intensity, that can be controlled during each training session (Impellizzeri, Rampinini & Marcora, 2005). The TL can be divided into two main domains: external and internal. External TL is associated with physical work performed during a training session or match, while internal TL is related to the physiological response to an external training stimulus (Impellizzeri, et al., 2005; Vanrenterghem, Nedergaard, Robinson & Drust, 2017). The TL response can further be subdivided into acute and chronic responses to a given training stimulus. An acute response is related to a training unit or a set of 3-7 training sessions, whereas a chronic response is associated with the accumulation of many training sessions from a single week to several months throughout the entire in-season or annual cycle (Bompa & Haff, 2009).
Taylor (2012) has stated that the most important reasons for monitoring internal and external TL are to prevent injury (29%), to observe the effectiveness of the training program (27%), to maintain performance (22%) and to prevent overtraining (22%). In brief, all data collected regarding TL can help coaches determine whether athletes are ready to compete (Halson, 2014), avoiding negative consequences of fatigue.
Fatigue is a concept linked to training load (Akenhead & Nassis, 2016b; Djaoui, Haddad, Chamaric & Dellal, 2017; Kellis, Katis & Vrabas, 2006; McMorris & Graydon, 1997; Mohr, Kustrup & Bangsbo, 2003, 2005; Saw et al., 2015; Thorpe et al., 2015, 2016a,b; Thorpe, Atkinson, Drust & Gregson, 2017). Fatigue can affect motor and perceptual processing, both of which are associated with physiological and metabolic impairments that can reduce muscular strength capacity, affect coordination, and consequently decrease performance in the next minutes and/or days (Kellis et al., 2006; Krustrup, Zebis, Jensen & Mohr, 2010; McMorris & Graydon, 1997; Mohr et al., 2003, 2005). If training load is not properly controlled, excessive fatigue and overreaching may occur (Brink, Visscher, Coutts & Lemmink, 2012; Thorpe et al., 2017). According to several authors (Bradley et al., 2009; Di Salvo, Gregson, Atkinson, Tordoff & Drust, 2009; Krustrup et al., 2006; Mohr et al., 2003, 2005; Vigne, Gaudino, Rogowski, Alloatti & Hautier, 2010), the physical demands of a match, such as long distances covered, high-intensity periods of sprinting and jumping can result in fatigue. For instance, it has been well-documented that the distance that players cover at running speed declines significantly from the first to the second half of elite soccer matches (Di Salvo et al., 2009; Krustrup et al., 2010), as well as temporarily following the most intensive periods of the match (Bradley et al., 2009; Di Mascio & Bradley, 2013; Krustrup et al., 2006).
However, the scientific community has only recently begun to study in more detail the in-season periodization of elite soccer teams, specifically training days during weekly microcycles (Akenhead et al., 2016a; Anderson et al., 2016a, 2016b; Malone et al., 2015; Owen, Lago-Peñas, Gómez, Mendes & Dellal, 2017; Stevens et al., 2017). Despite previous attempts to quantify TL in elite soccer players, only a limited number of studies have systematically quantified both acute and chronic responses using external and internal variables, specifically regarding training periodization of top elite European soccer teams.
Considering the aforementioned, the aim of this thesis is to quantify the external and internal TL of elite soccer players during an in-season. Specifically, the purpose aims to analyse data collected during an in-season in one-game weeks and in five microcycles with one-, two- and three-game weeks.
It was hypothesized that training load is lower on training days closer to the next match and that the intensities and volume probably remain constant throughout the competitive period. Moreover, the training load during the microcycle differ with the number of games per week.
This thesis is organised as follows:
Chapter 2 provides an overview of soccer game physiology, fatigue and soccer, soccer periodization and training load in soccer.
Chapter 3 presents the experimental studies developed to accomplish the main aim of this thesis:
• Study 1 investigates internal and external TL quantification of top elite European soccer teams during an entire in-season;
• Study 2 demonstrates the quantification of one-, two- and three-game
week schedules in a top elite European soccer team.
A general discussion of the results is presented in Chapter 4, and Chapter 5 presents the main conclusions of this thesis. Lastly, Chapter 6 offers suggestions for future research.
Chapter 2. Literature review
Soccer game physiology
From a physiological perspective, soccer is highly complex because requires different physiological energy systems to meet the physical demands of the game (Malone et al., 2015). This sport is characterised by intermittent bouts of low- and high-intensity activities (Drust, Atkinson, Reilly, 2007). Top elite soccer players cover approximately 10–13 kilometer (km) during a soccer match (Dellal et al., 2011; Di Salvo et al., 2007). When analysed by position, central midfielders (CM) tend to cover a greater total distance than other positions, while central defenders (CD) cover lower total distance than other positions (excluding goalkeepers) during a soccer match (Bradley et al., 2009; Di Salvo et al., 2007). In regard to high-speed running distances (> 14.4 km/h), wide midfielders (WM) cover higher distances compared to other positions (Bradley et al., 2009). According to Mohr, Krustrup and Bangsbo (2003), each player performs around 1000–1400 movements that can change every 4–6 seconds (sec) during a match. These movements include accelerations/decelerations, kicking, dribbling and tackling (Bangsbo, 1994a), 30–40 sprints (Bangsbo, Mohr, & Krustrup, 2006), more than 700 turns (Bloomfield, Polman & O’Donoghue, 2007) and 30–40 tackles and jumps (Bangsbo et al., 2006). Furthermore, many of these actions could be performed at a high-intensity level (Duppont, Moalla, Guinhouya, Ahmaidi & Berthoin, 2004) and they could be performed with the direct aim of scoring goals to win matches.
Nevertheless, soccer matches are primarily characterised by long durations of moderate- to low-intensity activity (Di Salvo et al., 2007). As such, aerobic metabolism (Stolen, Chamari, Castagna & Wisloff, 2005), humans’ main metabolic energy source, is especially important for soccer players. Bangsbo (1994b) has verified the importance for soccer players by affirming that more than 90% of total energy consumption during a match is aerobic metabolism.
Physical requirements of the soccer players
Soccer has been described as stochastic, acyclical and intermittent, and is unique in its variability and unpredictability. Soccer match-play is characterised by its sporadic nature, whereby multidirectional physical actions are combined with an array of technical skills. The games last a total of 90 minutes (min), during which players perform different activities at different intensities (Bangsbo et al., 2006; Bradley et al., 2009; Wallace & Norton, 2014; Wragg, Maxwell & Doust, 2000). During the game, players make 1000–1400 short-duration actions—with and without the ball—that change every 3–5 sec, including running at different velocities, dribbling, tackling, changing direction, accelerating, decelerating, jumping, kicking, running backwards and sideways, disputes, etc., (Mohr et al., 2003) according to game circumstances
(Drust et al., 2007).Moreover, the average player’s ball-time possession per game is 44.6 – 74.3 sec, and the number of touches on the ball by individual possession is 1.9 – 2.2 sec, revealing the importance of the game without the ball and speed actions (Dellal et al., 2011). The importance of analysing the intensity and frequency of players’ movements throughout the entire match, since approximately 98% of the distance covered by players occurs when they are not in possession of the ball (Reilly & Thomas, 1976). Di Salvo et al. (2007) have observed that only 1.2 – 2.4% of a player’s running distance in match-play is covered with possession of the ball. Moreover, 7–12% of the overall distance covered by players is at a high-intensity speed and 1–4% is covered while sprinting (Bradley et al., 2009; Di Salvo et al., 2010).
Distances at different threshold speeds in soccer players
Soccer games last 90 min. There are two halves of 45 min each, with a 15-min halftime break. According to Castellano, Blanco-Villaseñor and Álvarez (2011), the effective time of the game is nearly 50 min, or 55% of the total duration of the game. During this time, top elite players cover between 10–13 km (Bangsbo et al., 2006) at a medium-intensity speed near the anaerobic threshold (80%–90% maximal HR), with an 2.2/18 sec of an intermittent effort profile corresponding a 1:8 ratio of work/rest (Vigne, Gaudino, Rogowski, Alloatti & Hautier, 2010). Furthermore, Drust, Reilly and Cable (2000) have discovered that, in the Football Association Premier League, soccer players undertake an average of 19 sprints every 45 min during match-play. In addition, Strudwick, Reilly and Doran (2002) have observed an average change in activity every 3.5 sec, a bout of high-intensity activity every 60 sec, and a display of maximal effort every 4 min. However, these distance values can differ depending on the system game presented by each team (Bradley et al., 2011) and on the player’s position. Thus, soccer players perform low- to moderate-intensity aerobic activities during 80–90% of a match, and only perform high-intensity anaerobic activity during 10-20% a match (Bangsbo, 1994a; Guerra & Barros, 2004; O’Donoghue, 1998; Reilly & Thomas, 1976; Rienzi, Drust, Reilly, Carter & Martin, 2000).
As previously stated, soccer players need to be capable of performing intense, repeated actions and therefore, players need to develop excellent overall fitness, such as speed, muscle strength, anaerobic power, agility and maximal aerobic power (Rampinini, Impellizzeri, Castagna, Coutts & Wisloff, 2009). Players also need to develop a large number of technical and tactical decision-making skills and the ability to perform these skills under pressure and when fatigued (Gabbett, Jenkins & Abernethy, 2009). It has been reported that, after a women’s soccer game, the players exhibited changes in several biochemical markers such as creatine kinase, urea, uric acid, myoglobin and C-reactive protein (Andersson et al., 2008), confirming the existence of significant metabolic and mechanical stress (Brancaccio, Maffulli & Limongelli, 2007).
It is estimated that a top elite player performs 150–250 short, intense actions during a game (Mohr et al., 2003). The high ratio of phosphocreatine degradation that occurs during different parts of the game indicates that phosphocreatine is used in adenosine triphosphate (ATP) resynthesize. Thus, aerobic metabolism could be critical for the renewal of phosphocreatine levels (Hof & Helgerud, 2004), since players perform actions under aerobic conditions for most of the game (Castellano et al., 2011; Guerra & Barros, 2004). High-intensity activities are defined as those that are carried out from 5.3–6.3 meters per second (m/s) (Di Salvo et al., 2007). Sprinting specifically is performed at over 7 m/s (Rampinini et al., 2007).
The following table 1 presents the average data collected from a top elite Italian soccer team.
Table 1. Averages distances covered during matches. Adapted from Vigne et al. (2010).
Speed (km/h) < 5 5-13 13-16 16-19 >19 Average Percentage (%) 38.9% 29.5% 13.3% 8.4% 9.8% 100% Distance covered (m) 3477 ± 1433 2631 ± 1097 1192 ± 487 750 ± 314 878 ± 433 8929 ± 3515 Distance/minute (m/min) 46.85 ± 3.85 35.65 ± 5.63 16.40 ± 3.08 1.51 ± 2.48 12.4 ± 405 121 ± 9.57
The literature indicates that, overall, soccer players sprint a total distance of 16 meters (m) in 2–4 sec intervals, and this action is repeated approximately every 70–90 sec of the game, which corresponds to 0.5–3% of effective playing time (Stolen et al., 2005).
Sprinting is crucial because it is utilised at key moments during a match, allowing a player to escape from his opponent and/or to reach a free zone to shoot on the goal or to make a decisive pass (Faude, Koch & Meyer, 2012). Thus, short-sprinting performance can be an important determinant of match-winning actions (Cometti, Maffiuletti, Pousson, Chatard & Maffulli, 2001). During high-intensity sprints (> 6.3 m/s), players cover between 9.9 – 32.5 m of the total distance (average of 19.3 ± 3.2 m) over the course of 17.3 ± 7.7 (range of 3–40) sprints (Di Salvo et al., 2007). During the European Champions League and UEFA Cup, the average number of sprints (> 7 m/s) varied based on the player’s position: wide midfielders (35.8 ± 13.4), forwards (attackers; 30.0 ± 12.0), wide defenders (29.5 ± 11.7), central midfielders (23.5 ± 12.2) and central defenders (17.3 ± 8.7) (Di Salvo et al., 2010). In terms of sprinting distance analysed (0–5 m, 5.1–10 m, 10.1–15 m, 15.1–20 and > 20 m), players were found to sprint more in the first section (0-5 m), with differences noted according to each player’s position in the English Premier League (Di Salvo et al., 2010).
The greatest covered distances reported are performed by midfielders, who act as links between the defence and the attack (Reilly & Thomas, 1976; Rienzi et al., 2000). Also, midfielders cover more distance at a walking or low-speed running pace, while strikers (also known as forwards) cover more distance at higher speeds and back defenders tend to take
lateral or back actions. In addition, Bloomfield et al. (2007) observed that midfielders cover greater distances because they connect the defence to the team’s front line. The same authors also reported that strikers cover less distance than defenders and midfielders and they support a specific training by position. Bangsbo (1994b) has also reported that midfielders cover higher distances (11.5 km) than defenders and strikers, who cover approximately the same mean distance (10–10.5 km).
Midfielders, moreover, appear to engage more frequently in low- to moderate-intensity activity, and for longer durations (Bangsbo, 1994a). In addition, they are stationary for significantly less time than other outfield players (O’Donoghue, 1998), which aligns with their covering greater distances than defenders and strikers. However, strikers have been found to perform the most maximal sprints and for longer durations, followed by midfielders and defenders (O’Donoghue, 1998). Rienzi et al. (2000) have also noted that defenders perform more backwards movement than strikers: high-intensity backwards and lateral movements require an elevated energy expenditure of 20–40% in comparison to forwards running (Reilly & Williams, 2003).
Central midfielders have consistently been found to cover the greatest total distance, while full backs, central midfielders and wide midfielders run greater distances at higher speeds (Bradley et al., 2009; Di Salvo et al., 2007, Di Salvo, Gregson, Atkinson, Tordoff & Drust, 2009). Moreover, the extant research has noted positional differences in maximal oxygen uptake
(VO2max), with central midfielders and full backs displaying the highest values (Reilly, Bangsbo,
& Franks, 2000). However, other study has found no differences (Haugen, Tønnessen, Hem, Leirstein, & Seiler, 2014). Nevertheless, central midfielders and full backs consistently exhibit the greatest physical capacity during intermittent running tests (Mohr et al., 2003; Reilly et al., 2000). Additionally, central midfielders and full backs perform and complete more passes
compared to other positions (Redwood-Brown, Bussell, & Bharaj, 2012).
According to Bush, Barnes, Archer, Hogg and Bradley (2015), there is a positioning evolution of the players in technical and tactical actions. Players in wide and attacking positions covered greater distances and at high-intensities than central defenders and central midfielders between 2006–07 and 2012–13 in the English Premier League. In contrast, the number of passes and pass completion rates of central players were found to have increased over the same period. These evolutionary trends could be attributed to tactical modifications.
Barnes, Archer, Hogg, Bush and Bradley (2014) observed that high-speed running and sprinting distances increased by 30–50% in the English Premier League, while the overall number of passes increased by 40% across seven seasons. Thus, it would appear that the evolution of tactical and technical actions in soccer has changed the physical and performance demands of the game.
Fatigue and Soccer
In the beginning of 20th century, Mosso (1904) concluded that two phenomena affect fatigue:
“The first is the reduction of the muscular force. The second is fatigue as a sensation”. In the early 80 sec, Edwards (1981) stated that fatigue is “the failure to maintain the required or expected force”.
Fatigue can be divided in peripheral and central. Peripheral fatigue is associated with a reduction in muscle force production caused by processes distal to the neuromuscular junction (Ament & Verkerke, 2009). According to Hill and Flack (1910), it was concluded that the main factor limiting players’ exercise tolerance was the heart's ability to pump blood to the active muscles. They predicted that fatigue develops as a consequence of the heart no longer being able to supply oxygen, which is associated with the failure of homeostatic heart function. More recently, emphasis has been placed on the accumulation and difficulty in the removal of excess hydrogenations as a result of anaerobic metabolism. The cardiovascular system is not able to remove waste products from the working muscles (Noakes, 2012). The accumulation of lactic acid directly interferes with contractile ability of the muscle fibres, causing muscle fatigue. Moreover, in many circumstances, fatigue occurs prior to high concentrations of metabolites (such as lactate, Hydrogen ion, extracellular potassium ion) and without disturbances to muscle calcium ion kinetics, high core temperatures or significant hypo hydration (Noakes, 2000). On the other hand, it has been proposed that fatigue is the result of a failure of the central nervous system (CNS), in which a loss of muscle force occurs through processes proximal to the neuromuscular junction, also known as central fatigue. It is associated with periods of diminished neural drive in the CNS to the muscle (Noakes, St Clair Gibson & Lambert, 2005; Taylor, Todd & Gandevia, 2006). Davis and Bailey (1997), however, suggest that central fatigue
is only accepted when experimental findings do not support any peripheral causes of fatigue.
Indeed, CNS plays a crucial role in the maintenance of homeostasis (Lambert, Gibson & Noakes, 2005), and the motor cortex of the brain is responsible for the generation of the motor drive and the recruitment of motor units during exercise (Lambert et al., 2005). The brain assumes control of the cognition and recognition of physical sensations that are perceived as fatigue. The perceived fatigue caused by exercise is felt as a “sensation” and is common during exercise. The workload may create such an intense sensation that is perceived as necessary to reduce force to successfully complete the activity (i.e., pacing), or even cease exercise entirely if the sensation becomes too severe (Noakes, 2011).
Running performance declines from the first to the second half during an elite match, or temporarily after the most intense periods (Bendiksen et al., 2012; Bradley et al., 2009; Di Mascio & Bradley, 2013; Krustrup et al., 2006). A reduction in the distance covered could be attributed to fatigue because the muscle glycogen stores have depleted by the end of the match (Bendiksen et al., 2012; Krustrup et al., 2006), with temporary declines after intense periods
of activity during the game that could be associated with intramuscular acidosis or the accumulation of potassium in the muscle interstitium (Mohr, Krustrup & Bangsgo, 2005). The literature has also reported a reduction of 20–40% in the total amount of high-intensity running, specifically in the last 15 min of the match (Bradley et al., 2009; Mohr et al., 2003). These studies also reveal that 5 min of high-intensity running at the beginning of the match are associated with a 12% decrease in the total distance covered at a high-intensity pace in the subsequent 5 min (Mohr et al., 2003), as well as increased recovery times between high-intensity efforts (Bradley et al., 2009) and an 11% performance reduction in the second half. These results indicate that soccer players exhibit two fatigue patterns: a long fatigue pattern associated with long durations (from start of play to the end of the match) and a short fatigue pattern (temporary fatigue) that depends on each game’s unique circumstances (Mohr et al., 2003), and which reduces a player’s ability to perform repeated sprints (Krustrup et al., 2006). In regard to tactical actions, less successful teams from the English Premier League cover greater distances at a higher intensity than their successful counterparts (Di Salvo et al., 2009). Also, players from the most successful teams in the Italian Serie A perform more high-intensity activities during a game when in possession of the ball than do players of less successful teams (Rampinini et al., 2009). It also appears that the high-intensity distance covered by players is greater when moving down from the English Premier League (first league) to the Championship (second league) (Bradley et al., 2009).
Soccer Periodization
In team sports, it is possible and desirable to think of periodization in terms of small periods, such as mesocycles, microcycles or simply training units (Bompa & Haff, 2009). In soccer, the in-season period is usually periodized over consecutive microcycles. Here, each microcyle can last 2–7 training days between matches (Reilly, 2007) and TL can be also adjusted to each player or, at least, to each player position to ensure excellent performance and less overall fatigue (Impellizeri, Rampinini & Marcora, 2005). Previous research has shown that coaches reduce TL after and/or before a match (Akenhead, Harley & Tweddle, 2016; Anderson, Orme et al., 2016; Bangsbo et al., 2006; Impellizeri et al., 2005; Malone et al., 2015; Stevens, Ruiter, Twisk, Savelsbergh & Beek, 2017). However, training periodization in soccer is not only related to training units (i.e. microcycles or mesocycles), but also to other external factors such as congestive scheduling (Anderson et al., 2016; Clemente et al., 2017; Nédélec et al., 2012). During congested periods, 2–3 games will be scheduled per week over the course of several weeks (Clemente et al., 2017; Nédélec et al., 2012). Thus, top elite soccer teams that participate in European competitions usually play 2–3 games per week, and therefore can only participate in 2–3 training sessions during a weekly microcycle. Consequently, the majority of
these training units are thus mainly for recovery (Bangsbo et al., 2006), making it difficult to coach periodized microcycles to maintain or improve physiological adaptations.
Training Load in Soccer
According to Impellizeri et al. (2005), TL includes all variables that can be controlled for during training periodization, such as intensity, duration and frequency. The authors further note that TL can be divided into external and internal TL. While external TL is associated with the physical work performed during a training session or match, internal TL is related to various biochemical (physical and physiological) and biomechanical stress responses (Impellizeri et al.,
2005; Vanrenterghem, Nedergaard, Robinson & Drust, 2017). Top elite soccer teams often
participate in more than one game per week, and thus play more games per season, which makes it more difficult for coaches to manage players’ TL and avoid accumulated fatigue. The quantification of external and internal TL is, therefore, crucial to understanding individual players’ responses to each training session to ensure optimal match-day performance and recovery during the entire in-season (Morgans, Adams, Mullen, McLellan & Williams, 2014; Nédélec, 2012). For example, inappropriate TL management can significantly increase the risk of injury (Jones, Griffiths, Mellalieu, 2017; Soligard et al., 2016; Thorpe et al., 2016). Yet, this information is still not enough for players, coaches and therapists to reach sound conclusions regarding the periodization of elite soccer teams (Malone et al., 2015), especially European teams that participate in European competitions.
External Training Load
In order to avoid a higher injury rate (Dupont et al., 2010), higher risk of banal illness (Foster, 1998), low levels of recovery (Nédélec et al., 2012) and, consequently, inappropriate TL, each player’s training response needs to be monitored. In this regard, there are many variables that can help to control a player’s training response, such as muscular power output, speed, acceleration, time-motion analysis and neuromuscular function (Halson, 2014). One valid way to control the physical work performed during each training session or match is to use a global positioning system (GPS) to quantify players’ movements demands of players during training and competition (Carling, Bloomfield, Nelson & Reilly, 2008; Eniseler, 2005). A GPS enables the direct tracking of a single player (Aughey & Fallon, 2010; Edgecomb & Norton, 2006; MacLeod, Morris, Nevill & Sunderland, 2009) and provides important and detailed information about the player’s movements (frequency, duration, distance, impact, velocity and acceleration). Moreover, a GPS can be used to reveal the external TL variables discussed in the present thesis.
Despite the advantages of using a GPS to analyse external TL, GPS data should be interpreted carefully. Indeed, the technology currently available has some limitations in sampling frequency and quality of satellite coverage. One limitation of a GPS is that the data collected only indicates the linear aspects of displacement. Thus, it is necessary to supplement the data with other information that enriches the description of the players’ physical demands, such as tackles, contacts, impacts, and directionality of displacement (MacLeod et al., 2009).
Some researchers have also analysed the reliability and validity of GPS devices to measure team sport movements using devices with sampling frequencies of 1 Hz, 5 Hz and 10 Hz (Beato, Devereux & Stiff, 2018; Portas, Harley, Barnes & Rush, 2010; Varley, Fairweather & Aughey, 2012). For instance, Portas et al. (2010) have reported a larger range of error in 1 Hz GPS units compared to 5 Hz units for multidirectional courses. In addition, Varley et al. (2012) used 10 Hz GPS units and have found that these units are up to six times more reliable for measuring constant velocity compared to 5Hz units. The 10 Hz GPS units demonstrated lower coefficient of variation (CV%) values by 2.0 – 5.3% during different starting velocities (1–8 m/s) compared to 5 Hz units (CV% 6.3 – 12.4%). These results suggest that the magnitude of measurement error increases when the sampling frequency of the GPS units is reduced.
Recently, Beato et al. (2018) have supported the validity and reliability of 10 Hz GPS (STATSports Viper) with small errors (< 5%) found only for distance and peak speed. The authors compared 400-m running, 128.5-m sports-specific circuit and 20-m linear running. The distance bias in the 400-m trial, 128.5-m circuit, and 20-m trial was 1.99 ± 1.81%, 2.7 ± 1.2%, and 1.26 ± 1.04%, respectively. Peak speed measured by the GPS was 26.3 ± 2.4 km/h, and criterion was 26.1 ± 2.6 km/h, with a bias of 1.80 ± 1.93%. In addition, increases in velocity and multidirectional motion decrease measurement accuracy (Borresen & Lambert, 2009; Portas et al., 2010). Portas et al. (2010) have also reported an increase in standard error of the estimate (SEE%) values across various multidirectional courses, ranging from 45–180 degrees turning actions (2.4 – 6.8 SEE%), as compared to straight line running (2.6 SEE%). However, it should be noted that, even with the new units, accuracy is greater when measuring distance covered at running speeds of lower intensity, while soccer is a sport characterised by short runs or sprinting runs sequenced together (Castellano, 2011; Jennings, Cormack, Coutts, Boyd & Aughey, 2010a; Portas, et al., 2010; Varley et al., 2012). More recently, Rampinini et al. (2015) analysed a linear running course at different intensities, with both acceleration and deceleration movements, to recreate demands similar to those seen in soccer. Compared to the total distance recorded by the 10 Hz GPS unit, 1.9% and 4.7% error were found for total distance and high-speed running, respectively. It should also be noted that the error for very high-speed running (> 20 km/h) was found to be 10.5%. Several studies have indicated that additional error may be introduced into measures when a change of direction occurs, especially at higher velocities (Coutts & Duffield, 2010; Jennings, Cormack, Coutts, Boyd & Aughey, 2010b).
Internal Training Load
Rate of Perceived Exertion
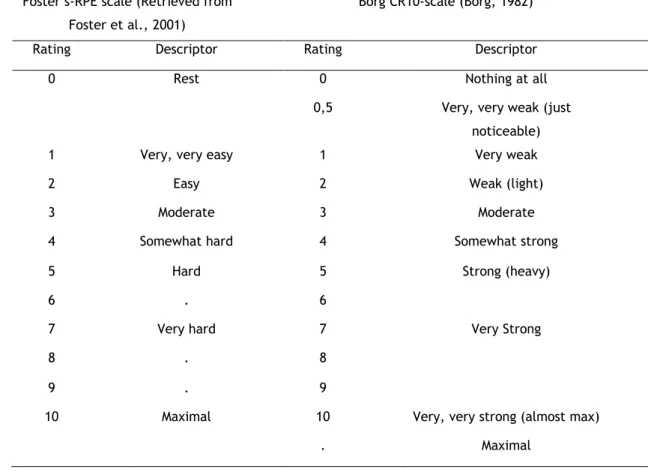
Since the development of the original Borg scale (Borg, 1970) to control the rating of perceived exertion (RPE), several different adaptations have been developed to better control individual exercise intensity, such as, the 10-point scale developed by Foster (Foster et al., 2001). This method of assessing RPE by first calculating the session-RPE (s-RPE) is referred to as the Foster or s-RPE scale and was adapted from the Borg CR10-scale (Borg, 1982) (see table 2). Despite several critical differences between the CR-10 and Foster’s 0–10 scales in the numerical, psychometric properties and semantic descriptors, they are similarly used to determine an individual’s internal response and/or physiological stress to an external stimulus and to provide information regarding their perceived effort post-training or competition. It is clear from the literature that Foster’s scale has proven to be practical, simple to apply, and a popular and valid method of estimating training load for a wide range of activities (Borrenson & Lambert, 2008; Burgess & Drust, 2012; Casamichana, Castellano, Calleja, Román & Castagna, 2013; Coutts, Rampinini, Marcora, Castagna & Impellizzeri, 2009; Dellal, Drust & Lago-Penas, 2012; Foster et al., 2001, 1995; Foster, 1998; Haddad, Stylianides, Djaoui, Dellal & Chamari, 2017; Impellizeri, Rampinini, Coutts, Sassi & Marcora, 2004; Scott, Lockie, Knight, Clark & Janse de Jonge, 2013).
Table 2. Rating of perceived exertion scale Foster s-RPE scale (Retrieved from
Foster et al., 2001)
Borg CR10-scale (Borg, 1982)
Rating Descriptor Rating Descriptor
0 Rest 0 Nothing at all
0,5 Very, very weak (just noticeable)
1 Very, very easy 1 Very weak
2 Easy 2 Weak (light)
3 Moderate 3 Moderate
4 Somewhat hard 4 Somewhat strong
5 Hard 5 Strong (heavy)
6 . 6
7 Very hard 7 Very Strong
8 . 8
9 . 9
10 Maximal 10 Very, very strong (almost max)
Moreover, RPE is also often combined with other variables, such as session duration, heart rate (HR), and blood lactate, to provide additional insights into the internal load experienced by athletes. Thus, the s-RPE is a metric used to quantify internal TL and a product of the duration and intensity reported from a category ratio modified Borg scale (Foster et al., 2001; Foster et al., 1995).
Foster et al. (1995) examined the relationship between known physiological intensity measures, such as HR reserve and blood lactate accumulation and found that s-RPE was useful for determining intensity. This simple method has been shown to be valid and reliable, with individual correlations between session RPE and summated HR zone scores ranging between r = 0.75 and r = 0.90 (Foster, 1998). Some years later, Foster et al. (2001) compared s-RPE values to HR-based training scores, in which time spent in various HR zones (10% incremental zones from 50% - 100%) were multiplied by a weighted value (1-5). While the s-RPE scores tended to overestimate TL, the correlation with the HR scores were consistent across training methods. Impellizzeri et al. (2004) compared s-RPE values with multiple HR-based internal TL scores and
found strong correlations (r = 0.50 to 0.85) with all HR-based methods.Subsequent research in
soccer training has identified individual correlations between RPE and HR zones (range from r = 0.54 to r = 0.78), and a correlation of r = 0.84 has also been reported in endurance athletes (Borrenson & Lambert, 2008).
In addition, in soccer it is possible to perform multiple training sessions on a single day, and thus collect the corresponding s-RPE data. By using Foster’s (2001) 10-point scale multiplied by the session duration (volume), it is possible to provide an overall global score for session TL. When multiple training sessions are performed on a single day, the TL scores are summated to create a daily TL. The TL for each week can then be summated to create a weekly TL. This method is significantly correlated with several methods that are based on HR monitoring (Impellizzeri et al., 2004).
For quantifying internal TL, RPE is cost-effective, easy to collect, and it does not require a specialist or technical expertise. Indeed, RPE only requires some procedures to effectively determine internal TL. Soccer players must be familiar with the RPE scale used to collect regular data. Otherwise, the results may under- or over-represent the actual values. In addition, data also needs to be collected individually to prevent peer pressure from other players influencing the given rating. It is also possible to use a custom-designed application on a portable computer tablet, whereby players can select their RPE rating by touching the respective score on the tablet, which is then automatically saved to the player’s profile. This method can help minimise factors that influence a player’s RPE rating, such as peer pressure or replicating other players’ ratings (Burgess & Drust, 2012). According to Borresen and Lambert (2009), RPE presents a strong correlation with HR during steady-state exercise and high-intensity interval cycling training, but not as well during short-duration, high-high-intensity soccer
exercise intensity because RPE scales are related to physiological parameters such as lactate,
HR and VO2máx, the validity may not be as high as previously thought (Chen, Fan & Moe, 2002).
For example, the weighted mean validity coefficients for HR, blood lactate, and percent of
maximal oxygen uptake (VO2máx) were 0.62, 0.57, and 0.64, respectively (Chen et al., 2002).
Moreover, the RPE scales are related to physiological parameters such as lactate, HR, VO2máx
(Chen et al., 2002) and, although they were initially proposed for individual endurance disciplines (Foster et al., 1995), recent research has shown that they are useful to quantify TL in team sports (Foster et al., 2001), particularly in soccer (Casamichana, 2013; Impellizeri et al., 2004; Scott et al., 2013). Although a wide variety of methods can be used to assess internal load, RPE is still considered a valid and objective method (Dellal et al., 2012; Haddad et al., 2017). For instance, Impellizzeri et al. (2004) used the RPE method to quantify TL in junior soccer players and assess the correlations between RPE and different load quantification methods based on HR. They found significant correlations between RPE and HR-based load quantification methods, especially between the methodologies based on RPE. Alexiou and Coutts (2008) then replicated the study with elite soccer players, and also concluded that the RPE method is a good internal load indicator since it significantly correlates with HR. Moreover, Coutts et al. (2009) evaluated the relationship between HR, RPE and lactate in different soccer training exercises, and have concluded that the RPE method is a more valid indicator of overall exercise intensity than any of the other indicators alone. Finally, Gabbet and Domrow (2007) have found significant correlations between HR and blood lactate concentration, suggesting the use of the RPE method.
In support of its practical application in soccer drills, studies such as Dellal et al. (2011) and Hill-Haas, Dawson, Coutts and Rowsell (2009) used RPE scales to determine exercise intensity and have confirmed its validity for quantifying TL. To prove the robustness of this method, Haddad et al. (2013) further showed that the RPE method can be used to quantify TL, although one must always consider the possibility that players may overestimate or underestimate TL (Borresen & Lambert, 2008). Haddad et al. (2013) also recommended that individual comparisons between players should be avoided and that results should be interpreted to provide an overall perspective of the assessed training or task.
Additionally, Casamichana et al. (2013) compared s-RPE to the Edwards (1993) method of calculating internal TL based on HR data (the time in which the athlete remained in each zone during each session is multiplied by: Zone 1 – 50 to 60% HRmax, factor 1/; Zone 2 – 60 to 70% HRmax, factor 2/; Zone 3 – 70 to 80% HRmax, factor 3/; Zone 4 – 80 to 90% HRmax, factor 4/; Zone 5 – 90 to 100% HRmax, factor 5). Based on all of the aforementioned studies, it is reasonable to state that the s-RPE measure can be utilised across training modalities to provide a good measure of internal TL. Recently, RPE-derived TL was reported to correlate significantly with high-speed running distance, acceleration and number of impacts in elite soccer players (Gaudino et al., 2015).
Recently, Haddad et al. (2017) conducted a review regarding validity ecological usefulness and
influencing factors regarding s-RPE. The authors confirmed the validity, good reliability and
internal consistency of this variable in several sports and physical activities with men and women of different age categories with different expertise levels. The same authors stated that s-RPE could be used as “standing alone” method to control TL but recommend its use with other parameters such as GPS measures and Hooper Index questionnaire. Also, it was recommended individualization in TL assessment as a key to performance optimization. Nevertheless, RPE could also be an oversimplification of the psychophysiological perceived exertion and a non-conclusive measure to capture the wide range of sensations experienced (Ferraz et al., 2017, 2018; Renfree, Martin, Micklewright & Gibson, 2014). Moreover, when RPE is collected minutes following the end of each training session, it would be pertinent to check if there is some atypical variation during the training session, as sustained by Ferraz et al. (2018). Wallace, Stattery and Coutts (2009) assessed the ecological validity of the s-RPE method to quantify internal TL in comparison to HR and distance covered, and have found that an athlete’s and a coach’s perception of internal load differs when using the s-RPE method: athletes have a tendency to report higher training intensities than coaches during sessions designed to be easy. Furthermore, lower training intensities were reported during sessions designed to be difficult (Wallace et al., 2009).
Wellness questionnaires
The Hooper index (HI) emerged as a reliable method for the monitoring athletes’ wellness by collecting further information about player fatigue, stress, muscle soreness and sleep perception (Hooper & Mackinnon, 1995). As a subjective measure, the HI is relatively simple to apply, cheap and non-invasive. Additionally, it exhibits superior sensitivity and greater consistency than other objective measures, such as heart rate or saliva measures, and could reveal relevant data related to acute and chronic TL (Saw, Main & Gastin, 2016).
The HI was recently utilised to monitor player wellness during a 4-day FIFA international futsal tournament (Charlot, Zongo, Leicht, Hue & Galy, 2016) in addition to a 2-month study on cycling performance (Chamari et al., 2016).
In soccer, HI has recently been shown to be a viable tool for managing training load in soccer players (Clemente et al., 2017; Fessi et al., 2016; Haddad et al., 2013; Rabbani and Buchheit, 2016; Thorpe et al., 2015).
One investigation, however, found no association between the HI and RPE (Haddad et al., 2013). Clemente et al. (2017) studied associations between s-RPE and the HI. Their results indicate that significant and negative small-to-moderate correlations exist between s-RPE and the HI in
the weeks with two matches, but not in the weeks with only one match. They also found that HI and s-RPE differ significantly based on position.
Fessi et al. (2016) analysed the HI scores of professional soccer players during the pre-season and the in-season and report higher values during the pre-season (p < 0.01). For instance, Rabbani and Buchheit (2016) applied a different approach to young soccer players by studying the influence of ground travel on HI scores. They have found significant and positive correlations between actual HI scores and traveling distance to away locations (r range: 0.70 to 0.87). They also noticed that ground-travel-induced impairment of wellness is associated with distance to away locations. Lastly, Thorpe et al. (2015) analysed wellness scores using the HI and found that perceived ratings of fatigue are sensitive to daily fluctuations in high-speed running distance in elite soccer players. However, this study only examined 17 days of the entire in-season, and therefore the relationship between the use of the HI and s-RPE is limited. Further research is thus needed to validate the aforementioned findings and regarding a complete season. In addition, sleep loss or deprivation can have significant effects on performance, motivation, perception of effort and cognition, and numerous other biological functions (Halson, 2014). Therefore, monitoring sleep quality and quantity can be useful for early detection and intervention before significant performance and health decrements are observed. Nevertheless, HI is a cost-effective method that can be used to easily assess sleep. Thus, the use of simple diaries indicating players’ hours of sleep and perceived sleep quality can be useful and provide further insight.
Creatine Kinase
Another way to monitor internal TL is through biochemical indicators, such as blood, salivary and urinary parameters. The creatine kinase (CK) activity is often a popular measure due to the simplicity of the sample collection and analysis. However, variability of this measure is very high and a poor temporal relationship with muscle recovery exists. Nevertheless, this statement is not consensual because some studies (Budgett, Koutedakis, Walker, Parry-Billings, & Newsholme, 1989; Kirwan et al.,1988) state that high CK levels are related to high-intensity exercise and could be considered a good marker of overtraining.
Meyer and Meister (2011) has shown that CK values can increase throughout the season. This research studied a large sample (n = 400) of top elite soccer players and reported significant differences between the first day of data collection in July (~183 U/L) and the data collected in February/March (~331 U/L). These results are quite similar to the elite professionals observed in a posterior study (Silva et al., 2014).
In addition, Heisterberg et al. (2013) have shown that CK increases during the pre-season due to higher values of TL. The data shows an increase of ~300 U/L to ~500 U/L during the pre-season period, which returned to ~300 U/L throughout the in-pre-season (Heisterberg et al., 2013). Furthermore, Nedelec et al. (2012) reported that 24-120 h are needed to normalise metabolic disturbances. Since significant correlations exist between CK and running speeds (> 4 m/s) and accelerations and decelerations over a certain magnitude (moderate to high), it has been suggested that a certain intensity of movement at those speeds is required for the movement to be strongly associated with CK levels (Young, Hepner & Robbins, 2012).
It is relevant to note that high CK values can occur in the absence of overtraining syndrome (Flynn et al., 1994) and within the normal range of athletes (Budgett et al., 1989). Thus, it is relevant to state that CK values are highly dependent on the player assessed and are highly affected by the activity performed during the previous days. Moreover, in soccer, it is possible that a player’s position affects the results. Therefore, individual TL must be considered and analysed in addition to CK values for a better interpretation of the results (Heistberg et al., 2013). Also, CK is an important marker to control daily training sessions. For reference, CK can range from 82–1083 U/L in soccer players, while the upper value can reach 1492 U/L (Mougios, 2007).
The use of biochemical, hormonal and/or immunological measures as indicators of internal load has not yet been consistently applied within the research in this area. In addition, these measures are costly, time consuming and difficult to apply to soccer training sessions (Twist & Highton, 2013).
Chapter 3. Experimental Studies
Study 1
In-season internal and external training load quantification of an
elite European soccer team
Abstract
Elite soccer teams that participate in European competitions need to have players in the best physical and psychological status possible to play matches. As a consequence of congestive schedule, controlling the training load (TL) and thus the level of effort and fatigue of players to reach higher performances during the matches is therefore critical. Therefore, the aim of the current study was to provide the first report of seasonal internal and external training load that included Hooper Index (HI) scores in elite soccer players during an in-season period. Nineteen elite soccer players were sampled, using global position system to collect total distance, high-speed distance (HSD) and average speed (AvS). It was also collected session rating of perceived exertion (s-RPE) and HI scores during the daily training sessions throughout the 2015-2016 in-season period. Data were analysed across ten mesocycles (M: 1 to 10) and collected according to the number of days prior to a one-match week. Total daily distance covered was higher at the start (M1 and M3) compared to the final mesocycle (M10) of the season. M1 (5589 meters (m)) reached a greater distance than M5 (4473 m) (effect size (ES) = 9.33 [12.70, 5.95]) and M10 (4545 m) (ES = 9.84 [13.39, 6.29]). M3 (5691 m) reached a greater distance than M5 (ES = 9.07 [12.36, 5.78]), M7 (ES = 6.13 [8.48, 3.79]) and M10 (ES = 9.37 [12.76, 5.98]). High-speed running distance was greater in M1 (227 m), than M5 (92 m) (ES = 27.95 [37.68, 18.22]) and M10 (138 m) (ES = 8.46 [11.55, 5.37]). Interestingly, the s-RPE response was higher in M1 (331 arbitrary units (au)) in comparison to the last mesocycle (M10, 239 au). HI showed minor variations across mesocycles and in days prior to the match. Every day prior to a match, all internal and external TL variables expressed significant lower values to other days prior to a match (p < 0.01). In general, there were no differences between player positions. Conclusions: Our results reveal that despite the existence of some significant differences between mesocycles, there were minor changes across the in-season period for the internal and external TL variables used. Furthermore, it was observed that match day minus (MD-1) presented a reduction of external TL (regardless of mesocycle) while internal TL variables did not have the same record during in-season match-day-minus.