INSTITUTO DE CIÊNCIAS BIOLÓGICAS
DEPARTAMENTO DE BOTÂNICA
PROGRAMA DE PÓS-GRADUAÇÃO EM BOTÂNICA
DNA Barcode dos Gêneros Schlotheimia Brid. e
Macromitrium Brid. para o Brasil
DAIANE VALENTE VALENTE
INSTITUTO DE CIÊNCIAS BIOLÓGICAS
DEPARTAMENTO DE BOTÂNICA
PROGRAMA DE PÓS-GRADUAÇÃO EM BOTÂNICA
DNA Barcode dos Gêneros Schlotheimia Brid. e
Macromitrium Brid. para o Brasil
DAIANE VALENTE VALENTE
Tese de doutorado apresentada ao Programa de Pós-graduação em Botânica como requisito para obtenção do título de Doutor em Botânica, junto ao Departamento de Botânica do Instituto de Ciências Biológicas da Universidade de Brasília.
ORIENTADOR: DR. PAULO EDUARDO A. S. CÂMARA
DNA Barcode dos Gêneros Schlotheimia Brid. e Macromitrium
Brid. para o Brasil
BANCA EXAMINADORA
Prof. Dr. Paulo Eduardo Aguiar Saraiva Câmara Presidente da banca – Universidade de Brasília
Prof. Dr. Diego Knop Henriques Membro da banca – Universidade de Brasília
Prof. Dr. Marcelo Fragomeni Simon
Membro da banca – Embrapa Recursos Genéticos e Biotecnologia – Cenargen
Prof. Dr. Luciano Coêlho Milhomens Fonsêca
Membro da banca – Universidade Católica de Brasília – UCB
Prof. Dra. Cássia Beatriz Rodrigues Munhoz Membro da banca – Universidade de Brasília
AGRADECIMENTOS
Agradeço ao meu Pai Guilherme Valente, por todo amor, carinho e dedicação de uma vida.
Agradeço ao meu querido orientador Prof. Dr. Paulo Câmara, por todo apoio, amizade, incentivo e orientação no decorrer de todo o processo. Aprendi muito com você, não só o aprendizado científico, mas sobre o tipo de profissional que almejo ser. Obrigada por todos os conselhos, tenho muito orgulho de você!
Agradeço ao Prof. Dr. Michael Stech pelo acolhimento na Holanda, aprendizado e auxílio durante o doutorado sanduíche.
Agradeço ao Dr. Denilson Fernandes Peralta pela imensa ajuda no decorrer desse trabalho, não medindo esforços, sempre disposto a ajudar.
Agradeço a Prof. Cassia Munhoz por todo esforço, dedicação, eficiência, e incentivo. Foi uma pessoa que me instigou a fazer o melhor no decorrer de todo processo.
Agradeço às minhas colegas Julia Mundim pelo acolhimento e imensa ajuda durante o início do doutorado e a Tamara Dantas pela ajuda, parceria, disponibilidade, sempre disposta a compartilhar seus conhecimentos.
Agradeço ao Prof. Dr. Diego Knop por sempre estar disponível para ajudar, sempre muito solícito.
Agradeço aos meus colegas de Laboratório Abel Soares, Allan Laid, Amanda Leal, Amanda Marinho, Carla Gomes, Eduardo Amorim, Julia Mundim, Tamara Dantas, Diego Knop e Poliana Teixeira, pela parceria, companheirismo, risadas e momentos de descontração.
Agradeço aos meus irmãos de coração Amanda Leal e Eliel Amaral por todo cuidado, amizade, amor e carinho durante o tempo em que compartilhamos nossas vidas.
Agradeço ao Conselho Nacional de Desenvolvimento Científico e Tecnológico – CNPq, pelo fomento da Bolsa de Doutorado Sanduíche no exterior (SWE).
Agradeço a Coordenação de Aperfeiçoamento de Pessoal de Nível Superior CAPES pela bolsa durante o período de realização do doutorado.
Agradeço aos Herbários BM, E, G, GOET, ICN, L, MBM, NY, PACA, PC, R, RB, SP e seus respectivos curadores pelo empréstimo e disponibilidade do material para observação.
Agradeço a Dra. Silvia Pressel e Joanna Wilbraham do Museu de História Natural de Londres pela doação das sequências da espécie typus do gênero Macromitrium.
Agradeço aos membros das bancas de qualificação e defesa final por suas contribuições para a melhoria desse trabalho.
A todos que contribuíram de alguma forma para a realização desse trabalho, muito obrigada!
SUMÁRIO LISTA DE FIGURAS ... 7 LISTA DE TABELAS/APÊNDICES ... 10 RESUMO ... 13 ABSTRACT ... 14 1 INTRODUÇÃO ... 15 1.1 Referências ... 17 2 OBJETIVOS ... 20 2.1 Objetivo Geral ... 20 2.2 Objetivos específicos ... 20
3 CAPÍTULO I - DNA barcoding of tropical mosses: a case study of the Brazilian species of Schlotheimia Brid. (Bryophyta, Orthotrichaceae) ... 21
3.1 Abstract ... 22
3.2 Introduction ... 23
3.3 Materials and Methods ... 25
3.4 Results ... 27
3.5 Discussion ... 29
3.6 Acknowledgments ... 33
3.7 References ... 33
4 CAPÍTULO II – Taxonomic Notes and new synonyms on Brazilian Macromitrium Brid. (Bryophyta, Orthotrichaceae) ... 51
4.1 Abstract ... 52
4.2 Introduction ... 53
4.3 Materials and Methods ... 54
4.4 Results ... 54
4.5 Good species for Brazil ... 55
4.6 Species of Macromitrium transferred to another genera ... 62
4.7 Types not seen... 65
4.8 Excluded names from Brazilian flora ... 67
4.9 Acknowledgments ... 69
4.10 References ... 69
5 CAPÍTULO III – Macromitrium Brid. (Bryophyta, Orthotrichaceae) in Brazil: A Molecular Approach ... 74
5.1 Abstract ... 75
5.2 Introduction ... 76
5.3 Materials and Methods ... 77
5.4 Results ... 80 5.5 Discussion ... 82 5.6 Taxonomic Treatment ... 87 5.7 Acknowledgments ... 90 5.8 References ... 90 6 CONSIDERAÇÕES FINAIS ... 115
LISTA DE FIGURAS Capítulo I
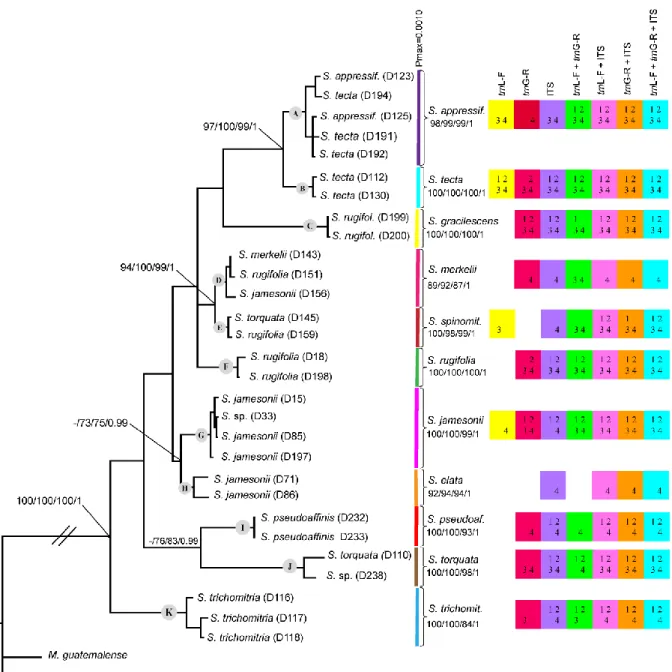
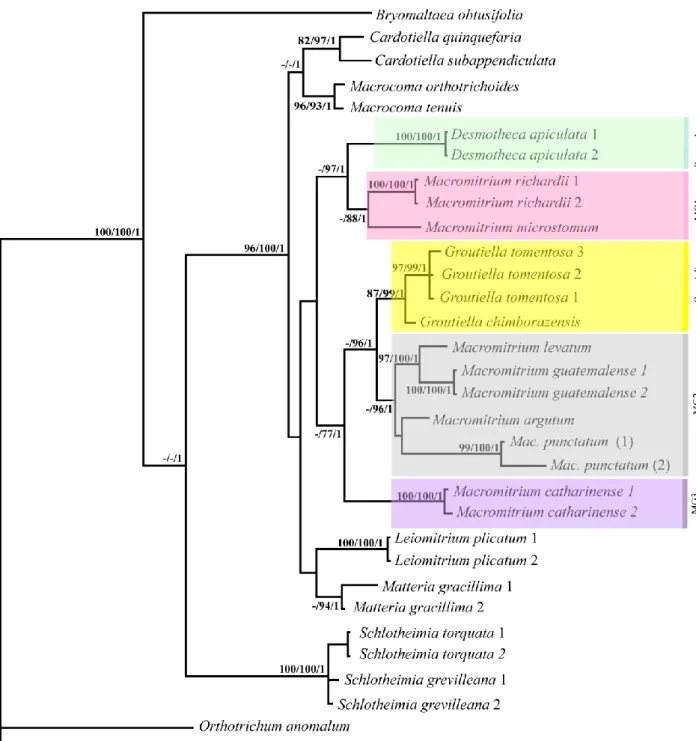
Figura 1 − Phylogram obtained from Bayesian inference (BI) based on combined trnL-F +
trnG-R + ITS sequences of 29 specimens of Schlotheimia, including indels coded by simple
indel coding. Bootstrap support (BS) values for neighbour-joining (NJ), maximum parsimony (MP), and maximum likelihood (ML) as well as posterior probabilities (PP) for Bayesian inference are shown at the branches. Results of analyses of single markers and combinations are summarized by coloured squares. The absence of a coloured square means no support or clade not resolved for that marker. Numbers inside them represent BS ≥ 95% for 1 - (NJ), 2 - (MP) and 3 - (ML), and PP ≥ 0.95 for 4 - (BI). ABGD species clusters (coloured lines) and Pmax-values are shown next to the species names. // indicates a clade length of 50% of its original size ... 40
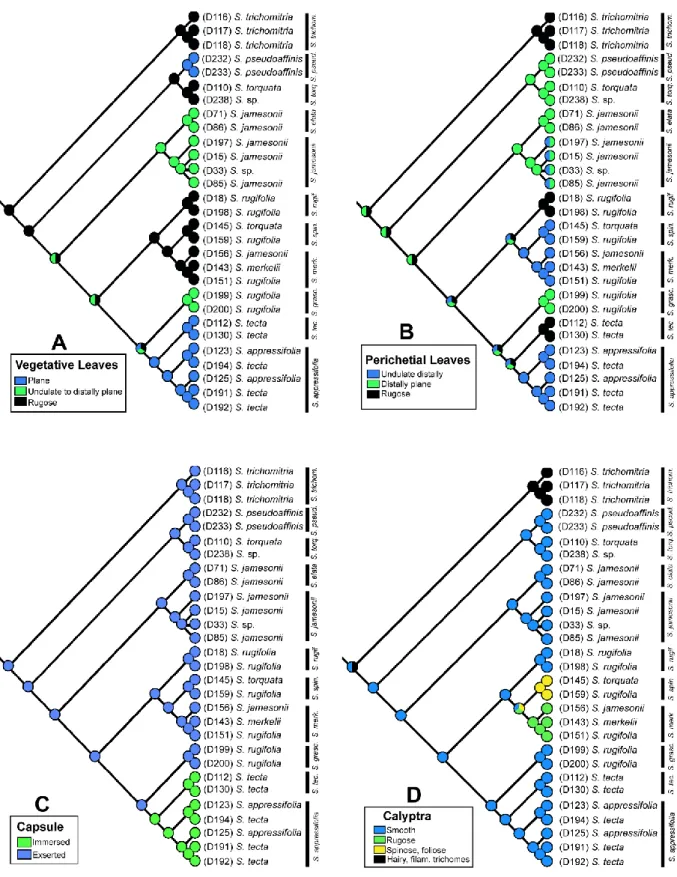
Figura 2 − Ancestral character state reconstruction of four morphological characters based on combined trnL-F + trnG-R + ITS sequences of 29 specimens of Schlotheimia. A) vegetative leaves lamina; B) perichaetial leaves lamina; C) capsule exposure; D) calyptra surface ... 41
Capítulo III
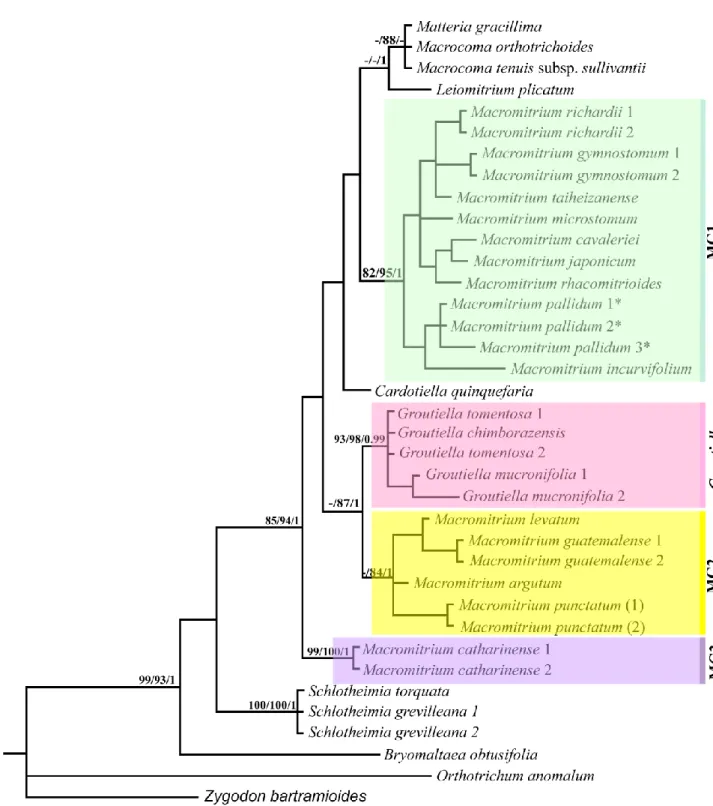
Figura 1 − Phylogram obtained from Bayesian inference (BI) based on combined trnL-F +
rps4 + nad5 + 26S sequences of 32 specimens of Orthotrichaceae family, including indels coded
by simple indel coding. Bootstrap support for Maximum Parsimony (MP), Maximum Likelihood (ML) and Bayesian posterior probabilities are shown respectively in each clade and node. MG1: Macromitrium group 1; MG2: Macromitrium group 2; MG3: Macromitrium group 3 ... 97
Figura 2 − Phylogram obtained from Bayesian inference (BI) based on trnL-F marker sequences of 38 specimens of Orthotrichaceae family, including indels coded by simple indel coding. Bootstrap support for Maximum Parsimony (MP), Maximum Likelihood (ML) and Bayesian posterior probabilities are showed in each clade and node. MG1: Macromitrium group 1; MG2: Macromitrium group 2; MG3: Macromitrium group 3. (*) types species .. 98
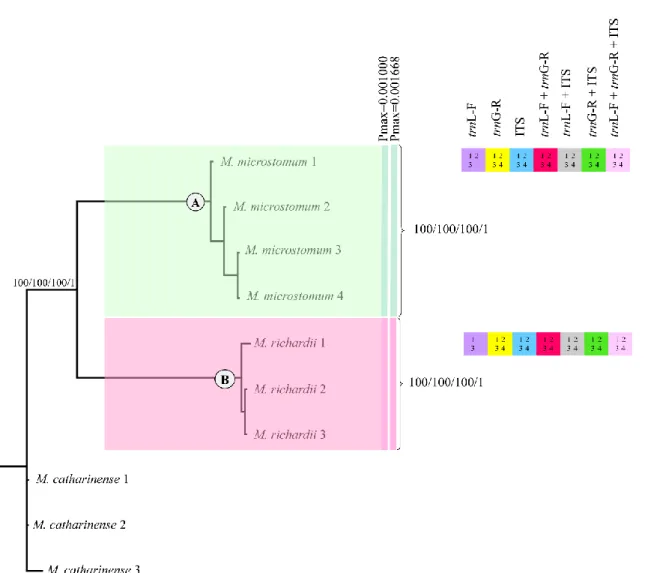
Figura 3 − Phylogram obtained from Bayesian inference (BI) based on combined trnL-F +
by simple indel coding. Bootstrap support for Neighbor-joining (NJ), Maximum Parsimony (MP), Maximum Likelihood (ML) and Bayesian posterior probabilities are showed in each clade and node. Coloured squares, and numbers inside them represent the clades with bootstrap ≥ 70% for 1 - (NJ), 2 - (MP) and 3 - (ML), and Posterior Probability ≥ 0.95 for 4 - (BI). Each color in square represents an analysis of a single marker or combinations of them. The absence of color means no support or clades not resolved for that marker. ABGD species clusters with different Pmax-values are shown next to the species names. Each color represents one species ... 99 Figura 4 − Phylogram obtained from Bayesian inference (BI) based on combined trnL-F +
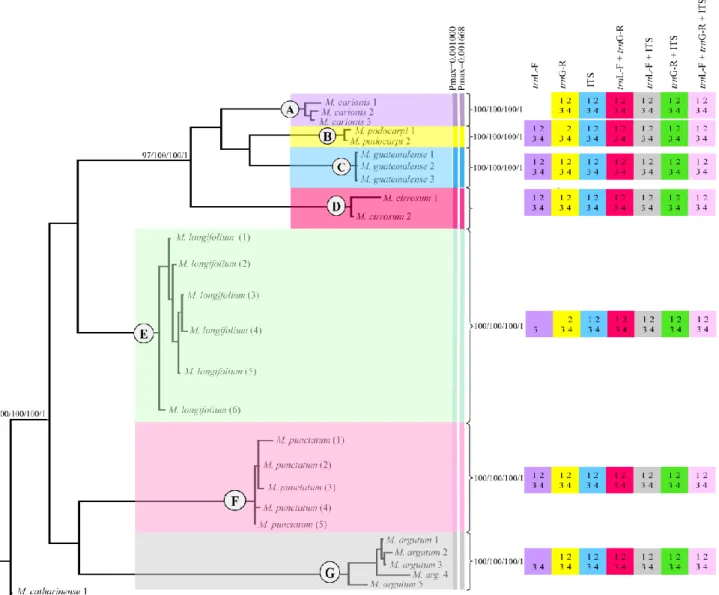
trnG-R + ITS sequences of 28 specimens Macromitrium (Group 2), including indels coded by
simple indel coding. Bootstrap support for Neighbor-joining (NJ), Maximum Parsimony (MP), Maximum Likelihood (ML) and Bayesian posterior probabilities are showed in each clade and node. Coloured squares, and numbers inside them represent the clades with bootstrap ≥ 70% for 1 - (NJ), 2 - (MP) and 3 - (ML), and Posterior Probability ≥ 0.95 for 4 - (BI). Each color in square represents an analysis of a single marker or combinations of them. The absence of color means no support or clades not resolved for that marker. ABGD species clusters with different Pmax-values are shown next to the species names. Each color represents one species ... 100
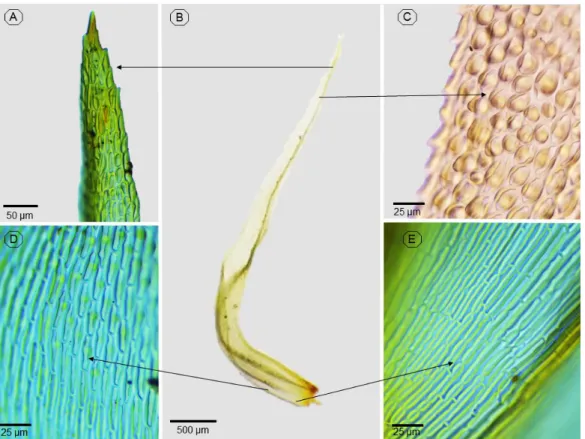
Figura 5 – Macromitrium catharinense: (A) margin and apex format; (B) leave; (C)
pluripapilose cells; (D) pluripapilose base cells; (E) base cells. ... 101
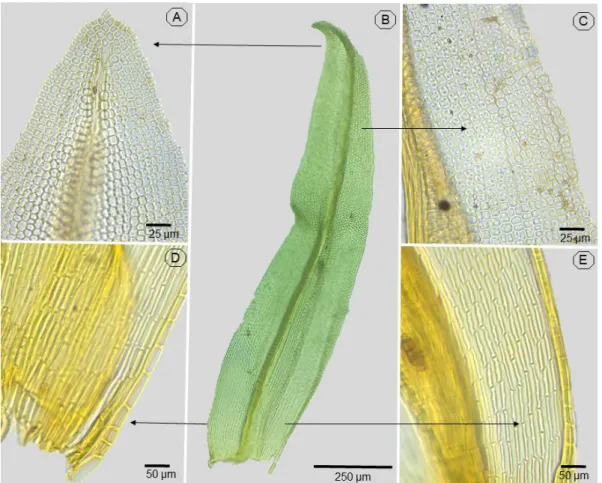
Figura 6 – Macromitrium microstomum; (A) margin and apex format; (B) leave; (C) pluripapilose apical cells; (D) base margin; (E) base cells. ... 101
Figura 7 – Macromitrium richardii; (A) margin and apex format; (B) leave; (C) apex cells; (D) base margin; (E) base cells ... 102
Figura 8 – Macromitrium carionis; (A) margin and apex format; (B) leave; (C) apex cells; (D) base margin; (E) base cells. ... 102
Figura 9 – Macromitrium guatemalense; (A) margin and apex format; (B) leave; (C) apex cells; (D) base margin; (E) base cells. ... 103
Figura 10 – Macromitrium podocarpi; (A) margin and apex format; (B) leave; (C) apex cells; (D) base margin; (E) base cells. ... 103
Figura 11 – Macromitrium cirrosum; (A) apex format; (B) apex margin; (C) apex cells; (D) upper leave; (E) base margin; (F) tubercles; (G) base cells. ... 104
Figura 12 – Macromitrium argutum; (A) margin and apex format; (B) leave; (C) apex cells; (D) base margin; (E) base cells. ... 104
Figura 13 – Macromitrium longifolium; (A) margin and apex format; (B) leave; (C) apex cells; (D) base margin; (E) base cells ... 105
Figura 14 – Macromitrium punctatum; (A) margin and apex format; (B) leave; (C) apex cells; (D) base margin; (E) base cells. ... 105
LISTA DE TABELAS/APÊNDICES Capítulo I
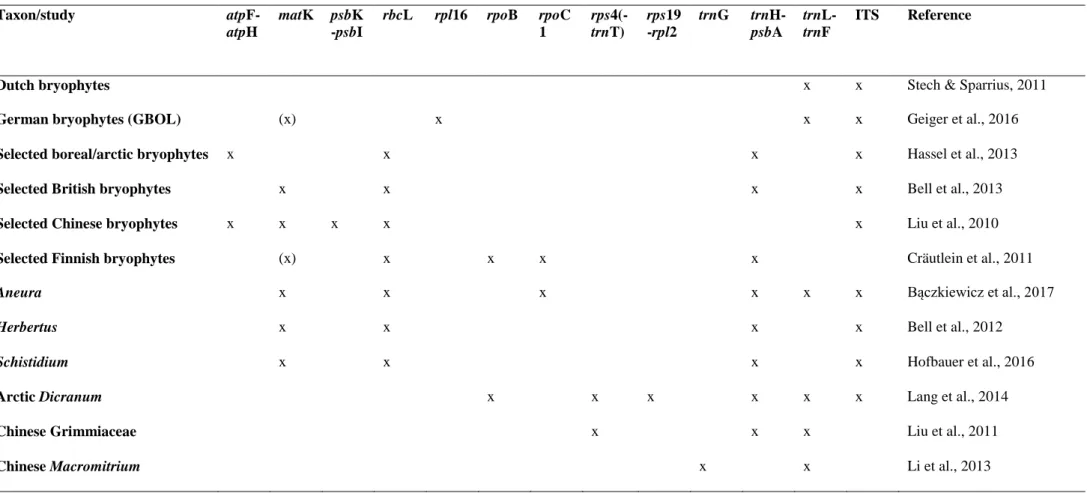
Tabela 1 − Molecular markers tested or employed in selected DNA barcoding studies of bryophytes. The use of parts of the respective markers (e.g. only trnL intron or ITS2) in some of the listed studies is not indicated separately... 42
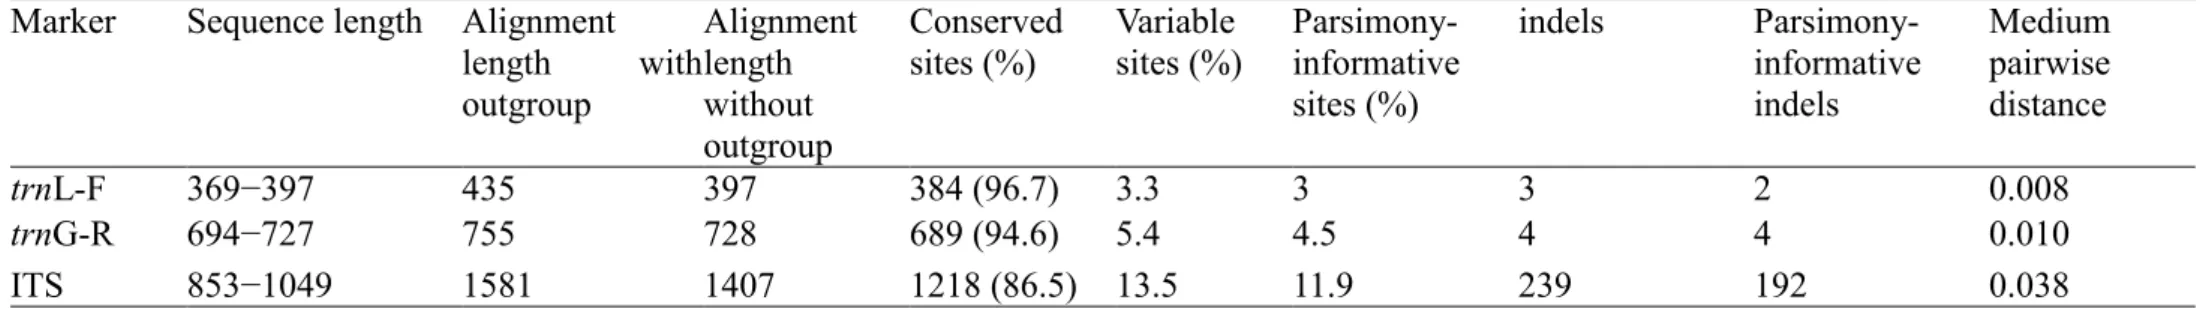
Tabela 2 − Characterization of the dataset of three molecular markers used for DNA barcoding of Brazilian Schlotheimia, and two samples of Macromitrium as outgroup representatives. Numbers of conserved sites, variable sites, parsimony informative sites, indels, and medium pairwise distances were calculated from the ingroup sequences only... 43
Tabela 3 – Intra- versus interspecific pairwise Kimura 2-parameter (K2P) distances of individual markers (trnL-F, trnG-R and ITS) and combinations in the analysed Schlotheimia dataset. The last row indicates the overlap between the maximum intraspecific and minimum interspecific distances ... 43
Apêndice S1 – Voucher information and GenBank accession numbers for the analysed
Schlotheimia specimens. Samples marked by an asterisk could not be sequenced for all markers
and were used in the analyses of individual markers and possible combinations, but excluded from the combined analysis (trnL-F + trnG-R + ITS) presented in Fig. 1 ... 44
Apêndice S2 – Matrix used for morphological character reconstruction. 1) Plant size: (1) robust, (2) medium-sized; 2) Creeping stem covering: (1) short tomentose, (2) tomentose; 3) Creeping stem format: (1) similar branches, (2) squarrose, (3) triangular; 4) Branch length: (1) long, (2) short; 5) Vegetative leaves (VL) shape: (1) lanceolate, (2) ovate, (3) oblong-lanceolate; 6) VL lamina: (1) plane, (2) undulate to distally plane, (3) rugose; 7) VL apex: (1) acute, (2) aristate, (3) mucronate; 8) VL margin: (1) dentate, (2) entire; 9) VL costa: (1) subpercurrent, (2) long excurrent, (3) short excurrent; 10) Perichetial leaves (PL) lamina: (1) distally undulate, (2) distally plane, (3) rugose; 11) PL apex: (1) aristate, (2) mucronate, (3) acuminate; 12) PL costa: (1) long excurrent, (2) short excurrent; 13) Seta length: (1) short, (2) long; 14) Capsule exposure: (1) immersed, (2) exserted; 15) Capsule shape: (1) ovoid, (2) ovoid-cylindrical; 16) Calyptra shape: (1) campanulate, (2) mitrate-campanulate; 17) Calyptra
surface: (1) smooth, (2) rugose, (3) spinose with foliose trichomes, (4) pilose with filamentose trichomes ... 46
Apêndice S3 – Support values for the clades of Brazilian Schlotheimia species in different analyses of single markers and combinations, with indels included: Bootstrap support (BS) values (%) for neighbour joining (NJ), maximum parsimony (MP), and maximum likelihood (ML) and posterior probabilities (PP) for Bayesian inference (BI). Values below 70% (BS) and 0.95 (PP) are in red. Respective values for the combined analysis of all three markers are shown in Fig. 1 ... 48
Apêndice S4 – Support values for the clades of Brazilian Schlotheimia species in different analyses of single markers and combinations, without indels: Bootstrap support (BS) values (%) for neighbour joining (NJ), maximum parsimony (MP), and maximum likelihood (ML) and posterior probabilities (PP) for Bayesian inference (BI). Values below 70% (BS) and 0.95 (PP) are in red ... 49
Apêndice S5 – Number of character state changes of 17 morphological characters in
Schlotheimia as inferred from ancestral state reconstruction ... 50
Capítulo III
Tabela 1 − Description of Primers used for amplification in phylogenetic and DNA Barcoding analyses ... 106
Tabela 2 – Alignment statistics, best-fitting models of evolution, and tree scores for the phylogenetic datasets 1 and 2 ... 106
Tabela 3 – Macromitrium (Group 1). Characterization of each marker. The data for conserved sites, variable sites, parsimony informative sites, parsimony informative indels and medium pairwise distance were performed of matrix without outgroup ... 107
Tabela 4 – Macromitrium (Group 2). Characterization of each marker. The data for conserved sites, variable sites, parsimony informative sites, parsimony informative indels and medium pairwise distance were performed of matrix without outgroup ... 107
Tabela 5 – Macromitrium (Group 1). Bootstrap values (%) for analysis Neighbor joining (NJ) using 2-parameter (K2P) model, Maximum Parsimony (MP), and Maximum Likelihood (ML). For Bayesian Inference (BI) are showed Posterior probability. Every analysis were performed for individual and combined markers. For the combined analysis of all three markers the support is showed in Fig. 4. To NJ, MP and ML were considered bootstrap ≥ 70% and ≥ 0.95 to BI. MP, ML and BI without IndelCoder. ... 108
Tabela 6 – Macromitrium (Group 2). Bootstrap values (%) for analysis Neighbor joining (NJ) using 2-parameter (K2P) model, Maximum Parsimony (MP), and Maximum Likelihood (ML). For Bayesian Inference (BI) are showed Posterior probability. Every analysis were performed for individual and combined markers. For the combined analysis of all three markers the support is showed in Fig. 3. To NJ, MP and ML were considered bootstrap ≥ 70% and ≥ 0.95 to BI. P, ML and BI with IndelCoder. ... 108
Tabela 7 – Intra- versus interspecific pairwise distances of individual markers (trnL-F, trnG-R and ITS) and combined markers (trnL-F + trnG-R, trnL-F + ITS, trnG-R + ITS and trnL-F +
trnG-R + ITS) in 2 species Macromitrium (Group 1)... 109
Tabela 8 – Intra- versus interspecific pairwise distances of individual markers (trnL-F, trnG-R and ITS) and combined markers (trnL-F + trnG-R, trnL-F + ITS, trnG-R + ITS and trnL-F +
trnG-R + ITS) in 7 species Macromitrium (Group 2)... 109
Tabela 9 –Morphological caracteres used for discriminate the species of Macromitrium and
Pseudomacromitrium. ... 110
Apêndice S1 – Voucher information and GenBank accession numbers for the analysed Orthotrichaceae specimens in phylogeny ... 111
Apêndice S2 – Voucher information and GenBank accession numbers for the analysed
DNA Barcode dos Gêneros Schlotheimia Brid. e Macromitrium Brid. para o Brasil Resumo
DNA Barcoding é um método molecular utilizado para facilitar a identificação de espécies, que consiste em obter sequências curtas de DNA a partir de uma região padronizada do genoma, que atenda aos seguintes critérios: variabilidade genética suficiente a nível das espécies, sequência curta para facilitar a extração e amplificação de DNA e presença de regiões conservadas para o desenvolvimento de primers. Para elaborar uma estratégia de DNA Barcoding para musgos utilizamos dois gêneros da família Orthotrichaceae: (i) Schlotheimia, devido a identificação morfológica das espécies somente ser possível se a planta estiver fértil e (ii) Macromitrium, devido a sua complexidade morfológica, e a falta de conhecimento sobre a real diversidade brasileira desse grupo. Este trabalho teve como objetivo principal elaborar uma estratégia de DNA Barcoding ou ferramenta molecular para identificação das espécies dos gêneros Schlotheimia e Macromitrium, testando 3 marcadores moleculares (trnL-F, trnG-R e ITS) visando à solução de possíveis problemas taxonômicos, contribuindo com dados moleculares para o desenvolvimento futuro de trabalhos em larga escala de DNA Barcoding. Como objetivo secundário, verificar os 64 nomes de Macromitrium citados para o Brasil (20 nomes aceitos e 44 nomes excluídos da flora do Brasil) buscando esclarecer sua validade e identificação correta, contribuindo para o conhecimento da diversidade de espécies de
Macromitrium ocorrentes no Brasil. Para DNA Barcoding foram utilizadas 87 sequências para Schlotheimia e 108 para Macromitrium. Para morfologia e filogenia de Macromitrium foram
analisados o material typus para 64 espécies e utilizadas 111 sequências de 4 marcadores moleculares (trnL-F, rps4, nad5 e 26S), respectivamente. Foram realizadas análises de máxima parcimônia, máxima verossimilhança, inferência bayesiana, neighbour-joining, Automatic Barcode Gap Discovery (ABGD) e variação intra e interespecífica. Nossos dados evidenciaram que o gênero Schlotheimia é monofilético. Já o gênero Macromitrium não é um grupo monofilético ocorrendo a formação de três grupos diferentes: MG1 (gênero Macromitrium verdadeiro), MG2 (novo gênero Pseudomacromitrium) e MG3 (novo gênero
Aureomacromitrium). O melhor candidato a marcador de DNA Barcoding foi trnG-R devido à
sua fácil amplificação, boa qualidade das sequências e capacidade de discriminação das espécies de ambos os gêneros. O marcador nuclear ITS foi fácil de amplificar e apresentou maior variação em relação aos marcadores plastidiais, porém foi difícil de alinhar e apresentou sequências de baixa qualidade devido a trechos de polinucleotídeos ou contaminação por fungos. TrnL-F teve a pior performance entre os marcadores testados, apresentando baixo
potencial de discriminação para todos os grupos. Em contrapartida foi um marcador fácil de amplificar, com sequências de boa qualidade. Nossos dados contribuíram para re-circunscrição de Macromitrium, descrição de dois novos gêneros e conhecimento da real diversidade brasileira, onde das 64 espécies listadas para o Brasil, 22% são boas espécies, 53% são sinônimos de outras espécies, 16% são excluídos da flora brasileira e 9% não foram possíveis verificar. Com isso, ocorreu uma redução do número de espécies de 20 para 14, sendo que três dessas são conhecidas somente pelo typus, podendo ter sido extintas. Com relação á
Schlotheimia ocorreu redução de 13 para 11 espécies e os dados serviram de base para a revisão
taxonômica do gênero, além de ser uma importante ferramenta para a identificação das espécies. Palavras-chave: marcadores moleculares, identificação, taxonomia, Orthotrichaceae, musgos.
DNA Barcode of the Genera Schlotheimia Brid. and Macromitrium Brid. to Brazil Abstract
DNA Barcoding is a molecular method used to facilitate species identification, which consists of obtaining short DNA sequences from a standardized region of the genome that meets the following criteria: sufficient genetic variability at species level, short sequence to facilitate DNA extraction and amplification and presence of conserved regions for primer development. To elaborate a DNA barcoding strategy for mosses use two genera of Orthotrichaceae family: (i) Schlotheimia due to morphological identification of species only be possible if the plant is fertile and (ii) Macromitrium due to the complex morphology and lack of knowledge of the Brazilian real diversity. The main objective of this work was to elaborate a Dna Barcoding strategy or molecular tool for the identification of Schlotheimia and Macromitrium species, testing three molecular markers (trnL-F, trnG-R and ITS) aiming at solving possible taxonomic problems, contributing to molecular data for the future development work in large-scale DNA Barcoding. As a secondary objective, to verify the 64 names of Brazilian Macromitrium (20 accepted names and 44 names excluded from the Brazilian flora) in order to clarify their validity and correct identification, contributing to the knowledge of the diversity of Macromitrium species occurring in Brazil. For DNA barcoding, a sampling of 87 sequences for Schlotheimia and 108 for Macromitrium was used. For morphology and phylogeny of Macromitrium the typus material was analyzed for 64 species and 111 sequences of 4 molecular markers (trnL-F,
rps4, nad5 and 26S) were used. Maximum parsimony, maximum likelihood, Bayesian
inference, neighbor-joining, Automatic Barcode Gap Discovery (ABGD) and intra and interspecific variation analyzes were performed. Our data showed that Schlotheimia is monophyletic and Macromitrium not monophyletic, occurred with the formation of three different groups: MG1 (true Macromitrium genus), MG2 (new genus, Pseudomacromitrium) and MG3 (Aureomacromitrium, new monospecific genus). The best candidate for DNA Barcoding marker was trnG-R due to its easy amplification, good sequence quality and species discrimination ability of both genera. The ITS nuclear marker was easy to amplify and showed greater variation than plastid markers, but was difficult to align and presented poor quality sequences due to polynucleotide stretches or fungal contamination. TrnL-F had the worst performance among the markers tested, presenting low discrimination potential for all groups. In contrast, it was an easy-to-amplify marker with good quality sequences. Our data contributed to Macromitrium re-circumscription, description of two new genera and knowledge of the real Brazilian diversity, where of the 64 species listed for Brazil, 22% are good species 53% are synonymous with other species; 16% are excluded from the Brazilian flora, and 9% could not be verified. Thus, there was a reduction in the number of species from 20 to 14, and three of these are known only by typus, and may have been extinct. Regarding to Schlotheimia there was a reduction from 13 to 11 species and the data served as the basis for the taxonomic revision of the genus, besides being an important tool for species identification.
1 INTRODUÇÃO
Briófitas são plantas avasculares, cujos estudos moleculares demonstram estarem representadas em três divisões: Marchantiophyta (hepáticas), Anthocerotophyta (Antóceros) e Bryophyta (musgos) (Stech & Frey 2008; Goffinet & Shaw 2009). Representam o segundo maior grupo de plantas terrestres, apresentando entre 15.000-18.000 espécies no mundo (Gradstein et al. 2001; Shaw & Goffinet 2000). No Brasil foram catalogadas 1.570 espécies, das quais 331 são endêmicas. Desse total de espécies conhecidas no país, 882 são de musgos (Flora do brasil online, http://floradobrasil.jbrj.gov.br/).
Apesar do levantamento das espécies brasileiras (Costa & Luizi-Ponzo 2010; Costa et
al. 2011; Costa & Peralta 2015), a identificação correta desses grupos é uma problemática
constante e entrave para muitos estudos, pois as briófitas são muitas vezes consideradas difíceis de identificar em nível de espécie, devido ao seu tamanho pequeno, caracteres morfológicos pouco conspícuos e considerável plasticidade morfológica em resposta a fatores ambientais, tornando necessária nova abordagem para o reconhecimento de táxons (Bergamini & Peintinger 2002; Hebert et al. 2003; Buryová & Shaw 2005; Hassel et al. 2005).
Sistemas de identificação molecular, através da análise de um pequeno segmento do genoma, representam uma abordagem extremamente promissora para o diagnóstico da diversidade biológica (Herbert et al. 2003). Esse método molecular para identificação de espécies conhecido como “DNA Barcoding” consiste em sequências curtas de DNA a partir de uma região padronizada do genoma que atenda aos seguintes critérios: variabilidade genética suficiente a nível das espécies, sequência curta para facilitar a extração e amplificação de DNA e presença de regiões conservadas para o desenvolvimento de primers (Kress et al. 2005). Esta técnica tem sido considerada uma ferramenta viável para recorrentes problemas de identificação com animais, porém para plantas a ainda precisa ser aprimorada (Hebert et al. 2003).
No Brasil, foram desenvolvidos ensaios de DNA barcoding somente para identificação de plantas com flores (Gonzalez et al. 2013; Vivas et al. 2014; Palhares et al. 2015; Bolson et
al. 2015; Silva et al. 2015; Rivera-Jiménez et al. 2017). Estudos com briófitas, no entanto, estão
apenas começando (Dantas et al. 2018), sendo esse trabalho o primeiro de DNA Barcoding de briófitas para o Brasil.
Considerando o desenvolvimento de novas ferramentas de fácil identificação para briófitas, foi elaborado um projeto pioneiro de Barcoding para briófitas do Brasil em parceria com o Naturalis Biodiversity Center da Holanda, intitulado “DNA Barcoding of Brazilian bryophytes – A case study to improve the identification of tropical bryophyte species”,
aprovado através do edital 71/2013 do MEC/MCTI/CAPES/CNPq/FAPs. O presente trabalho faz parte desse projeto maior, onde estão sendo investigados os gêneros Schlotheimia Brid. e
Macromitrium (Brid.), ambos pertencentes a família Orthotrichaceae.
Schlotheimia é um gênero com distribuição pantropical com aproximadamente 120
espécies (Frey & Stech 2009). No Neotrópico são registradas 56 espécies, onde estima-se que provavelmente menos de 30 sejam realmente confirmadas (Gradstein et al. 2001). De acordo com a Flora do Brasil (2020) são reconhecidas 12 espécies de Schlotheimia das quais cinco são endêmicas (Costa & Peralta 2015). A escolha desse gênero foi devido a identificação morfológica de algumas espécies de Schlotheimia requererem o estudo do esporófito (Peralta
et al. 2020 dados não publicados) condição essa, nem sempre encontrada nas plantas em campo
ou herbários.
Macromitrium é um gênero com aproximadamente 350 espécies, amplamente
distribuídas em regiões tropicais e subtropicais (Vitt & Ramsay 1985a,b). No Neotrópico, são estimadas cerca de 125 espécies para o gênero (Gradstein et al. 2001). Para o Brasil foram citadas 64 espécies, porém destas, 44 foram indicadas como pouco conhecidos por Costa et al. (2011) e não aparecem na lista das espécies do Brasil. Atualmente na Flora do Brasil (2020) são estimadas 20 espécies, das quais cinco são endêmicas. A morfologia desse gênero é bastante complexa, e os caracteres utilizados para identificação de espécies não estão bem estabelecidos. Assim, a verdadeira diversidade de espécies que ocorrem no Brasil ainda é desconhecida.
Este trabalho visa auxiliar na delimitação das espécies e circunscrição do gênero
Macromitrium para o Brasil, e também servir como uma ferramenta promissora para facilitar a
identificação das espécies dos gêneros Schlotheimia e Macromitrium. Dessa forma serão apresentados 3 capítulos:
1) Molecular tools to identify tropical mosses: a case study of the Brazilian species of
Schlotheimia Brid. (Bryophyta, Orthotrichaceae)
O primeiro capítulo foi publicado na revista Systematics and biodiversity (Qualis A2), visando testar o potencial de três marcadores moleculares, sendo uma região nuclear ITS, e duas regiões plastidiais trnL-F e trnG-R, (primeira vez usado em musgos) para resolver as relações filogenéticas e delimitações de espécies dentro de Schlotheimia no Brasil. Além disso, buscamos avaliar o conceito de espécies morfológicas com base nos dados moleculares para auxiliar a revisão taxonômica em andamento da Schlotheimia no Brasil (trabalho extra tese) realizados em colaboração com pesquisadores do Instituto de Botânica de São Paulo.
2) Taxonomic Notes on Brazilian Macromitrium Brid. (Bryophyta, Orthotrichaceae) O segundo capítulo, foi submetido para a revista Phytotaxa (Qualis B2 ). Foi um trabalho de taxonomia clássica, realizado como um projeto paralelo, durante o doutorado sanduíche no
Naturalis Biodiversity Center na Holanda, em que foi possível ter acesso ao material typus do
gênero Macromitrium depositados em diversas coleções como BM, E, G, GOET, L, NY, PC. Nosso objetivo neste trabalho foi verificar todos os 64 nomes de Macromitrium brasileiro (20 nomes aceitos e 44 nomes excluídos da flora do Brasil) buscando esclarecer sua validade e identificação correta, contribuindo para o conhecimento da diversidade de espécies de
Macromitrium ocorrentes no Brasil.
3) Macromitrium Brid. (Bryophyta, Orthotrichaceae) in Brazil: A Molecular Approach O terceiro capítulo foi submetido para a revista Plant Systematics and Evolution (Qualis B1), e emprega um conjunto de dados moleculares de quatro marcadores dos três compartimentos genômicos para estudar a circunscrição e delimitação de espécies de
Macromitrium no Brasil, visando testar se as espécies brasileiras de Macromitrium formam um
grupo monofilético. Caso não seja um grupo monofilético, delimitar quais as espécies brasileiras pertencem ao verdadeiro Macromitrium e testar o potencial de Marcadores trnG-R,
trnL-F e ITS para identificação molecular das espécies brasileiras de Macromitrium.
1.1 Referências
Bergamini A, Peintinger M (2002) Effects of light and nitrogen on morphological plasticity of the moss Calliergonella cuspidata. Oikos, 96: 255–363.
Bolson M, Smidt EC, Brotto ML, Silva-Pereira V (2015) ITS and trnH-psbA as efficient DNA Barcodes to identify threatened commercial woody angiosperms from Southern Brazilian Atlantic Rainforests. PLoS ONE. doi:10.1371/journal.pone.0143049
Buryová B, Shaw AJ (2005) Phenotypic plasticity in Philonotis fontana (Bryopsida: Bartramiaceae). J Bryol. doi: 10.1179/174328205X40545
Costa DP, Luizi-Ponzo AP (2010) Introdução: as briófitas do Brasil. In: Forzza, R. C., org., et al. Instituto De Pesquisas Jardim Botânico Do Rio De Janeiro. Catálogo deplantas e fungos do Brasil [online]. Rio de Janeiro: Andrea Jakobsson Estúdio: Instituto de Pesquisa Jardim Botânico do Rio de Janeiro, p. 61-68. Vol. 1. ISBN 978-85-8874-242-0. Available from SciELO Books <http://books.scielo.org>.
Costa DP, Peralta DF (2015) Bryophytes diversity in Brazil. Rodriguésia. doi: 10.1590/2175-7860201566409
Costa DP, Pôrto KC, Luizi-Ponzo AP, Ilkiu-Borges AL, Bastos CJP, Câmara PEAS, Peralta D,F, Bôas-Bastos SBV, Imbassahy CAA, Henriques DK, Gomes HCS, Rocha LM, Santos ND, Siviero TS, Vaz-Imbassahy TF, Churchill SP (2011) Synopsis of theBrazilian moss flora: checklist, distribution and conservation. Nova Hedwigia 93: 277–334.
Dantas TS, Valente DV, Carvalho-Silva, M, Camara PEAS (2018) Bryophyte phylogeny and DNA Barcoding: tools for assessing Brazilian diversity. Braz. J. Bot. 41: 497. https://doi.org/10.1007/s40415-018-0473-9
Flora do Brasil 2020 under construction. Jardim Botânico do Rio de Janeiro. http://floradobrasil.jbrj.gov.br/. Accessed in: 10 Mar. 2018
Frey W, Stech M (2009). Marchantiophyta, Bryophyta, Anthocerotophyta. In: Frey W. (ed.): Syllabus of Plant Families. A. Engler´s Syllabus der Pflanzenfamilien, 13th ed., Part 3 Bryophytes and seedless Vascular Plants. Gebr. Borntraeger, Stuttgart
Goffinet B, Buck WR, Shaw AJ (2009) Morphology, anatomy, and classification of the Bryophyta. Pp. 55--138 in: Goffinet, B. & Shaw, A.J. (eds.), Bryophyte Biology, Ed. 2. Cambridge University Press, Cambridge, U.K.
Gonzalez MA, Baraloto C, Engel J, Mori SA, Pétronelli P, Riéra B, et al. (2013) Identification of Amazonian trees with DNA barcodes. PLoS One. doi: 10.1371/journal.pone.0007483 Gradstein SR, Churchill SP, Salazar-Allen N (2001) Guide to the bryophytes of Tropical
America. Mem N Y Bot Gard 86: 1-577.
Hassel K, Pedersen B, Söderström L (2005) Changes in life-history traits in an expanding moss species: phenotypic plasticity or genetic differentiation? A reciprocal transplantation experiment with Pogonatum dentatum. Ecography. doi: 10.1111/j.0906-7590.2005.03910.x
Hebert PDN, Cywinska A, Ball SL, Dewaard JR (2003) Biological identifications through DNA
barcodes. Proc R Soc Lond. B. doi: 10.1098/rspb.2002.2218
Palhares RM, Drummond MG, Brasil BSAF, Cosenza GP, Brandão MGL, Oliveira G (2015) Medicinal plants recommended by the World Health Organization: DNA barcode
identification associated with chemical analyses guarantees their quality. PLoS ONE. doi:10.1371/journal.pone.0127866.
Rivera-Jiménez H, Rossini BC, Tambarussi EV, Veasey EA, Ibanes B, Marino CL (2017) DNA barcode regions for differentiating Cattleya walkeriana and C. loddigesii. Acta Scientiarum. doi: 10.4025/actascibiolsci.v39i1.33024
Shaw A J, Goffinet B (2000) Bryophyte Biology. Cambridge University Press, England. 476p. Silva JN, Costa AB, Silva JV, Almeida C (2015) DNA barcoding and phylogeny in neotropical species of the genus Spondias. Biochemical Systematics and Ecology. doi: 10.1016/j.bse.2015.06.005.
Stech M, Frey W (2008) A morpho-molecular classification of the mosses (Bryophyta). Nova Hedwigia. doi: 10.1127/0029-5035/2008/0086-0001
Vitt DH, Ramsay HP (1985a) The Macromitrium complex in Australiasia (Orthotrichaceae, Bryopsida). Part I. Taxonomy and phylogenetic relationships. Journal of the Hattori botanical laboratory 59: 325-451.
Vitt DH, Ramsay HP (1985b) The Macromitrium complex in Australasia (Bryopsida: Orthotrichaceae). Part II. Distribution, ecology and paleogeography, Journal of the Hattori Botanical Laboratory, 59: 453–468.
Vivas CV, Moraes RCS, Alves-Araújo A, Alves M, Mariano-Neto E, van den Berg C, Gaiotto FA (2014) DNA barcoding in Atlantic Forest plants: What is the best marker for Sapotaceae species identification? Genet Mol Biol. doi: 10.1590/S1415-47572014005000019
2 OBJETIVOS 2.1 Objetivo geral
Elaborar uma estratégia de DNA Barcoding ou ferramenta molecular para identificação das espécies dos gêneros Schlotheimia e Macromitrium, visando à solução de problemas taxonômicos, contribuindo com dados moleculares para o desenvolvimento futuro de trabalhos em larga escala de DNA Barcoding.
2.2 Objetivos específicos
a) Analisar o potencial de discriminação ao nível de espécie dos marcadores de DNA usados, selecionando o melhor marcador ou a combinação de marcadores ideais para os gêneros em estudo;
b) Ajudar na solução de problemas de identificação taxonômica dos gêneros Schlotheimia e Macromitrium através de uma abordagem integrada morfo-molecular;
c) Testar o monofiletismo gênero Macromitrium inserindo as espécies que ocorrem no Brasil na filogenia existente;
d) Testar o monofiletismo do gênero Schlotheimia inserindo as espécies que ocorrem no Brasil na filogenia existente;
e) Inferir circunscrições moleculares e testar o estado das espécies endêmicas brasileiras dos gêneros Schlotheimia e Macromitrium;
f) Comparar a variação molecular interespecífica x intraespecífica e detectar possíveis casos de especiação críptica;
CAPÍTULO I
Molecular tools to identify tropical mosses: a case study of the
Brazilian species of Schlotheimia Brid. (Bryophyta,
Orthotrichaceae).
Valente DV, Câmara PEAS, Peralta DF, Stech M (2019) Molecular tools to identify tropical mosses: a case study of the Brazilian species of Schlotheimia Brid. (Bryophyta, Orthotrichaceae). Systematics and
3 MOLECULAR TOOLS TO IDENTIFY TROPICAL MOSSES: A CASE STUDY OF THE BRAZILIAN SPECIES OF SCHLOTHEIMIA BRID. (BRYOPHYTA,
ORTHOTRICHACEAE)
3.1 Abstract
Species of the moss genus Schlotheimia are often difficult to identify morphologically because it is necessary to study sporophytic characters, but fertile plants are quite rare. In this paper we aim to infer the potential of trnG-R, trnL-F, and ITS markers to resolve phylogenetic relationships and species delimitations within Schlotheimia in Brazil, using different tree-based analysis methods and Automatic Barcode Gap Discovery (ABGD). For the first time in bryophytes the trnG-R spacer was sequenced together with the trnG intron (trnG-R region). Furthermore, we aim to evaluate the morphological species concept based on the molecular data, to aid the ongoing taxonomic revision of Schlotheimia in Brazil. The combined analysis of all three markers resolved eleven clades corresponding to Schlotheimia species, which was corroborated by ABGD and morphological characters. The best candidate marker for DNA barcoding was trnG-R due to its easy amplification and ability to discriminate all but one species. While trnG-R is sufficient for routine identification, the combination trnG-R + ITS should be used if all Brazilian Schlotheimia species should be identified with high statistical support. The nuclear marker ITS was easy to amplify and more variable than the plastid markers, but a higher percentage of low quality sequences due to polynucleotide stretches or fungal contamination is a potential drawback. TrnL-F had a low discrimination potential. The analysis of the studied molecular markers provides a baseline for the taxonomic revision of
Schlotheimia and is an important tool for the identification of sterile specimens.
3.2 Introduction
Bryophytes are often difficult to identify at species level, due to their generally small size, relatively few and inconspicuous morphological characters, frequent absence of sporophytic characters, considerable morphological plasticity in response to environmental factors, and still unclear species delimitations and taxonomy in many groups (e.g. Bergamini & Peintinger, 2002; Buryová & Shaw, 2005; Hassel, Pedersen & Söderström, 2005).
Species identification based on DNA sequences (DNA barcoding) is a useful tool to overcome problems with morphological identification (Hebert, Cywinska, Ball & Dewaard, 2003). DNA barcoding of plants is generally performed based on a combination of two or more genetic loci. From a pool of several DNA regions tested mainly for angiosperms, the chloroplast loci rbcL and matK were chosen as core plant barcoding markers (CBOL Plant Working Group, 2009), and the chloroplast psbA-trnH as well as nuclear ribosomal ITS regions are two widely used supplementary barcode loci (e.g. Kress, Wurdack, Zimmer, Weigt & Janzen, 2005; Sass, Little, Stevenson & Specht, 2007). For bryophytes, no consensus has been achieved yet: a part of the DNA barcoding studies of bryophytes used the same four markers recommended for angiosperms, whereas others tested different marker combinations (Table 1). In particular, recent large-scale DNA barcoding studies in Germany and the Netherlands relied on the marker combination trnL-F and ITS (and rpl16 in Germany), due to partly low discrimination capacity of rbcL and psbA-trnH, and amplification problems with matK in bryophytes.
DNA barcoding studies of bryophytes so far focused mainly on extra-tropical regions (Table 1), although species diversity is highest in the tropics. Brazil, for example, hosts at least 1567 bryophyte species (http://floradobrasil.jbrj.gov.br/), but DNA barcoding of plants in Brazil has so far been restricted entirely to angiosperms (e.g. Palhares et al., 2015; Rivera-Jiménez et al., 2017). The potential of DNA barcoding to catalogue and better understand the tropical bryophyte biodiversity, especially in mega-diverse countries like Brazil, remains to be investigated.
As part of a pilot project to investigate the utility of DNA barcoding for Brazilian bryophytes (see Dantas, Valente, Carvalho-Silva & Câmara, 2018), the present study addresses species identification in Schlotheimia Brid. (Orthotrichaceae, subfamily Macromitrioideae), a pantropical moss genus with approximately 120 species (Frey & Stech, 2009). For the Neotropics, about 56 species are recorded, but the genus is in need of taxonomic revision in the Neotropics, and probably less than 30 species are actually justified (Gradstein, Churchill &
Salazar-Allen, 2001). In Brazil, 13 species were considered to occur, six of which are endemic (Costa & Peralta, 2015). In a first step of revising Schlotheimia in Brazil, one species was newly described and another reduced to synonymy (Peralta & Ristow, 2017). However, morphological species delimitation in Schlotheimia is difficult based on gametophytic characters, and sporophytes are frequently absent in herbarium collections and living plants in the field. Therefore, molecular data are important to test species delimitations and guide the taxonomic revision.
To infer molecular species delimitations in Brazilian Schlotheimia, we selected three DNA regions, the chloroplast trnL-F and trnG as well as the nuclear ribosomal ITS region. We considered markers that were either frequently used in previous studies or tested already in Orthotrichaceae (Table 1), and were supposed to perform well in terms of sequencing success and species discrimination capacity. In contrast to the study of Li, Guo & Yu (2013), and for the first time in bryophytes, we employed the extended trnG-R region, so that all three potential DNA barcoding markers comprise two non-coding parts each (trnL-F: trnL group I intron and
trnL-trnF intergenic spacer, trnG-R: trnG group II intron and trnG-trnR intergenic spacer, ITS:
internal transcribed spacers ITS1 and ITS2). Besides, the trnG-R region presented good results for DNA barcoding in ferns (Pryer et al., 2010).
Hence, the aims of this study are to (i) test the potential of trnG-R, trnL-F, and ITS markers to resolve the phylogenetic relationships and species delimitations within Schlotheimia in Brazil, and (ii) evaluate the morphological species concept based on the molecular data to aid the ongoing taxonomic revision of Schlotheimia in Brazil.
To discriminate species from the molecular data we follow a step-wise approach. Firstly, putative species are inferred from tree-based analysis methods employed in earlier DNA barcoding studies (neighbour-joining, maximum parsimony, maximum likelihood, Bayesian inference), based on topological congruence between (combinations of) markers and statistically significant clade support (bootstrap support ≥95% and posterior probability ≥ 0.95). Secondly, an automated species delimitation approach, Automatic Barcode Gap Discovery (ABGD; Puillandre, Lambert, Brouillet & Achaz, 2012), which uses a pairwise genetic distance-based method to find non-overlapping intra- and interspecific genetic distance distributions within the sequence dataset, is employed as an alternative to construct hypothetical candidate species from the molecular data. Finally, the distribution of morphological character states is analysed by ancestral state reconstruction to infer whether the putative species distinguished by DNA barcoding are recognizable morphologically.
3.3 Materials and methods
Sampling
We sequenced 34 specimens of Schlotheimia and two specimens of Macromitrium (Orthotrichaceae, Macromitrioideae) (Goffinet, Bayer & Vitt, 1998) from herbarium collections from UB and SP as well as fresh samples collected during field work. Schlotheimia was resolved in a basal position within Macromitrioideae, indicating that taxa from the subfamily Orthotrichoideae should be used as outgroup representatives. However, we used species of
Macromitrium as outgroup representatives because sequences from both subfamilies were
difficult to align, especially for the variable marker ITS. We sequenced 2−4 individuals for each ingroup species, depending on availability of material as well as DNA extraction and amplification success. Voucher information and Genbank accession numbers are listed in Appendix S1.
DNA extraction, amplification and sequencing
DNA extraction and PCR amplification (Mullis & Faloona, 1987) were performed at the Laboratory of Molecular Biology of Plants, Botany Department, University of Brasília. Total genomic DNA was extracted using the mini-CTAB protocol (Doyle & Doyle, 1987), with modifications (Câmara, 2010).
Three molecular markers (chloroplast trnL-F and trnG-R, nuclear ribosomal ITS) were amplified with primers Cm / Fm (Frey, Stech & Meißner, 1999), B (Pačak & Szweykowska-Kulińska, 2000) / TRNR22R (Nagalingum, Schneider & Pryer, 2007), and 18F / 25R (Stech & Frahm, 1999), respectively. The PCR amplification mixture had a total volume of 50 μl and contained 5 μl of 5× thermophilic buffer, 5 μl of 50 mM MgCl2, 0.5 μl Taq polymerase
(Promega, Madison, Wisconsin, U.S.A.), 2 μl of BSA (10 mg/ml), 4 μl of 1 mM dNTP, 2.5 μl of each primer (10 μM), 2.0 μl of DNA and 26.5 μl of water. The PCR profile for all markers was 95°C (30 sec), 48°C–56°C (45 sec), 72°C (1 min) for 35 cycles, always preceded by an initial melting step of 1 min at 95°C and with a final extension of 72°C for 5 min. Primer annealing temperatures were 56°C for trnL-F, 53°C for trnG-R and 48°C for ITS. If no PCR products were obtained, the PCR was repeated with other annealing temperatures for trnL-F (50 or 55 °C), trnG-R (50, 51 or 55 °C) and ITS (54 or 58 °C), respectively, and 100% DMSO (Dimethyl sulfoxide) or Betaine (concentration 0.5, 1 and 2M) was added. If still no success was achieved, the DNA of the respective samples was re-extracted.
PCR products were purified and sequenced by Macrogen (Seoul, Korea). Sequences were assembled and edited using Geneious v.6.1.6 (Biomatters, 2010).
Molecular species discrimination
Sequences were initially aligned using Clustal X (Higgins & Sharp, 1988), then manually adjusted using PhyDE v.0.9971 (Müller, Quandt, Müller & Neinhuis, 2006) and exported as Nexus files. Intraspecific and interspecific variation were inferred from pairwise distances, calculated using the Kimura 2-parameter (K2P) model (Kimura, 1980) in MEGA7 (Kumar, Stecher & Tamura, 2015).
Tree-based methods to infer species delimitations included neighbour-joining (NJ) as well as phylogenetic approaches (maximum parsimony [MP], maximum likelihood [ML], Bayesian inference [BI]). Analyses were carried out for each marker separately as well as for the combinations trnL-F + trnG-R, trnL-F + ITS, trnG-R + ITS, and all three markers combined.
Neighbour-joining (Saitou & Nei, 1987) and MP analyses were performed in PAUP* v.4.0b10 (Swofford, 2002). Heuristic searches under MP were performed with 1,000 random addition replicates and tree-bisection-reconnection (TBR) branch swapping, saving a maximum of 10,000 trees. All characters were unordered and equally weighted, and gaps were either treated as missing data or coded as informative by simple indel coding (SIC; Simmons & Ochoterena, 2000) as implemented in SeqState (Müller, 2005).
For ML and BI analyses, the best-fit model of evolution for each locus was obtained based on the Akaike information criteria using jModeltest 3.06 (Posada, 2008). Maximum likelihood analyses were carried out using RAxML v7.2.6 (Stamatakis, 2006; Silvestro & Michalak, 2012). Clade support for NJ, MP and ML was assessed from bootstrap analyses with 1000 replicates (Felsenstein, 1985).
Bayesian inference analyses were carried out in MrBayes v. 3.2.6 (Ronquist et al., 2012). Two runs with four Markov Chain Monte Carlo chains each were run for 5,000,000 generations. Chains were sampled every 1,000 generations and the respective trees were written to a tree file. Convergence of runs was verified by ensuring that the average standard deviation of split frequencies was <0.01. Tracer 1.5 (Rambaut & Drummond, 2013) was used to determine when the tree sampling stabilized. The first 25% of the trees were discarded as ‘burn-in’. A majority rule consensus tree and posterior probabilities were calculated from the resulting trees.
Automatic Barcode Gap Discovery (ABGD; Puillandre et al., 2012) analyses were carried out on the online web server (http://wwwabi.snv.jussieu.fr/public/abgd/abgdweb.html). The dataset of three markers combined (trnL-F + trnG-R + ITS) was used with the input file in fasta format and the Kimura-2-parameter model and a range of different settings employed. Since the latter resulted in the same number of initial partitions, the final parameters were set as follows: Pmin = 0.001, Pmax = 0.01, Steps = 50, X = 1.1, Nb bins = 100.
Ancestral state reconstruction
We scored the character states of 54 gametophytic and sporophytic characters for the sequenced Schlotheimia specimens. For sterile specimens, sporophytic character states were added based on the information from the fertile specimens or the literature. Of the 54 characters, 37 were constant across all species and excluded from further analysis. The remaining 17 variable characters (Appendix S2) were used for ancestral state reconstruction under maximum parsimony in Mesquite v.351 (Maddison & Maddison, 2015). A maximum parsimony consensus tree in nexus format, calculated in PAUP based on the combined molecular matrix (trnL-F + trnG-R + ITS) and using the same parameters as described above, and the character matrix of standard categorical data were used as input data. The Trace Character History option was used to map the distribution of ancestral character states on the phylogeny.
3.4 Results
Sequencing success
PCR amplification and sequencing success using a single primer pair was high (94100%) for all three markers. The trnG-R region was the easiest to analyse, since PCR products could be obtained from 97% of the samples in a single PCR round, and all of them resulted in high-quality sequences. Both trnL-F and ITS required greater laboratorial effort. For
trnL-F, high-quality sequences could be obtained from 100% of the samples as well, 82% of
which after the first-round PCR and 18% after a second PCR with modifications or after re-extracting the DNA. For ITS, only 65% of the samples yielded good sequences from the first PCR product, whereas the remainder had to be redone, either by repeating the PCR or by re-extracting the DNA. All samples could be sequenced after a maximum of four attempts, but still 6% of the ITS sequences were of insufficient quality. Finally, 29 samples for which high-quality sequences of all three markers were obtained, were included in the further analyses (Fig. 1). Characteristics of sequence lengths and variability of all three markers are summarized in Table
2. The nuclear ITS marker is 48/72% larger and 60/76% more variable relative to the plastid markers trnG-R and trnL-F, respectively.
Molecular species discrimination
Phylogenetic trees of each individual marker (trnL-F, trnG-R and ITS) did not show incongruence in terms of well-supported branches (data not shown), indicating that the markers could be combined. The Bayesian inference tree based on the maximum amount of information (three markers combined with indels coded by SIC), is shown in Fig. 1, together with a summary of the results obtained from all applied tree-based and ABGD species delimitation methods.
Eleven clades corresponding to putative morphological species (A – Schlotheimia
appressifolia, B – S. tecta, C – S. gracilescens, D – S. merkelii, E – S. spinomitria, F – S. rugifolia, G – S. jamesonii, H – S. elata, I – S. pseudoaffinis, J – S. torquata, and K – S. trichomitria) were resolved in the combined analysis (Fig. 1). Of these, nine received high
support (bootstrap support [BS] ≥95% and posterior probability [PP] ≥0.95) in at least three of the four analyses. The remaining two clades D and H received high PP values, but moderate bootstrap support (BS ≥85−≤94%). Relationships among these putative species received generally lower (BS ≤84%) or no support, except for the sister group relationships of clades A / B and D / E, respectively.
None of the individual markers was able to resolve all 11 clades with high support in all analyses (Fig. 1). In the analyses with indels included (Appendix S3), the ITS marker separated all 11 clades with high support in the BI analysis. Bootstrap support was high in at least one of the three analyses (NJ, MP, ML) for eight clades and moderate for clade E. The trnG-R marker resolved eight clades with high support and six clades with high BS in at least one analysis (most often in ML). The trnL-F marker performed worst, with in total only four clades receiving high support. Both chloroplast markers together separated ten clades with high support, while the combinations of either chloroplast marker plus ITS discriminated all 11 clades with high support, at least in the BI analyses. Results of the analyses with indels excluded (Appendix S4) were similar to the analyses including indels in terms of support for the 11 clades. Differences occurred mainly in clades D, E, and K, with generally higher support with indels for the former two clades, but higher support without indels in few analyses for clade K (BI of trnG-R and the combination trnL-F + trnG-R).
Ranges of intraspecific versus interspecific pairwise nucleotide distances according to the K2P model and overlap for the individual markers and combinations are shown in Table 3. All markers and combinations showed overlap between the maximum intraspecific and minimum interspecific distance, with a minimum overlap of 0.003 for the combinations trnL-F + trnG-R and trnL-trnL-F + trnG-R + ITS, and a maximum overlap of 0.009 in ITS. The overlap was due to the small intraspecific distance between clades D (S. merkelii) and E (S. spinomitria) in contrast to a large intraspecific distance within clade A (S. appressifolia).
The species delimitation method ABGD (Figure 1) revealed a clear “barcode gap” at Pmax = 0.0010, delimiting eleven putative species.
Ancestral state reconstruction
Character state changes ranged between one and nine among the 17 variable characters (Appendix S5), indicating different degrees of homoplasy in most characters. Five characters displayed apomorphic states for a single molecular clade corresponding to a Schlotheimia species (7 – vegetative leaf [VL] apex aristate in S. pseudoaffinis, 8 – VL margin dentate in S.
appressifolia, 9 – VL costa long excurrent in S. pseudoaffinis, 11 – perichaetial leaf apex
acuminate in S. torquata, 11 – calyptra surface rugose in S. merkelii, spinose with foliose trichomes in S. spinomitria, and pilose with filamentose trichomes in S. trichomitria; Appendix S2). The combination of four characters (6 – vegetative leaves lamina, 10 – perichaetial leaves lamina, 14 – capsule exposure, and 17 – calyptra surface), of which the ancestral state reconstructions are shown in Figure 2, allowed to distinguish all 11 molecularly separated species except S. elata and S. gracilescens. The latter two species are distinguishable by a number of other characters (characters 1–5 and 9; cf. Appendix S2).
3.5 Discussion
The evaluation of the potential of genetic loci for DNA barcoding of plants should take into account the general barcoding criteria (sufficient genetic variability at the species level, short sequence to facilitate DNA extraction and amplification, and presence of conserved flanking regions for the development of universal primers (Kress et al., 2005). For bryophytes there is not a single universal marker matching all these characteristics that allows the identification of all species. Most existing studies on bryophytes have compared the highly variable ITS and various markers of the chloroplast genome (Table 1). While some studies concluded that it may take several markers to distinguish all species of a bryophyte genus with statistical support (e.g. Arctic Dicranum species; Lang et al., 2014), other studies suggested that
a single marker out of a set of markers tested might suffice. For example, ITS was sufficient to distinguish all studied species of the liverwort genus Herbertus (Bell et al., 2012) and the
Racomitrium canescens complex of the moss family Grimmiaceae (Stech et al., 2013). Given
the different results in different bryophyte lineages, however, testing the variability and utility for species delimitation of commonly used markers still appears necessary for newly studied genera.
In Schlotheimia, ITS was an easy-to-amplify marker with high variability for identification at the species level, discriminating all 11 putative species with significant support at least under Bayesian inference. However, problems regarding sequence quality were encountered due to poly-C, -T and -A nucleotide stretches of approximately 50 base pairs in ITS1, and sometimes fungal contamination, which demanded greater efforts to obtain sequences of good quality. These problems have already been pointed out by Hollingsworth, Graham & Little (2011) as a limitation to the use of ITS as a core barcode. In the gymnosperm order Cycadales, the presence of polynucleotide stretches was a negative factor for the use of ITS for DNA barcoding as well (Sass et al., 2007).
The trnL-F region was considered as an easy to amplify marker, but with low variation in angiosperms (Kress et al., 2005). Subsequent DNA barcoding studies of bryophytes confirmed that trnL-F sequences could be obtained easily and were of high quality (e.g. Liu et al., 2010), which was also true for Schlotheimia. The species discrimination capacity of trnL-F varied considerably in different bryophyte genera, from 53% in Dicranum (Lang et al., 2014) to 89% in 49 species of mosses (Liu et al., 2010). In Orthotrichaceae, this marker alone was able to discriminate only 57% of the Chinese species of Macromitrium (Li et al., 2013), and in Brazilian Schlotheimia the discrimination potential is even lower (Fig. 1, Appendix S3, S4).
The trnG-R region was the marker that best met the barcoding criteria in the present study, being easy to amplify, with excellent sequence quality, and with sufficient variation to discriminate the Brazilian Schlotheimia species (all but two clades resolved with statistical support in at least one analysis; Fig. 1). Until now, only the trnG intron has been used in molecular studies of mosses (e.g. Câmara & Shaw 2013; Carter, 2010, 2012; Medina, Lara, Goffinet, Garilleti & Mazimpaka, 2013). In Chinese Macromitrium, the discrimination potential of trnG was almost 86% (Li et al., 2013). As in trnL-F, the trnG intron is more conserved in
Schlotheimia than in Macromitrium, which would preclude its use for DNA barcoding, but the
addition of the trnG-trnR intergenic spacer significantly increases the discrimination potential. The trnG-R has been used successfully for phylogenetic inference (Nagalingum et al., 2007;
Leon, Rothfels, Arakaki, Young & Pryer, 2013) and DNA barcoding (Pryer et al., 2010) in ferns, and it is suggested to employ the same region in future studies of bryophytes as well, instead of only sequencing the trnG intron.
The combination trnL-F + trnG-R did not result in greater discrimination potential compared to trnG-R alone (Appendix S3, S4). Similar results were found by Liu et al. (2010), where some combinations of chloroplast regions did not increase their discrimination capacity. If all Brazilian Schlotheimia species should be distinguished with high statistical support, independent from the type of analysis performed, the combinations trnG-R and ITS should be used (Fig. 1). However, trnG-R is sufficient for routine identification of Schlotheimia specimens from Brazil, only in some cases where additional sequencing of ITS may be required.
The discrimination of 11 Schlotheimia species was congruent among all phylogenetic methods used and the ABGD species delimitation method. The intraspecific variation of S.
appressifolia (clade A) is greater than the interspecific variation between S. merkelii (clade D)
and S. spinomitria (clade E), which leads to overlap of intra- and interspecific distances in the total dataset (all three markers combined; Table 3). However, the clades of all species are well supported by molecular data and (combinations of) morphological characters (see below), indicating that an overall comparison of pairwise distances is less meaningful than the phylogenetic and species delimitation methods. The intraspecific molecular variation in S.
appressifolia may be a case of cryptic speciation, which is increasingly documented in mosses
(Carter, 2012; Fernandez, Shevock, Glazer & Thompson, 2006; Hedenäs & Eldenäs, 2007; McDaniel & Shaw, 2003; Myszczyński et al., 2017; Schwarzera & Joshi, 2017; Shaw, 2000).
The molecular approach shows that the majority of the plants used in this study were incorrectly identified, which probably holds for other collections deposited in Brazilian herbaria as well. Frequent misidentification based on morphology may be due to an oversimplified use of few gametophytic characters in Brazil, where Schlotheimia plants with smooth to undulate vegetative leaves were commonly identified as S. jamesonii and plants with rugose vegetative leaves as S. rugifolia. The analysis of sporophytic characters was not a routine practice for identification of Brazilian Schlotheimia species. The present study corroborates that gametophytic characters alone are not sufficient for reliable identification, whereas a combination of gametophytic and sporophytic characters allows to distinguish all 11 molecularly separated clades (Fig. 2, Appendix S2). The perichaetial leaves lamina and apex, capsule exposure, and calyptra surface are among the most important characters for identification of Schlotheimia species occurring in Brazil, together with characters of the
vegetative leaves (Fig. 2, Appendix S2). In the absence of perichaetial leaves and sporophytes, however, routine identification based on DNA sequences would be necessary for some species that are gametophytically identical (S. rugifolia, S. spinomitria and S. trichomitria, Appendix S2).
Schlotheimia appressifolia and S. tecta, the two species of the Neotropical subg. Stegotheca (Mitt.) Broth. (Atwood, 2009) have immersed capsules and mitrate-campanulate
calyptrae, in contrast to exserted capsules and large campanulate calyptrae in subg.
Schlotheimia (Fig. 2-C). The latter is resolved as paraphyletic due to the nested position of the
well-supported clade of subg. Stegotheca (Fig. 1), but analyses based on more markers are necessary to resolve subgeneric relationships with confidence. Of the gametophytic characters that Atwood (2009) used to distinguish S. appressifolia and S. tecta, the margin and costa of the vegetative leaves do not show any difference between the specimens analysed here, whereas the dentate versus entire leaf margin, and, in addition, the distally undulate versus rugose perichaetial leaf surface does allow to distinguish both species (Appendix S2).
The specimens of clade C were originally identified as S. rugifolia, but the morphological characteristics (undulate to distally plane vegetative leaves, distally plane perichaetial leaves, and smooth calyptra; Fig. 2 – A, B and D) match S. gracilescens, a species restricted to South Brazil. Instead, clade F is defined as true S. rugifolia, due to the combination of rugose vegetative and perichaetial leaves, and a smooth calyptra (Fig. 2 – A, B and D). The character state of rugose vegetative leaves furthermore occurs in clades D, E, J and K, which can be easily confused with S. rugifolia when the plants are sterile, but are distinguished by their perichaetial leaves and calyptra (Fig. 2 – A, B and D). Clade D comprises specimens identified as S. merkelii, S. rugifolia and S. jamesonii. However, they all show a combination of character states that corresponds to S. merkelii, namely rugose vegetative leaves, distally undulate perichaetial leaves, and a rugose calyptra. The specimens of clade E were identified as S. rugifolia or S. torquata, respectively, but the distally undulate perichaetial leaves and spinose calyptra with foliose trichomes do not fit with either species. The latter character is diagnostic for the recently described S. spinomitria (Peralta & Ristow, 2017) and distinguishes it, together with the ovoid, larger capsule, from the closely related S. merkelii. The species S.
torquata (clade J) and S. trichomitria (clade K) are characterised by the diagnostic character
states of acuminate perichaetial leaves and a pilose calyptra, respectively.
The specimens of clades G (S. jamesonii) and H (S. elata) were initially all identified as
and erect branches, and lanceolate vegetative leaves, whereas S. elata has long and erect branches, and oblong-lanceolate vegetative leaves (Appendix S2 – characters 4 and 5). Finally,
S. pseudoaffinis (clade I) differs from all other species by vegetative leaves with a long-aristate
apex.
The present results showed the importance of molecular information to better understand species diversity and for the reliable identification of Schlotheimia plants, in particular when sporophytic characters are absent, a common situation when collecting specimens of this genus in the field.
3.6 Acknowledgments
This project was funded by the Brazilian National Council for Scientific and Technological Development (Conselho Nacional de Desenvolvimento Científico e Tecnológico— CNPq),Edital 03/2014 (MEC / MCTI / CAPES / CNPq / FAPs), including a Special Visiting Researcher fellowship (Pesquisador Visitante Especial—PVE) to the last author, and by a CNPq PhD SWE (Doutorado Sanduíche no Exterior) scholarship to the first author.
3.7 References
Atwood, J. J. (2009). A taxonomic revision of Schlotheimia subg. Stegotheca (Orthotrichaceae).
The Bryologist, 112, 290−300.
Bączkiewicz, A., Szczecińska, M., Sawicki, J., Stebel, A., & Buczkowska, K. (2017). DNA barcoding, ecology and geography of the cryptic species of Aneura pinguis and their relationships with Aneura maxima and Aneura mirabilis (Metzgeriales, Marchantiophyta). Public Library of Science ONE, 12, e0188837.
Bell, D., Long, D. G., Forrest, A. D., Hollingsworth, M. L., Blom, H. H., & Hollingsworth, P. M. (2012). DNA barcoding of European Herbertus (Marchantiopsida, Herbertaceae) and the discovery and description of a new species. Molecular Ecology Resources, 12, 36–47.
Bell, D., Long, D. G., Hollingsworth, M. L. (2013). The use of DNA barcoding to address major taxonomic problems for rare British bryophytes. Final revised report. Edinburgh: Royal Botanic Garden Edinburgh, 69 pp.