RESEARCH ARTICLE
Exploring Genetic Divergence in a
Species-Rich Insect Genus Using 2790 DNA Barcodes
Xiaolong Lin*, Elisabeth Stur, Torbjørn Ekrem
Department of Natural History, NTNU University Museum, Norwegian University of Science and Technology, Trondheim, Norway
Abstract
DNA barcoding using a fragment of the mitochondrial cytochromecoxidase subunit 1 gene (COI) has proven to be successful for species-level identification in many animal groups. However, most studies have been focused on relatively small datasets or on large datasets of taxonomically high-ranked groups. We explore the quality of DNA barcodes to delimit species in the diverse chironomid genusTanytarsus(Diptera: Chironomidae) by using dif-ferent analytical tools. The genusTanytarsusis the most species-rich taxon of tribe Tanytar-sini (Diptera: Chironomidae) with more than 400 species worldwide, some of which can be notoriously difficult to identify to species-level using morphology. Our dataset, based on sequences generated from own material and publicly available data in BOLD, consist of 2790 DNA barcodes with a fragment length of at least 500 base pairs. A neighbor joining tree of this dataset comprises 131 well separated clusters representing 121 morphological species ofTanytarsus: 77 named, 16 unnamed and 28 unidentified theoretical species. For our geographically widespread dataset, DNA barcodes unambiguously discriminate 94.6% of theTanytarsusspecies recognized through prior morphological study. Deep intraspecific divergences exist in some species complexes, and need further taxonomic studies using appropriate nuclear markers as well as morphological and ecological data to be resolved. The DNA barcodes cluster into 120–242 molecular operational taxonomic units (OTUs) depending on whether Objective Clustering, Automatic Barcode Gap Discovery (ABGD), Generalized Mixed Yule Coalescent model (GMYC), Poisson Tree Process (PTP), subjec-tive evaluation of the neighbor joining tree or Barcode Index Numbers (BINs) are used. We suggest that a 4–5% threshold is appropriate to delineate species ofTanytarsusnon-biting midges.
Introduction
Genetic variation between species in cytochrome c oxidase subunit 1 (COI) gene sequences has been proven informative for species identification in many animal taxa, including non-biting midges, the Chironomidae (Insecta, Diptera) [1–5]. The mutation rate in COI can be fast enough to provide informative characters for delineation of closely related and sibling species
OPEN ACCESS
Citation:Lin X, Stur E, Ekrem T (2015) Exploring Genetic Divergence in a Species-Rich Insect Genus Using 2790 DNA Barcodes. PLoS ONE 10(9): e0138993. doi:10.1371/journal.pone.0138993
Editor:Diego Fontaneto, Consiglio Nazionale delle Ricerche (CNR), ITALY
Received:May 15, 2015
Accepted:September 7, 2015
Published:September 25, 2015
Copyright:© 2015 Lin et al. This is an open access article distributed under the terms of theCreative Commons Attribution License, which permits unrestricted use, distribution, and reproduction in any medium, provided the original author and source are credited.
Data Availability Statement:All relevant data are within the paper and its Supporting Information files. Collection data, sequences, and trace files are available on BOLD (www.boldsystems.org) in public dataset“Tanytarsus DNA barcoding 2015 (DS-TABAC)”, DOI:dx.doi.org/10.5883/DS-TABAC.
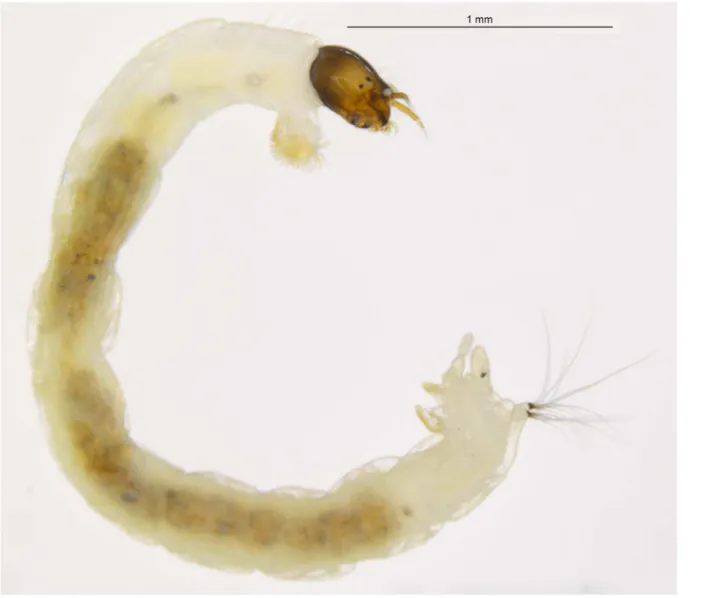
and even to analyze phylogeographic patterns within a single species [6–9]. Many chironomid species, especially in the larval life stage (Fig 1), are difficult to identify and partial COI gene sequences as DNA barcodes have been shown appropriate to delimit and identify species as well as associate life stages in this family [3,10–14]. In general, partial COI sequences show a high-level of divergence between species in Chironomidae, so high that the marker performs poorly in phylogenetic reconstructions [3,15]. Nevertheless, COI has been used to infer the phylogenetic relationship within family Chironomidae [16,17].
The dipteran family Chironomidae is the most ubiquitous and usually most abundant insect group in all types of freshwater and even saltwater [18]. At present, there are more than 6000 described species worldwide (P. Ashe pers comm.) and certain species can reach densities up to 15600 individuals per m2at favorable conditions [19]. Due to their high abundance and diver-sity, chironomid larvae occupy a key position among benthic macroinvertebrates, they are important as freshwater indicator organisms [20] and as food items for fish. In addition, larval head capsules are preserved in lake sediments and have been shown to be useful in climate reconstructions since species composition varies with water temperature as well as other envi-ronmental factors. However, identification of chironomid larvae to species-level via morphol-ogy usually is arduous, time-consuming and expensive, and more effective identification techniques such as DNA barcoding can greatly improve the use of chironomids in biological-assessments of freshwater ecosystems [21–23]. Recently, this was exemplified with a next-gen-eration sequencing protocol analyzing 1015 tropical chironomids at a cost of less than $1 per specimens [24]. At present, there are few publications that investigate the performance of DNA barcoding in species-rich genera. A couple of studies are known from plants [25–27], but there are currently no papers that explore how efficient DNA barcodes are in delineation of species in larger genera (>200 species) of insects.
The genusTanytarsusvan der Wulp, 1874 is the most species-rich genus of the tribe Tany-tarsini in subfamily Chironominae with more than 400 described species worldwide. Species of the genusTanytarsus(Fig 2) are eurytopic, and immatures occur in all types of freshwater. There are even species with larvae and pupae in marine or terrestrial environments[28]. The genus was erected by van der Wulp [29] and various species groups and regionally distributed species have been revised over the last few decades [30–37]. A morphological determination of someTanytarsusspecies group can be extremely challenging. Moreover, there are many unknown and cryptic species inTanytarsusand it is difficult to associate the immature stages with adults through rearing since it is time-consuming and not always successful. In general, identification at the species-level strongly relies on the morphological characters of adult males. However, diagnostic characters might be unreliable due to intraspecific morphological variation even for this life stage and phenotypic plasticity [38] in morphometric ratios and hypopygial structures caused by different temperature regimes and food quality has been observed in several chironomid species [39]. Moreover, artifacts created in the slide-mounting process can also obscure species specific characteristics.
Currently, there are several approaches to analyze how DNA barcode data form separate genetic clusters potentially corresponding to biological species. In this context, evaluation of neighbor joining [40] ID-trees perhaps represents the most widely used method for the direct comparison of DNA barcodes. In general, neighbor joining trees are easy and fast to compute with appropriate bootstraps replicates even for big datasets. Furthermore, methods such as Automatic Barcode Gap Discovery (ABGD) [41], the Generalized Mixed Yule Coalescent model (GMYC) [42–44], the Poisson Tree Process (PTP) [45], Objective Clustering [46], and the Barcode Index Numbers Algorithm (BINs) [47] also have been proven to represent effec-tive approaches to group hypothetical species in a sequence alignment. ABGD aims to assign sequences into Operational Taxonomic Units (OTUs) based on a statistically inferred barcode
gap in an initial partitioning, conducting a second round of splitting through recursive parti-tioning [41,48]. ABGD performs well for standard prior maximum intraspecific divergences except for datasets including less than three sequences per species [41]. The GMYC model is a likelihood method for delimiting species by fitting within and between species branching mod-els to gene trees [43] while the Poisson Tree Process (PTP) is a method for species delimitation based on rooted phylogenetic trees [45]. The PTP-model assumes that intra- and interspecific substitutions follow two distinct Poisson processes, and that intraspecific substitutions are discernibly fewer than interspecific substitutions [44]. The Objective Clustering method of the software Species Identifier aims to explore intra- and interspecific genetic distances of cluster sequences based on pairwise distances [46]. Species Identifier allows the comparison of clusters generated using preset thresholds by users with existing taxonomy [49–51]. The Barcode Index Numbers Algorithm (BIN) is incorporated in the Barcode of Life Data Systems (BOLD,www. boldsystems.org) [47,52]. BIN analysis generates one number of OTUs for each set of DNA barcode sequences using the Refined Single Linkage algorithm [48]. The BIN algorithm has been effectively tested on numerous taxonomic groups and shows potential for applications in
Fig 1.Tanytarsussp.10XL, larva.
doi:10.1371/journal.pone.0138993.g001
species abundance studies and environmental barcoding [47]. Nevertheless, few studies have compared the performance of the novel analytical methods for the DNA barcode-based delin-eation of OTUs [48].
In this study, we have used 2790TanytarsusDNA barcodes to test the utility of COI bar-codes for species identification inTanytarsus. Furthermore, we used DNA barcodes and mor-phology to evaluate potentially cryptic species within this genus. Finally, we compared the number of OTUs using ABGD, GMYC, PTP, Objective Clustering and the BIN algorithm to see which of these methods correspond best to morphological species concepts inTanytarsus and which level of intraspecific divergence we should expect within this genus.
Materials and Methods
Taxon sampling and data collection
TheTanytarsussequences used in this study originated from specimens that were collected in many different parts of the world. Own field work was conducted mainly in Northern Europe, China and Canada during recent years, but chironomids were also collected in Central Europe, North and Central America, Africa and Australia. Specimens were identified morphologically using taxonomic revisions and species description [31,32,34–36,53–64].
In addition to own data, we searched for public COI barcodes in BOLD belonging to genus Tanytarsusthat were longer than 500 base pairs and lacked stop codons, indicating absence of dysfunctional copies of mitochondrial genes (NUMTs). Searches were done January 17, 2015.
Fig 2.Tanytarsus occultusBrundin, 1949, adult male.
Hits were combined with own data and are available through the dataset“TanytarsusDNA barcoding 2015 (DS-TABAC)”on BOLD, DOI:dx.doi.org/10.5883/DS-TABAC.
The complete dataset includes 2790 COI sequences of which 164 originated from Gen-Bank, 340 from our own lab at the Department of Natural History, NTNU University Museum, and the remaining 2286 sequences from various projects in BOLD. In our dataset, 1242 of 2790 specimens were not examined by us and only identified to genus-level. Since this would make analyses of intra- and interspecific distances difficult, we re-named the 1242 sequences by the clusters they belonged to in a standard neighbor joining tree based on Kimura 2-Parameter (K2P) [65] distances (S1 File). In cases where unidentified sequences matched named morphospecies, we gave them this name; in cases where there was no matching morphospecies name, we gave all sequences in that cluster the same distinguish-able group name.
DNA extraction, PCR amplification, sequencing and alignment
Sampled specimens were preserved in 75–96% ethanol and stored dark at 4°C before molecular analyses. Depending on size, a single or three legs were removed from the majority of speci-mens and sent to Canadian Centre for DNA Barcoding, the Biodiversity Institute of Ontario (Guelph, Ontario, Canada) for DNA extraction, PCR and bi-directional Sanger sequencing as part of the International Barcode of Life project. In addition, DNA of 102 specimens was extracted from the thorax and head using GeneMole DNA Tissue Kit on a GeneMole1 instru-ment (Mole Genetics, Lysaker, Norway) at the Departinstru-ment of Natural History, NTNU Univer-sity Museum. The standard protocol was followed with exception that 4μl Proteinase K was
mixed with 100μl buffer for overnight lysis at 56°C. The final elution volume was 100μl. After
DNA extraction, the exoskeleton was washed with 96% ethanol and mounted in Euparal on the same microscope slide as its corresponding antennae, wings, legs and abdomen following the procedure outlined by Sæther [66]. Vouchers are deposited at the Department of Natural History, NTNU University Museum, Trondheim, Norway and College of Life Sciences, Nankai University, Tianjin, China (Chinese specimens).
A 658 bp fragment of the COI region was PCR-amplified using the universal primers LCO1490 and HCO2198 [67]. DNA amplification was carried out in 25μl reactions using
2.5μl 10x Takara ExTaq pcr buffer (CL), 2μl 2.5 mM dNTP mix, 2μl 25 mM MgCl2, 0.2μl
Takara Ex Taq HS, 1μl 10μM of each primer, 2μl template DNA and 14.3μl ddH2O. Amplifi-cation cycles were performed on a Biorad C1000 Thermal Cycler (Bio-Rad, California, USA) and followed a program with an initial denaturation step of 95°C for 5 min, then followed by 34 cycles of 94°C for 30 s, 51°C for 30 s, 72°C for 1 min and 1 final extension at 72°C for 3 min. PCR products were purified using illustra ExoProStar 1-Step (GE Healthcare Life Sciences, Buckinghamshire, UK) and shipped to MWG Eurofins (Ebersberg, Germany) for bidirectional sequencing using BigDye 3.1 (Applied Biosystems, Foster City, CA, USA) termination.
Sequences were assembled and edited using Sequencher 4.8 (Gene Codes Corp., Ann Arbor, Michigan, USA). Sequence information was uploaded on BOLD (www.boldsystems.org) along with an image and collateral information for each voucher specimen.
The sequences names were edited using MESQUITE 2.50 [68]. Alignment of the sequences was carried out using the Muscle algorithm [69] on amino acids in MEGA 6 [70] (S2 File).
The nucleotide statistics and pairwise distances using the K2P model were calculated in MEGA 6 (S1 Table). The neighbor joining tree was conducted using K2P substitution model with 500 bootstrap replications and the“pairwise deletion”option of missing data in MEGA 6. The K2P model was used to make our results comparable with most other DNA barcode stud-ies on insects.
To estimate the number of OTUs, the aligned sequences were subjected to Objective Clus-tering at 2–7% threshold in Species Identifier (TaxonDNA 1.6.2) [46]. In addition, the aligned sequences were sorted into hypothetical species using ABGD method with a priorPthat ranges from 0.005 to 0.1, and the K2P model, following the default settings. The number of BINs in the dataset was counted as they appeared in BOLD on March 28th, 2015. Furthermore, a reduced dataset with 1250 unique sequences (haplotypes) was generated using ElimDupes (https://hcv.lanl.gov/content/sequence/ELIMDUPES/elimdupes.html) and manual inspection for use in both GMYC and PTP. The ultrametric tree required for the GMYC method was obtained using BEAST 1.8 [71] on the reduced dataset. The MCMC chain was run for 50 mil-lion generations under the HKY substitution model with two partitions (positions 1+2; posi-tion 3) and the Yule speciaposi-tion model. Runs using more complex and fit models of substituposi-tion (e.g. GTR+I+G) was also attempted, but MCMC failed to start in BEAST due to low initial like-lihoods even with UPGMA and ML starting trees. Prior settings are available from the authors. The MCMC log on prior and posterior values was examined in Tracer 1.6 [72] and a burn-in of 10 million generations was used to avoid suboptimal trees in the final consensus tree. The single-threshold GMYC method was applied using thesplitspackage [73] in R [74] with step-by-step guides available on Tomochika Fujisawa’s blog (https://tmfujis.wordpress.com/2013/ 04/23/how-to-run-gmyc/). For PTP-based OTU estimation, the needed rooted phylogenetic input-tree was constructed with RAxML [75] using raxmlGUI v1.3 [76] with the GTR+G+I substitution model. The PTP model was implemented following the default parameters and 500 000 generations on the bPTP web server (http://species.h-its.org/ptp/) [45] as well as 1 000 000 generations on the stand-alone version in a Linux environment.
Results and Discussion
Barcode analysis
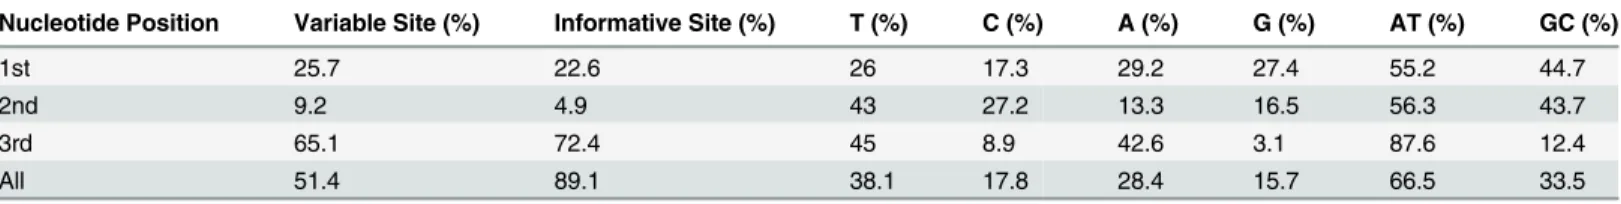
The aligned 2790 sequences ranged from 507 to 658 base pairs, including 798 sequences with full barcode length. In total, there were 338 variable sites (51.4%), of which 301 (89.1%) were parsimony informative. Most variable sites occurred in the third codon-position. The
sequences were heavily AT-biased specifically in the third position with an average AT-compo-sition of 87.6% (Table 1).
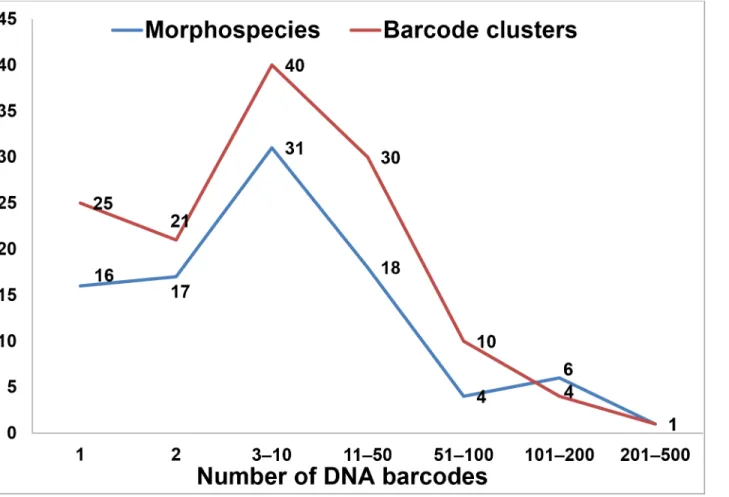
Our dataset included 1548 barcode sequences which before analysis were identified to spe-cies-level and 1242 barcodes which were identified to the genus-level. The number of DNA barcodes per morphospecies (n = 93) and DNA barcode cluster (n = 131) ranged from 1 to 430 (Fig 3).
Average intraspecific divergence was 2.14% (S2 Table) with maximum intraspecific diver-gence observed inTanytarsus brundiniLindeberg (21.1%). This was even beyond the average interspecific divergence (15.9%) and sequences belonging to this morphospecies clustered clearly in four genetically divergent groups, indicating cryptic species. A similar situation was also observed for other morphospecies (see below). When disregarding obvious cryptic species complexes, the maximum intraspecific divergence was 8.5% (forTanytarsus occultusBrundin).
Table 1. Variable and informative sites, and average nucleotide composition in the aligned COI gene sequences.
Nucleotide Position Variable Site (%) Informative Site (%) T (%) C (%) A (%) G (%) AT (%) GC (%)
1st 25.7 22.6 26 17.3 29.2 27.4 55.2 44.7
2nd 9.2 4.9 43 27.2 13.3 16.5 56.3 43.7
3rd 65.1 72.4 45 8.9 42.6 3.1 87.6 12.4
All 51.4 89.1 38.1 17.8 28.4 15.7 66.5 33.5
The maximum interspecific divergence was 26.7% betweenTanytarsus mendaxKieffer and Tanytarsus nigricollisGoetghebuer. The minimum interspecific divergence was 0.9% between Tanytarsus unagiseptimusSasa andTanytarsus kiseogiRee & Jeong, but this case probably was due to a misidentification of specimens not available to us for morphological examination and might also indicate a taxonomic synonym (see below).
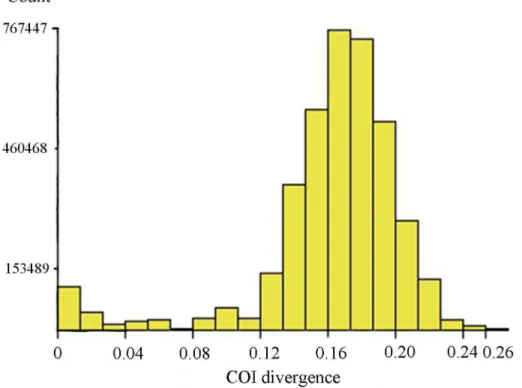
In general, our data showed distinctly larger interspecific (S3 Table) than intraspecific diver-gences, but due to the presence of cryptic species diversity and a few misidentifications, there was no clear“barcode gap”in the pairwise K2P distances (Fig 4). In addition, there are some cases of low genetic divergence between morphologically distinguishable species, likely due to recent speciation. For instance, three related morphospecies in thelugensspecies group, Tany-tarsus lugensKieffer,Tanytarsus bathophilusKieffer andTanytarsus heliomesonyctiosLangton cannot be well-differentiated by DNA barcodes having interspecific pairwise distance up to about 3.2% (Fig 5).
Species discrimination
The neighbor joining tree based on 2790 DNA barcodes comprises 131 well separated clusters, representing 77 named and 44 unnamed morphological species ofTanytarsus(S1 File). Among these unnamed species, 16 identified morphological species might be new to science, while 28 barcode clusters were not otherwise assignable to valid morphospecies. The results Fig 3. Number of DNA barcodes per morphospecies and barcode clusters based on the neighbor joining tree.
doi:10.1371/journal.pone.0138993.g003
showed that DNA barcode clusters in general corresponded well with morphological species concepts inTanytarsus; 94.6% (88/93) of the species identified based on morphology matched divergent barcode clusters.
However, DNA barcodes were not sufficient for identification in all cases. Previous studies have shown that the presences of NUMTs [77–79], symbiotic bacteria [80], incomplete lineage sorting [81–83], introgression [84,85] and distant geographic areas can present obstacles in
Fig 4. Histogram of pairwise K2P distances of 2790 aligned sequences.The figure was a result of
analysis with ABGD using the K2P model. The horizontal axis shows the pairwise K2P-distance, and the vertical axis shows the number of pairwise sequence comparisons.
doi:10.1371/journal.pone.0138993.g004
Fig 5. Neighbor joining subtree of theTanytarsus lugensspecies group.Numbers on branches
represent bootstrap support (>70%) based on 500 replicates; scale represents K2P genetic distance.
species delimitation [86,87] using DNA barcoding. NUMTs and symbiotic bacteria, like Wol-bachiahave to our knowledge not yet been recorded in Chironomidae, but the three other causes are possible explanations for the observed inconsistencies between morphological and molecular species clusters.
A few examples of deep COI sequence divergence among specimens assigned to a single mor-phospecies were detected. There were at least two divergent barcode clusters inTanytarsus aterrimus Freeman,Tanytarsus bathophilusKieffer,Tanytarsus brundini,Tanytarsus glabrescensEdwards, Tanytarsus guerlus(Roback),Tanytarsus heusdensisGoetghebuer,T.lestageiLindeberg,Tanytarsus occultus,Tanytarsus takahashiiKawai & Sasa andTanytarsus telmaticusLindeberg (S1 File).
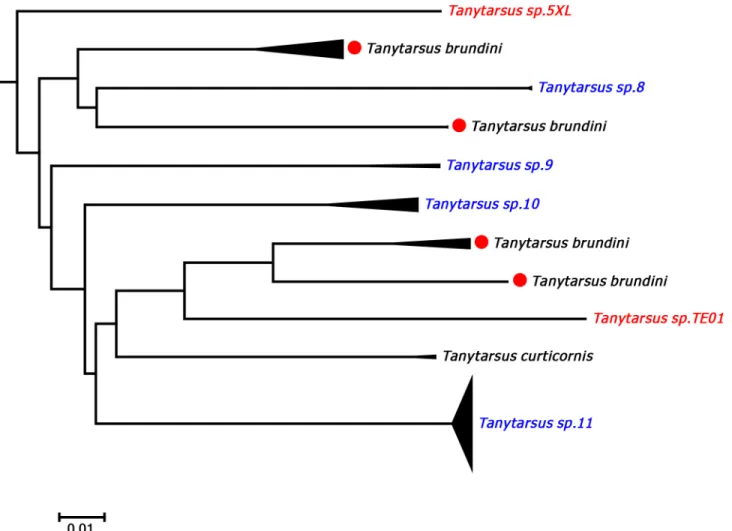
ForT.brundini, intraspecific pairwise K2P distances ranged from 0 to 21.1% and a total of four well separated barcode clusters Western Europe and Canada were observed (Fig 6). Exam-ination of the voucher specimens did not reveal any distinct morphological characters corre-sponding with the clustering in COI sequences although some zoogeographical structure is present. We therefore suspect that this morphological species contains several cryptic species. A similar situation is present inT.heusdensis, another member of theTanytarsus chinyensis Goetghebuer species group. There were three distinct barcode clusters ofT.heusdensisin the result from our analyses, but no obvious morphological characters that will separate adult
Fig 6. Neighbor joining subtree of theTanytarsus brundinispecies complex.Numbers on branches represent bootstrap support (>70%) based on 500
replicates; scale represents K2P genetic distance.
doi:10.1371/journal.pone.0138993.g006
males from Germany and Norway (S1 File). Thus, it appears that geographically separated populations of some species in theT.chinyensisgroup are genetically divergent, but difficult to separate based on morphology. Identification of species in this group has also previously been acknowledged as challenging [36,55,57], thus it is perhaps not surprising that hidden genetic diversity is detected among members in theT.chinyensisgroup.
Members of the South AfricanT.aterrimusalso showed high intraspecific divergences with pairwise K2P-distances of up to 13.9%. The DNA barcodes clustered into 3 groups (S1 File) that so far could not be differentiated via morphology.
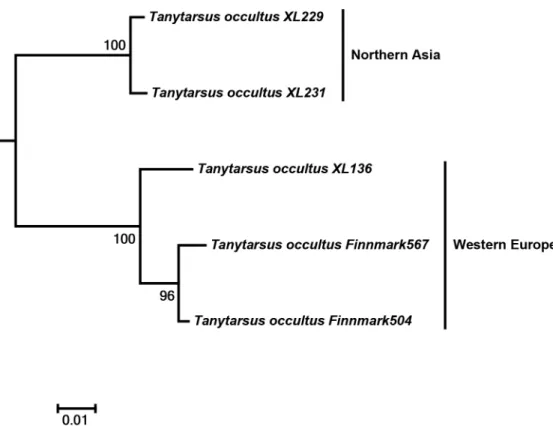
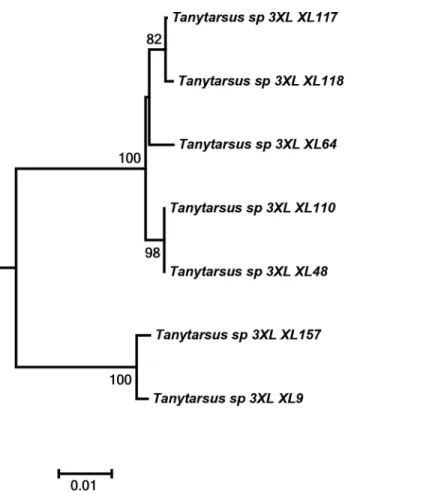
Another interesting case was observed inT.occultuswhere specimens from Northeastern Asia and Western Europe separated into two distinct clusters with sequence divergences from 7% to 8.5% (Fig 7). The adult male vouchers examined are as far as we can observe at present morphologically indistinguishable. Also, DNA barcodes of a hitherto undescribed morphospecies from Tibet, Tany-tarsussp.3XL, showed high intraspecific divergences and might be more than one species (Fig 8).
In addition to this previously undetected diversity, our results also suggest some new taxo-nomic synonyms on the species-level. For example, three closely related species inTanytarsus eminulusspecies group,Tanytarsus oscillansJohannsen,T.unagiseptimusandT.kiseogi, dis-tributed in China, Japan, South Korea, the Russian Fast East and Singapore, are differentiated by subtle morphological differences in the adult male genitalia [32,60]. DNA barcode data indicate thatT.kiseogishould be regarded as a junior synonym ofT.unagiseptimusas the max-imum interspecific divergence between specimens of these species was 1.5%. It is not clear if theT.kiseogispecimens from which the COI-sequences in GenBank originates are part of the type material, but they were possibly identified by one of the authors from the original species description since he is co-authoring the DNA barcode paper that published these sequences.
Fig 7. Neighbor joining subtree ofTanytarsus occultus.Numbers on branches represent bootstrap
support (>70%) based on 500 replicates; scale represents K2P genetic distance.
However, a formal synonymy should await comparison of type material.Tanytarsus oscillans andTanytarsus unagiseptimus, on the other hand, probably are two valid species with a mini-mum interspecific divergence at 7% (Fig 9). In this case, the subtle morphological difference (i.e. extensively distributed microtrichia between the crests of the anal point inT.oscillans compared to a smooth surface inT.unagiseptimus) was perfectly mirrored by COI divergence.
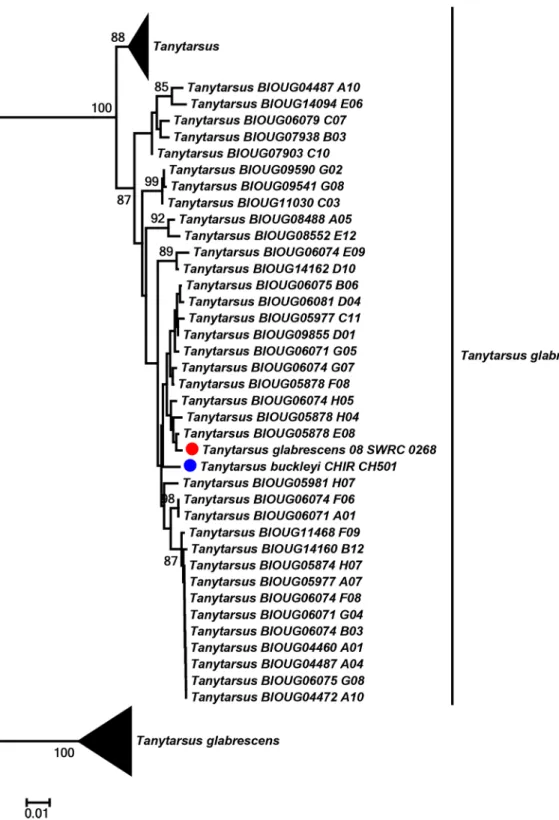
Some mismatches between barcode clusters and identifications might be a result of misiden-tifications or differences in opinion between identifiers. This is to be expected because there are several groups inTanytarsuswith challenging taxonomy. Moreover, this type of mismatch can also occur if a reference database is used to identify unknown specimens but the identifications of these are not updated at the same time as the original reference sequences(s) if these change name. We found thatT.glabrescenstogether with some unnamedTanytarsussequences grouped into three well-differentiated barcode clusters, which might demonstrate potential cryptic species within this species complex. One of the clusters was particularly interesting as single individuals of bothT.glabrescensandTanytarsus buckleyiSublette were present together with many sequences from unidentified specimens (Fig 10). In case like this it is tempting to regard the oneT.glabrescensas a misidentification since the species name already is present in two other clusters. However, it can only be clarified through examination of voucher specimens and collaboration between identifiers. It is therefore a great advantage for the taxonomy of challenging groups to deposit reference data in a database that facilitates communication
Fig 8. Neighbor joining subtree ofTanytarsus sp.3XL from Tibet, China.Numbers on branches
represent bootstrap support (>70%) based on 500 replicates; scale represents K2P genetic distance.
doi:10.1371/journal.pone.0138993.g008
between contributors and identifiers, such as BOLD, and voucher specimens of the sequences in an accessible collection [88].
A very similar situation was observed in theTanytarsus lestageiaggregate which consists of several almost identical species [36,58]. Within the European populations, some specimens of T.lestagei,T.telmaticus and Tanytarsuscf.longitarsisKieffer grouped into the same cluster, while remaining specimens ofT.telmaticus,T.lestageiandTanytarsuscf.disparLindeberg could be well differentiated by DNA barcodes (Fig 11). However, there are currently several species with multiple synonyms within this group. Thus, perhaps Lindeberg’s [58] separation of sympatric species turns out to be closer to the true species boundaries within this aggregate than Ekrem’s [32] interpretation (and synonymization) of species in the same group.
The Asian members of theT.lestageiaggregate,T.takahashiiandTanytarsus yunosecundus Sasa previously have been distinguished from each other based on characters found in adult males, e.g. differences in the fore leg ratio and the shape of the superior volsella [32]. Recently,
Fig 9. Neighbor joining subtree ofTanytarsus kiseogi,Tanytarsus oscillansandTanytarsus unagiseptimus.Numbers on branches represent
bootstrap support (>70%) based on 500 replicates; scale represents K2P genetic distance.
Tadashi Kobayashi (pers comm.) suggestedT.takahashiito be a junior synonym ofT. yunose-cundus. DNA barcodes of populations from China and South Korea revealed low interspecific
Fig 10. Neighbor joining subtree ofTanytarsus buckleyiandTanytarsus glabrescens.Numbers on branches represent bootstrap support (>70%)
based on 500 replicates; the dots indicate the specimens identified morphologically; scale represents K2P genetic distance.
doi:10.1371/journal.pone.0138993.g010
pairwise distance (2%) (Fig 12). However, a single DNA barcode ofT.takahashiifrom Japan downloaded from GenBank did not group with these sequences and was more than 13% diver-gent based on K2P-distances. The single, diverdiver-gent sequence was obtained from a pooled sam-ple of male individuals (Richard Cornette pers comm.) and it is not unlikely that the barcode of T.takahashiifrom Japan in GenBank belong to another species. We have examined specimens from the same collection sample and can confirm that there are two superficially similar Tany-tarsusand oneCladotanytarsusspecies present. Nevertheless, a synonymy ofT.takahashiiand T.yunosecundusshould be avoided until more specimens of these species are examined and analyzed, especially from Japanese populations.
It should be kept in mind that there are no shortcuts to resolve the taxonomy of morpholog-ically and genetmorpholog-ically challenging species. Thus, further study using nuclear markers and more thorough morphological analyses are needed to sort out species boundaries and conclude on the potentially cryptic species within the different group treated above.
Fig 11. Neighbor joining subtree of EuropeanTanytarsus lestageiaggregate.Numbers on branches represent bootstrap support (>70%) based on 500
replicates; scale represents K2P genetic distance.
We based our study on taxon samples from around the world, particularly from Australia, China, Northern America and Western Europe. As there are more than 200 described Tanytar-susspecies from Africa, Australia, Eastern Asia and Southern America [32,37], we have only about 1/3 of the known diversity of this genus. As shown above, a single or a few barcodes may not represent the putative species as whole, especially for geographically widespread species. Thus, restricted taxon sampling in many cases probably have led to an underrepresentation of the complete genetic range and inaccuracies in estimation of species [89]. As mentioned above, geographically separated populations ofT.occultusshowed high intraspecific variability. With-out morphological taxonomic consideration, the two geographically separated populations would be regarded as cryptic species. In this and other sister group cases inTanytarsus, a more detailed analysis is required to determine the current rate of gene flow between populations and if there is speciation in progress. Despite several challenging and biologically interesting incidents, DNA barcoding generally is effective for species identification inTanytarsus, even when taxa are sampled from multiple and large geographic areas. This is similar to what has been recorded for Lepidoptera [90,91] but opposite to findings for aquatic beetles [92]. Our data and results also show that traditional taxonomic considerations and comprehensive sam-pling are highly important for correct identification [87,93] and that DNA barcodes in refer-ence libraries provide an excellent starting point for taxonomic considerations and discussion on the identity of challenging taxa.
Fig 12. Neighbor joining subtree of AsianTanytarsus lestageiaggregate (Tanytarsus takahashiiand
Tanytarsus yunosecundus).Numbers on branches represent bootstrap support (>70%) based on 500
replicates. It should be noted that“Tanytarsus talcahashii”is a misspelling of“Tanytarsus takahashii”in GenBank; scale represents K2P genetic distance.
doi:10.1371/journal.pone.0138993.g012
OTU estimation
Any particularly set threshold value for species separation will affect taxon diversity in any tax-onomic group. Moreover, studies indicate that the same threshold is not appropriate for all groups. In insects for instance, a 2% threshold provides effective identification at the species-level of Ephemeroptera [94–96], Lepidoptera [97,98], Plecoptera and Trichoptera [97]. While a 2.2% threshold has been found appropriate for Heteroptera [99,100], a 2.5% threshold has been found suitable for aquatic beetles [101], a>3% threshold has been registered for several dipteran groups [46,102,103].
In Chironomidae, average intraspecific divergences range from 0.9% to 2.32% [3,104] and when disregarding obvious cryptic species clusters, maximum intraspecific K2P distances can be as high as 8.5%, considerably higher than comparable rates in Heteroptera, Hymenoptera and Lepidoptera. In our study, morphologically determinedTanytarsusspecies had average intraspecific divergences of 2.14% (S2 Table). This was the case even for heavily sampled spe-cies such asT.mendax, where 430 sequences showed a mean pairwise divergence of 2.1%.
The number of OTUs in a DNA barcode dataset relies on both the method and threshold value used. Thus, we tested different methods for OTU calculation to explore what might be an appropriate threshold forTanytarsusspecies.
Using Objective Clustering at threshold 2% yielded 217 clusters, while thresholds ranging from 3% to 7% yielded 120–156 clusters (Fig 13). Applying the ABGD method with prior
Fig 13. The number of DNA clusters according to Objective Clustering at different thresholds.
intraspecific divergence ranging from 3%–5% yielded 123–129 OTUs (Fig 14). This is similar to the number of divergent barcode clusters seen when subjectively evaluating the neighbor joining tree. Analyses of the reduced dataset containing only unique haplotype sequences yielded 180 clusters with a confidence interval ranging from 164–193 using GMYC (Fig 15) and 224–225 Fig 14. The number of the OTUs by the prior intraspecific divergence calculated with ABGD online.
doi:10.1371/journal.pone.0138993.g014
Fig 15. Results of the GMYC analysis.The red vertical line (left) indicates the single threshold time between inter-intraspecific branching; y axis (left)
equals the number of lineages; y axis (center) equals the log likelihood of the single threshold GMYC model; the x axes (left and center) show substitutions per nucleotide site; the red branches (right) on the gene tree indicate estimated delimited species.
doi:10.1371/journal.pone.0138993.g015
clusters with PTP and bPTP (S3 File). Thus, GMYC yielded a more conservative number of spe-cies than PTP, but still considerably higher than what was obtained with Objective Clustering and ABGD using higher thresholds and our subjective evaluation of the neighbor joining tree. The observed difference in the species estimate for PTP may be associated with the unbalanced number of individuals sampled per species as this can affect the species delimitation [45].
Examining the dataset in BOLD, 2749 of 2790 barcodes were assigned a barcode index num-ber and represented 242 BINs. In total, 2250 barcodes matched with morphospecies, represent-ing 166 BINs, and 63 barcodes were srepresent-ingletons representrepresent-ing 63 BINs. Surprisrepresent-ingly, the 242 BINs in BOLD were approximately twice the number of divergent barcode clusters observed in the neighbor joining tree (131) and even higher than the number of species estimated by PTP. Thus, forTanytarsus, the number of BINs generated by the BIN algorithm did not represent morphological species well. One reason might be that numerous identical haplotypes move the BIN-boundary upwards (Sujeevan Ratnasingham pers comm.). However, since BINs in BOLD have been shown to coincide strongly with known species boundaries in other insect groups, i.e. Coleoptera and Lepidoptera [97,105], we suspect that it also is the starting threshold for the BIN algorithm that is too low for Chironomidae. Comparison of the results of ABGD, GMYC, PTP and objective clustering indicate that a 4–5% threshold is more appropriate for species delimitation in genusTanytarsus.
Conclusion and Future Prospects
The discrimination ofTanytarsusspecies by DNA barcodes was highly successful with unam-biguous grouping of 94.6% of the species recognized through prior morphological study. Deep intraspecific divergence existed in some species complexes, and further taxonomic studies are required to resolve these issues. Such studies preferably should involve morphological exami-nation of all life stages as well as analysis of relationships using nuclear markers. Morphological re-examination of voucher specimens, in particular nominal types will be crucial to sort out taxonomic challenges and provide the best barcode reference library possible. We suggest that a 4–5% threshold on average is an appropriate level for species separation inTanytarsus non-biting midges. This threshold is considerably higher than it is for certain other insect groups as well as the basis for the BIN-algorithm used in BOLD.
Supporting Information
S1 File. Neighbor joining bootstrap consensus tree for 2790Tanytarsusbarcodes.Numbers on branches are bootstrap support (>70%) using 500 bootstrap replicates. The clade names in blue represent 28 groups morphologically unidentified to the species-level, but clustering together. The clade names in red represent 16 identified morphospecies which likely are new to science but unpublished. The clade names in black represent morphospecies. For named spe-cies with more than two clusters, indicating cryptic spespe-cies or misidentifications, we have used symbols with the same color and shape in front of the sequence names.
(PDF)
S2 File. Original alignment of 2790Tanytarsusbarcode sequences.Alignment of the 2790 sequences based on the Muscle algorithm (Edgar 2004) in MEGA6. Final length 658 bp. (FAS)
S3 File. Maximum likelihood tree based on the PTP model.
(PDF)
analysis included all codon positions and pairwise deletion of gaps for each sequence pair. (XLS)
S2 Table. Estimates of average evolutionary divergence over sequence pairs within groups.
Average pairwise distances within species based on the K2P substitution model calculated in MEGA6. The analysis included all codon positions and pairwise deletion of gaps for each sequence pair. In order to calculate the intra- and interspecific distances including sequences without species names in public databases, species names were added to 1242 DNA barcodes if they matched named sequences in the neighbor joining tree.
(XLS)
S3 Table. Estimates of evolutionary divergence over sequence pairs between groups. Aver-age pairwise distance between species based on the K2P substitution model calculated in MEGA6. The analysis included all codon positions and pairwise deletion of gaps for each sequence pair. In order to calculate the intra- and interspecific distances including sequences without species names in public databases, species names were added to 1242 DNA barcodes if the matched named sequence in the neighbor joining tree.
(XLS)
Acknowledgments
This paper is part of the first author’s thesis for the partial fulfilment of a PhD degree of the Norwegian University of Science and Technology, Norway, entitled“Systematics and Evolu-tionary history ofTanytarsusvan der Wulp, 1874 (Diptera: Chironomidae)”.
Thanks to the team at the Canadian Centre for DNA Barcoding for help with DNA barcode analysis. We are grateful to Professor Xinhua Wang (College of Life Sciences, Nankai Univer-sity, China), who provided us with many important specimens from China. We also thank Dr. Wojciech Giłka (Department of Invertebrate Zoology and Parasitology, University of Gdańsk, Poland) and Chinese colleagues including Xin Qi (College of Life Sciences, Taizhou University, China), Chao Song and Wenbin Liu (College of Life Sciences, Nankai University, China) for providing material and Richard Cornette (National Institute of Agrobiological Sciences, Ibar-aki, Japan) for valuable information on published COI sequences and material ofTanytarsus takahashii.Thanks also to Diego Fontaneto, Bruno Rossaro and Michael Raupach for valuable input on the manuscript.
Author Contributions
Conceived and designed the experiments: XL ES TE. Performed the experiments: XL TE. Ana-lyzed the data: XL TE. Contributed reagents/materials/analysis tools: XL ES TE. Wrote the paper: XL ES TE.
References
1. Hebert PDN, Stoeckle MY, Zemlak TS, Francis CM. Identification of birds through DNA barcodes. PLoS Biol. 2004; 2(10):e312. doi:10.1371/journal.pbio.0020312PMID:15455034; PubMed Central PMCID: PMC518999.
2. Hogg ID, Hebert PDN. Biological identification of springtails (Hexapoda: Collembola) from the Cana-dian Arctic, using mitochondrial DNA barcodes. Can J Zool. 2004; 82(5):749–754. doi:
10.1139/Z04-041PMID:WOS:000225021400010.
3. Ekrem T, Willassen E, Stur E. A comprehensive DNA sequence library is essential for identification with DNA barcodes. Mol Phylogenet Evol. 2007; 43(2):530–542. doi:10.1016/j.ympev.2006.11.021
PMID:WOS:000246918800015.
4. Oba Y, Ohira H, Murase Y, Moriyama A, Kumazawa Y. DNA barcoding of Japanese click beetles (Coleoptera, Elateridae). Plos One. 2015; 10(1):e0116612. doi:10.1371/journal.pone.0116612PMID: 25636000; PubMed Central PMCID: PMC4312051.
5. Smith PJ, Mcveagh SM, Allain V, Sanchez C. DNA identification of gut contents of large pelagic fishes. J Fish Biol. 2005; 67(4):1178–1183. doi:10.1111/j.0022-1112.2005.00804.xPMID: WOS:000232787400025.
6. Hebert PDN, Cywinska A, Ball SL, deWaard JR. Biological identifications through DNA barcodes. Proc Biol Sci. 2003; 270(1512):313–321. doi:10.1098/rspb.2002.2218PMID:12614582; PubMed Central PMCID: PMC1691236.
7. Hebert PDN, Ratnasingham S, deWaard JR. Barcoding animal life: cytochrome c oxidase subunit 1 divergences among closely related species. Proc Biol Sci. 2003; 270 Suppl 1:S96–99. doi:10.1098/ rsbl.2003.0025PMID:12952648; PubMed Central PMCID: PMC1698023.
8. Hunter SJ, Goodall TI, Walsh KA, Owen R, Day JC. Nondestructive DNA extraction from blackflies (Diptera: Simuliidae): retaining voucher specimens for DNA barcoding projects. Mol Ecol Resour. 2008; 8(1):56–61. doi:10.1111/j.1471-8286.2007.01879.xPMID:21585718.
9. Ilmonen J, Adler PH, Malmqvist B, Cywinska A. TheSimulium vernumgroup (Diptera: Simuliidae) in Europe: multiple character sets for assessing species status. Zool J Linn Soc. 2009; 156(4):847–863. doi:10.1111/j.1096-3642.2009.00500.xPMID:WOS:000269395300006.
10. Carew ME, Pettigrove V, Hoffmann AA. The utility of DNA markers in classical taxonomy: Using cyto-chrome oxidase I markers to differentiate AustralianCladopelma(Diptera: Chironomidae) midges. Ann Entomol Soc Am. 2005; 98(4):587–594. doi:10.1603/0013-8746(2005)098[0587:Tuodmi]2.0. Co;2PMID:WOS:000230359800020.
11. Ekrem T, Stur E, Hebert PDN. Females do count: Documenting Chironomidae (Diptera) species diver-sity using DNA barcoding. Org Divers Evol. 2010; 10(5):397–408. doi:10.1007/s13127-010-0034-y PMID:WOS:000284364300004.
12. Silva FL, Wiedenbrug S. Integrating DNA barcodes and morphology for species delimitation in the Corynoneuragroup (Diptera: Chironomidae: Orthocladiinae). B Entomol Res. 2014; 104(1):65–78. doi:10.1017/S0007485313000515PMID:WOS:000332950800008.
13. Silva FL, Fonseca-Gessner AA, Ekrem T. A taxonomic revision of genusLabrundiniaFittkau, 1962 (Diptera: Chironomidae: Tanypodinae). Zootaxa. 2014; 3769(1):1–185. doi:10.11646/zootaxa.3769. 1.1PMID:WOS:000332070000001.
14. Stur E, Ekrem T. Exploring unknown life stages of Arctic Tanytarsini (Diptera: Chironomidae) with DNA barcoding. Zootaxa. 2011;(2743: ):27–39. PMID:WOS:000286330700002.
15. Silva FL, Ekrem T, Fonseca-Gessner AA. Out of South America: phylogeny of non-biting midges in the genusLabrundiniasuggests multiple dispersal events to Central and North America. Zool Scr. 2015; 44(1):59–71. doi:10.1111/Zsc.12089PMID:WOS:000346161200005.
16. Demin AG, Polukonova NV, Mugue NS. Molecular phylogeny and the time of divergence of minges (Chironomidae, Nematocera, Diptera) inferred from a partial nucleotide sequence of the cytochrome oxidase I gene (COI). Russ J Genet+. 2011; 47(10):1168–1180. doi:10.1134/S1022795411100061 PMID:WOS:000297849700004.
17. Sari A, Duran M, Sen A, Bardakci F. Investigation of Chironomidae (Diptera) relationships using mito-chondrial COI gene. Biochem Sys Ecol. 2015; 59(0):229–238. doi:10.1016/j.bse.2015.01.005 18. Armitage PD, Cranston PS, Pinder LCV. The Chironomidae: biology and ecology of non-biting
midges. London: Chapman & Hall; 1995. XII, 572 p.
19. Ali A, Majori G, Ceretti G, Dandrea F, Scattolin M, Ferrarese U. A chironomid (Diptera, Chironomidae) midge population study and laboratory evaluation of larvicides against midges inhabiting the Lagoon of Venice, Italy. J Am Mosquito Contr. 1985; 1(1):63–68. PMID:WOS:A1985AFX6500014. 20. Rosenberg D. Freshwater biomonitoring and Chironomidae. Neth J Aquat Ecol. 1992; 26(2–4):101–
122. doi:10.1007/BF02255231
21. Carew ME, Pettigrove VJ, Metzeling L, Hoffmann AA. Environmental monitoring using next generation sequencing: rapid identification of macroinvertebrate bioindicator species. Front Zool. 2013; 10. doi: 10.1186/1742-9994-10-45PMID:WOS:000322907500001.
22. Brodin Y, Ejdung G, Strandberg J, Lyrholm T. Improving environmental and biodiversity monitoring in the Baltic Sea using DNA barcoding of Chironomidae (Diptera). Mol Ecol Resour. 2013; 13(6):996–
1004. doi:10.1111/1755-0998.12053PMID:23280321.
24. Meier R, Wong W, Srivathsan A, Foo M. $1 DNA barcodes for reconstructing complex phenomes and finding rare species in specimen-rich samples. Cladistics. 2015:1–11. doi:10.1111/cla.12115
25. Edwards D, Horn A, Taylor D, Savolain V, Hawkins JA. DNA barcoding of a large genus,Aspalathus L. (Fabaceae). Taxon. 2008; 57(4):1317–1327. PMID:WOS:000261283000021.
26. Xu S, Li D, Li J, Xiang X, Jin W, Huang W, et al. Evaluation of the DNA barcodes inDendrobium (Orch-idaceae) from mainland Asia. Plos One. 2015; 10(1):e0115168. doi:10.1371/journal.pone.0115168 PMID:25602282; PubMed Central PMCID: PMC4300225.
27. Yan L, Liu J, Moller M, Zhang L, Zhang X, Li D, et al. DNA barcoding ofRhododendron(Ericaceae), the largest Chinese plant genus in biodiversity hotspots of the Himalaya-Hengduan Mountains. Mol Ecol Resour. 2014. doi:10.1111/1755-0998.12353PMID:25469426.
28. Epler JH, Ekrem T, Cranston PS. The larvae of Chironominae (Diptera: Chironomidae) of the Holarctic region–keys and diagnoses. In: Cederholm L, editor. Chironomidae of the Holarctic Region: Keys and Diagnoses, Part 1: Larvae. 66. Lund, Sweden: Insect Systematics and Evolution Supplements 2013. p. 387–556.
29. Wulp FM. Dipterologische aanteekeningen. Tijdschr Ent. 1874; 17:109–148.
30. Ekrem T. Diagnoses and immature stages of some AustralianTanytarsusvan der Wulp (Diptera: Chir-onomidae). Aust J Entomol. 2001; 40:312–325. doi:10.1046/j.1440-6055.2001.00246.xPMID: WOS:000179821100002.
31. Ekrem T. A Review of AfrotropicalTanytarsusVan Der Wulp (Diptera: Chironomidae). Tijdschr Ent. 2001; 144(1):5–40. doi:10.1163/22119434-99900054
32. Ekrem T. A review of selected south-and east AsianTanytarsusvd Wulp (Diptera: Chironomidae). Hydrobiologia. 2002; 474(1–3):1–39. doi:10.1023/A:1016527603086
33. Ekrem T. Immature stages of EuropeanTanytarsusspecies I. Theeminulus-,gregarius-,lugens- and mendaxspecies groups (Diptera, Chironomidae). Dtsch entomol Z. 2004; 51(1):97–146. doi:10. 1002/mmnd.20040510110PMID:WOS:000222263900009.
34. Ekrem T, Sublette MF, Sublette JE. North AmericanTanytarsusI. Descriptions and keys to species in theeminulus,gregarius,lugensandmendaxspecies groups (Diptera: Chironomidae). Ann Entomol Soc Am. 2003; 96(3):265–328. doi:10.1603/0013-8746(2003)096[0265:Natida]2.0.Co;2PMID: WOS:000183079900011.
35. Glover B. The Tanytarsini (Diptera, Chironomidae) of Australia. Aust J Zool Suppl Ser. 1973; 25:403–
478. doi:10.1071/AJZS023
36. Reiss F, Fittkau EJ. Taxonomie und Ökologie europäisch verbreiteterTanytarsus-Arten (Chironomi-dae, Diptera). Arch Hydrobiol Suppl. 1971; 40:75–200.
37. Sanseverino AM. A review of the genusTanytarsusvan der Wulp, 1874 (Insecta, Diptera, Chironomi-dae) from the Neotropical Region [Dissertation, LMU Munich]. München2006.
38. Price TD, Qvarnstrom A, Irwin DE. The role of phenotypic plasticity in driving genetic evolution. Proc Biol Sci. 2003; 270(1523):1433–1440. Epub 2003/09/11. doi:10.1098/rspb.2003.2372PMID: 12965006; PubMed Central PMCID: PMCPmc1691402.
39. McKie BG, Cranston PS. Size matters: systematic and ecological implications of allometry in the responses of chironomid midge morphological ratios to experimental temperature manipulations. Can J Zool. 2005; 83(4):553–568. doi:10.1139/z05-051
40. Saitou N, Nei M. The neighbor-joining method: a new method for reconstructing phylogenetic trees. Mol Bio Evol. 1987; 4(4):406–425.
41. Puillandre N, Lambert A, Brouillet S, Achaz G. ABGD, Automatic Barcode Gap Discovery for primary species delimitation. Mol Ecol. 2012; 21(8):1864–1877. doi:10.1111/j.1365-294X.2011.05239.x
PMID:WOS:000302616200008.
42. Pons J, Barraclough TG, Gomez-Zurita J, Cardoso A, Duran DP, Hazell S, et al. Sequence-based species delimitation for the DNA taxonomy of undescribed insects. Syst Biol. 2006; 55(4):595–609. PMID:16967577.
43. Fujisawa T, Barraclough TG. Delimiting Species Using Single-Locus Data and the Generalized Mixed Yule Coalescent Approach: A Revised Method and Evaluation on Simulated Data Sets. Syst Biol. 2013; 62(5):707–724. doi:10.1093/sysbio/syt033PMID:23681854
44. Fontaneto D, Flot J-F, Tang C. Guidelines for DNA taxonomy, with a focus on the meiofauna. Mar Bio-div. 2015:1–19. doi:10.1007/s12526-015-0319-7
45. Zhang J, Kapli P, Pavlidis P, Stamatakis A. A general species delimitation method with applications to phylogenetic placements. Bioinformatics. 2013; 29(22):2869–2876. doi:10.1093/bioinformatics/ btt499PMID:23990417
46. Meier R, Shiyang K, Vaidya G, Ng PK. DNA barcoding and taxonomy in Diptera: a tale of high intra-specific variability and low identification success. Syst Biol. 2006; 55(5):715–728. doi:10.1080/
10635150600969864PMID:17060194.
47. Ratnasingham S, Hebert PD. A DNA-based registry for all animal species: the barcode index number (BIN) system. Plos One. 2013; 8(7):e66213. doi:10.1371/journal.pone.0066213PMID:23861743; PubMed Central PMCID: PMC3704603.
48. Kekkonen M, Mutanen M, Kaila L, Nieminen M, Hebert PD. Delineating species with DNA barcodes: a case of taxon dependent method performance in moths. Plos One. 2015; 10(4):e0122481. doi:10. 1371/journal.pone.0122481PMID:25849083.
49. Hendrich L, Pons J, Ribera I, Balke M. Mitochondrial cox1 sequence data reliably uncover patterns of insect diversity but suffer from high lineage-idiosyncratic error rates. Plos One. 2010; 5(12):e14448. doi:10.1371/journal.pone.0014448PMID:21203427
50. Tänzler R, Sagata K, Surbakti S, Balke M, Riedel A. DNA barcoding for community ecology-how to tackle a hyperdiverse, mostly undescribed Melanesian fauna. Plos One. 2012; 7(1):e28832. doi:10. 1371/journal.pone.0028832PMID:22253699
51. Hawlitschek O, Nagy ZT, Berger J, Glaw F. Reliable DNA barcoding performance proved for species and island populations of comoran squamate reptiles. Plos One. 2013; 8(9):e73368. doi:10.1371/ journal.pone.0073368PMID:24069192
52. Ratnasingham S, Hebert PDN. BOLD: The Barcode of Life Data System (www.barcodinglife.org). Mol Ecol Notes. 2007; 7(3):355–364. doi:10.1111/j.1471-8286.2006.01678.xPMID:
WOS:000246244300001.
53. Ekrem T, Stur E. Description ofTanytarsus hjulorum, new species, with notes and DNA barcodes of some South AfricanTanytarsus(Diptera: Chironomidae). In: Andersen T, editor. Contributions to the systematics and ecology of aquatic Diptera. A tribute to Ole A. Sæther. Columbus, Ohio: Caddis Press; 2007. p. 87–92.
54. Giłka W, Paasivirta L. On the systematics of the tribe Tanytarsini (Diptera: Chironomidae)—three new species from Finland. Entomol Fennica. 2008; 19(1):41–48. PMID:WOS:000254116100006. 55. Giłka W, Paasivirta L. Evaluation of diagnostic characters of theTanytarsus chinyensisgroup (Diptera:
Chironomidae), with description of a new species from Lapland. Zootaxa. 2009;(2197: ):31–42. PMID:
WOS:000268906300003.
56. Langton PH.Micropsectra silvesteraen. sp andTanytarsus heliomesonyctiosn. sp., (Diptera: Chiro-nomidae), two parthenogenetic species from Ellesmere Island, Arctic Canada. J Kansas Entomol Soc. 1998; 71(3):208–215. PMID:WOS:000083304900003.
57. Lindeberg B. Taxonomy, biology and biometry ofTanytarsus curticornisKieff. andT.brundinin. sp. (Dipt., Chironomidae). Annls Zool Fennici. 1963; 29:118–130.
58. Lindeberg B. Sibling species delimitation in theTanytarsus lestageiaggregate Diptera, Chironomidae. Annls Zool Fennici. 1967; 4(1):45–86.
59. Moubayed Z. Chironomids from running waters of Thailand: description ofRheotanytarsus thailanden-sissp.n. andTanytarsus thaicussp.n. (Dipt., Chironomidae). Hydrobiologia. 1990; 203(1–2):29–33. doi:10.1007/BF00005610
60. Ree HI, Jeong KY. Fauna of non-biting midges (Diptera, Chironomidae) from Soyang River in Chuncheon-si, Gangwon-do, Korea. Korean J Syst Zool. 2010; 26(2):115–140. doi:10.5635/KJSZ. 2010.26.2.115
61. Sasa M, Kawai K. Studies on chironomid midges of Lake Biwa (Diptera, Chironomidae): Lake Biwa Research Institute, Otsu, Japan; 1987. 119 p.
62. Sasa M, Suzuki H, Sakai T. Studies on the chironomid midges collected on the shore of Shimanto River in April, 1998. Part 1. Description of species of the subfamily Chironominae. Trop Med. 1998; 40 (2):47–89.
63. Sasa M, Suzuki H. Stuidies on the chironomid species collected on Ishigaki and Iriomote Islands, Southwestern Japan. Trop Med. 2000; 42(1):1–37.
64. Sublette JE, Sasa M. Chironomidae collected in onchocerciasis endemic areas of Guatemala (Insecta, Diptera). Spixiana Suppl. 1994; 20.
65. Kimura M. A simple method for estimating evolutionary rates of base substitutions through compara-tive studies of nucleotide sequences. J Mol Evol. 1980; 16(2):111–120. Epub 1980/12/01. PMID: 7463489.
67. Folmer O, Black M, Hoeh W, Lutz R, Vrijenhoek R. DNA primers for amplification of mitochondrial cytochrome c oxidase subunit I from diverse metazoan invertebrates. Mol Mar Biol Biotechnol. 1994; 3(5):294–299. PMID:7881515.
68. Maddison WP, Maddison DR. Mesquite: a modular system for evolutionary analysis 2.5 ed. 2008. 69. Edgar RC. MUSCLE: multiple sequence alignment with high accuracy and high throughput. Nucleic
Acids Res. 2004; 32(5):1792–1797. doi:10.1093/Nar/Gkh340PMID:WOS:000220487200025. 70. Tamura K, Stecher G, Peterson D, Filipski A, Kumar S. MEGA6: Molecular Evolutionary Genetics
Analysis version 6.0. Mol Biol Evol. 2013; 30(12):2725–2729. doi:10.1093/molbev/mst197PMID: 24132122; PubMed Central PMCID: PMC3840312.
71. Drummond AJ, Suchard MA, Xie D, Rambaut A. Bayesian phylogenetics with BEAUti and the BEAST 1.7. Mol Bio Evol. 2012; 29(8):1969–1973. Epub 2012/03/01. doi:10.1093/molbev/mss075PMID: 22367748; PubMed Central PMCID: PMCPmc3408070.
72. Rambaut A, Suchard MA, Xie D, Drummond AJ. Tracer v1.6, Available:http://beast.bio.ed.ac.uk/ Tracer. 2014.
73. Ezard T, Fujisawa T, Barraclough T. Splits: SPecies’LImits by Threshold Statistics, R package ver-sion 1.0-11/r29. 2009.
74. Team RC. R: A language and environment for statistical computing. R Foundation for Statistical Com-puting, Vienna, Austria, 2012. ISBN 3-900051-07-0; 2014.
75. Stamatakis A. RAxML-VI-HPC: maximum likelihood-based phylogenetic analyses with thousands of taxa and mixed models. Bioinformatics. 2006; 22(21):2688–2690. PMID:16928733
76. Silvestro D, Michalak I. raxmlGUI: a graphical front-end for RAxML. Org Divers Evol. 2012; 12 (4):335–337. doi:10.1007/s13127-011-0056-0
77. Lopez JV, Yuhki N, Masuda R, Modi W, O'Brien SJ. Numt, a recent transfer and tandem amplification of mitochondrial DNA to the nuclear genome of the domestic cat. J Mol Evol. 1994; 39(2):174–190. Epub 1994/08/01. PMID:7932781.
78. Bensasson D, Zhang D, Hartl DL, Hewitt GM. Mitochondrial pseudogenes: evolution's misplaced wit-nesses. Trends Ecol Evol. 2001; 16(6):314–321. Epub 2001/05/23. PMID:11369110.
79. Richly E, Leister D. NUMTs in sequenced eukaryotic genomes. Mol Biol Evol. 2004; 21(6):1081–
1084. Epub 2004/03/12. doi:10.1093/molbev/msh110PMID:15014143.
80. Smith MA, Bertrand C, Crosby K, Eveleigh ES, Fernandez-Triana J, Fisher BL, et al.Wolbachiaand DNA Barcoding Insects: Patterns, Potential, and Problems. Plos One. 2012; 7(5):e36514. doi:10. 1371/journal.pone.0036514PMID:22567162
81. Ballard JWO, Whitlock MC. The incomplete natural history of mitochondria. Mol Ecol. 2004; 13 (4):729–744. PMID:WOS:000220153000002.
82. Heckman KL, Mariani CL, Rasoloarison R, Yoder AD. Multiple nuclear loci reveal patterns of incom-plete lineage sorting and complex species history within western mouse lemurs (Microcebus). Mol Phylogenet Evol. 2007; 43(2):353–367. doi:10.1016/j.ympev.2007.03.005PMID:
WOS:000246918800001.
83. Willyard A, Cronn R, Liston A. Reticulate evolution and incomplete lineage sorting among the ponder-osa pines. Mol Phylogenet Evol. 2009; 52(2):498–511. doi:10.1016/j.ympev.2009.02.011PMID: WOS:000266693400021.
84. Gay L, Neubauer G, Zagalska-Neubauer M, Debain C, Pons JM, David P, et al. Molecular and mor-phological patterns of introgression between two large white-headed gull species in a zone of recent secondary contact. Mol Ecol. 2007; 16(15):3215–3227. doi:10.1111/j.1365-294X.2007.03363.x PMID:WOS:000248847600013.
85. Martinsen GD, Whitham TG, Turek RJ, Keim P. Hybrid populations selectively filter gene introgression between species. Evolution. 2001; 55(7):1325–1335. Epub 2001/08/30. PMID:11525457.
86. Collins RA, Cruickshank RH. The seven deadly sins of DNA barcoding. Mol Ecol Resour. 2013; 13 (6):969–975. doi:10.1111/1755-0998.12046PMID:23280099.
87. DeSalle R, Egan MG, Siddall M. The unholy trinity: taxonomy, species delimitation and DNA barcod-ing. Philos Trans R Soc Lond B Biol Sci. 2005; 360(1462):1905–1916. doi:10.1098/rstb.2005.1722 PMID:16214748; PubMed Central PMCID: PMC1609226.
88. Turney S, Cameron ER, Cloutier CA, Buddle CM. Non-repeatable science: assessing the frequency of voucher specimen deposition reveals that most arthropod research cannot be verified. PeerJ. 2015; 3:e1168. doi:10.7717/peerj.1168PMID:26339546
89. Resch MC, Shrubovych J, Bartel D, Szucsich NU, Timelthaler G, Bu Y, et al. Where taxonomy based on subtle morphological differences is perfectly mirrored by huge genetic distances: DNA barcoding
in Protura (Hexapoda). Plos One. 2014; 9(3). doi:10.1371/journal.pone.0090653PMID: WOS:000332485800041.
90. Huemer P, Karsholt O, Mutanen M. DNA barcoding as a screening tool for cryptic diversity: an exam-ple fromCaryocolum, with description of a new species (Lepidoptera, Gelechiidae). ZooKeys. 2014; (404: ):91–111. doi:10.3897/zookeys.404.7234PMID:WOS:000339974500001.
91. Lukhtanov VA, Sourakov A, Zakharov EV, Hebert PD. DNA barcoding Central Asian butterflies: increasing geographical dimension does not significantly reduce the success of species identification. Mol Ecol Resour. 2009; 9(5):1302–1310. doi:10.1111/j.1755-0998.2009.02577.xPMID:21564901. 92. Bergsten J, Bilton DT, Fujisawa T, Elliott M, Monaghan MT, Balke M, et al. The effect of geographical
scale of sampling on DNA barcoding. Syst Biol. 2012; 61(5):851–869. doi:10.1093/sysbio/sys037 PMID:22398121; PubMed Central PMCID: PMC3417044.
93. Meyer CP, Paulay G. DNA barcoding: error rates based on comprehensive sampling. PLoS Biol. 2005; 3(12):e422. doi:10.1371/journal.pbio.0030422PMID:16336051; PubMed Central PMCID: PMC1287506.
94. Webb JM, Jacobus LM, Funk DH, Zhou X, Kondratieff B, Geraci CJ, et al. A DNA barcode library for North American Ephemeroptera: progress and prospects. Plos One. 2012; 7(5):e38063. doi:10.1371/ journal.pone.0038063PMID:22666447; PubMed Central PMCID: PMC3364165.
95. Zhou X, Jacobus LM, DeWalt RE, Adamowicz SJ, Hebert PDN. Ephemeroptera, Plecoptera, and Tri-choptera fauna of Churchill (Manitoba, Canada): insights into biodiversity patterns from DNA barcod-ing. J N Am Benthol Soc. 2010; 29(3):814–837. doi:10.1899/09-121.1PMID:
WOS:000280692400004.
96. Schmidt S, Schmid-Egger C, Morinière J, Haszprunar G, Hebert PDN. DNA barcoding largely
sup-ports 250 years of classical taxonomy: identifications for Central European bees (Hymenoptera, Apoi-deapartim). Mol Ecol Resour. 2015:n/a-n/a.
97. Zahiri R, Lafontaine JD, Schmidt BC, Dewaard JR, Zakharov EV, Hebert PD. A transcontinental chal-lenge—a test of DNA barcode performance for 1,541 species of Canadian Noctuoidea (Lepidoptera). Plos One. 2014; 9(3):e92797. doi:10.1371/journal.pone.0092797PMID:24667847; PubMed Central PMCID: PMC3965468.
98. Hajibabaei M, Janzen DH, Burns JM, Hallwachs W, Hebert PDN. DNA barcodes distinguish species of tropical Lepidoptera. PNAS. 2006; 103(4):968–971. doi:10.1073/pnas.0510466103PMID: WOS:000234938300025.
99. Park DS, Foottit R, Maw E, Hebert PDN. Barcoding bugs: DNA-based Identification of the true bugs (Insecta: Hemiptera: Heteroptera). Plos One. 2011; 6(4). doi:10.1371/journal.pone.0018749PMID: WOS:000289578600029.
100. Raupach MJ, Hendrich L, Kuchler SM, Deister F, Moriniere J, Gossner MM. Building-up of a DNA bar-code library for true bugs (Insecta: Hemiptera: Heteroptera) of Germany reveals taxonomic uncertain-ties and surprises. Plos One. 2014; 9(9):e106940. doi:10.1371/journal.pone.0106940PMID: 25203616; PubMed Central PMCID: PMC4159288.
101. Monaghan MT, Balke M, Gregory TR, Vogler AP. DNA-based species delineation in tropical beetles using mitochondrial and nuclear markers. Philos Trans R Soc Lond B Biol Sci. 2005; 360
(1462):1925–1933. PMID:16214750
102. Nzelu CO, Caceres AG, Arrunategui-Jimenez MJ, Lanas-Rosas MF, Yanez-Trujillano HH, Luna-Caipo DV, et al. DNA barcoding for identification of sand fly species (Diptera: Psychodidae) from leish-maniasis-endemic areas of Peru. Acta Trop. 2015; 145:45–51. doi:10.1016/j.actatropica.2015.02. 003PMID:25697864.
103. Renaud AK, Savage J, Adamowicz SJ. DNA barcoding of Northern Nearctic Muscidae (Diptera) reveals high correspondence between morphological and molecular species limits. BMC ecology. 2012; 12:24. doi:10.1186/1472-6785-12-24PMID:23173946; PubMed Central PMCID: PMC3537539.
104. Sinclair CS, Gresens SE. Discrimination ofCricotopusspecies (Diptera: Chironomidae) by DNA bar-coding. B Entomol Res. 2008; 98(6):555–563. doi:10.1017/S0007485308005865PMID:
WOS:000261616300003.