Comissão 1.1 – Gênese e morfologia do solo
BOuNDAry BETwEEN SOIL AND SAPrOLITE IN ALISOLS IN
ThE SOuTh Of BrAzIL
fabrício de Araújo Pedron(1)*, rodrigo Bomicieli de Oliveira(2), ricardo Simão Diniz Dalmolin(1), Antonio Carlos de Azevedo(3) and ricardo Vargas Kilca(4)
(1) Universidade Federal de Santa Maria, Departamento de Solos, Santa Maria, Rio Grande do Sul, Brasil.
(2) Empresa de Assistência Técnica e Extensão Rural do Estado de Rio Grande do Sul, Cerro Branco, Rio Grande do Sul, Brasil. (3) Universidade de São Paulo, Departamento de Ciência do Solo, Piracicaba, São Paulo, Brasil.
(4) Universidade do Estado de Santa Catarina, Programa de Pós-graduação em Dendrologia e Fitossociologia, Lages, Santa Catarina, Brasil.
* Corresponding author. E-mail: fapedron@ufsm.br
ABSTrACT
Despite numerous studies conducted on the lower limit of soil and its contact with saprolite layers, a great deal of work is left to standardize identification and annotation of these variables in the field. In shallow soils, the appropriately noting these limits or contacts is essential for determining their behavior and potential use. The aims of this study were to identify and define the field contact and/or transition zone between soil and saprolite in profiles of an Alisol derived from fine sandstone and siltstone/claystone in subtropical southern Brazil and to subsequently validate the field observations through a multivariate analysis of laboratory analytical data. In the six Alisol profiles evaluated, the sequence of horizons found was A, Bt, C, and Cr, where C was considered part of the soil due to its pedogenetic structure, and Cr was considered saprolite due to its rock structure. The morphological properties that were determined in the field and that were different between the B and C horizons and the Cr layer were color, structure, texture, and fragments of saprolite. According to the test of means, the properties that support the inclusion of the C horizon as part of the soil are sand, clay, water-dispersible clay, silt/clay ratio, macroporosity, total porosity, resistance to penetration, cation exchange capacity, fe extracted by DCB, Al, h+Al, and cation exchange capacity of clay. The properties that support the C horizon as a transition zone are silt, Ca, total organic C, and fe extracted by ammonium oxalate. Discriminant analysis indicated differences among the three horizons evaluated.
Keywords: pedology, soil classification, soil morphology, pedometrics.
INTrODuCTION
The Alisol class in the international soil
classification of the “World Reference Base for Soil
Resources” (FAO), is characterized by the presence of an argillic horizon that has a cation exchange
capacity (CEC) value of 24 cmolc kg-1 clay or greater,
associated with base saturation of less than 50 % in
most of the argillic horizon (IUSS Working Group WRB, 2014). The WRB Alisols are mainly included in the “Argissolo” classes of the Brazilian Soil Classification System (SiBCS), according to Embrapa
(2013), and are considered a broadly distributed soil with intermediate agricultural potential.
The effective soil depth in Alisols is not generally a limiting factor for agricultural use since the depth usually exceeds 150 cm. However, in imperfectly drained soils developed from fine sediments,
such as fine sandstone and siltstone/claystone in
southern Brazil, soil vertical development is less, reaching depths of approximately 60 to 100 cm (Pedron et al., 2012). Thus, the contact or transition zone between soil and saprolite is more important. In soils developed from sandstone parent materials, thinness of the soil requires proper management to prevent environmental damage to the aquifer.
Stolt and Baker (1994) considered identification
of the boundary between soil and saprolite as a complex task due to the diversity of processes that modify the transition from rock to soil. Studies
published by Lietzke and Weber (1981), O’Brien
and Buol (1984), Rice et al. (1985), Stolt et al. (1991, 1992), Schoeneberger et al. (1995), and
Stolt and Baker (1994) define “C” as a saprolite horizon. When saprolite maintains a rock structure, it is denominated “Cr”. The most widely used
soil classification systems and morphological guides in Brazil and around the world, such as Schoeneberguer et al. (2012), Embrapa (2013), Santos et al. (2013), USDA (2014), and the IUSS
Working Group WRB (2014), follow the same
idea, but they separate the C horizon and layer,
designating saprolite as the “C layer”.
According to Stolt et al. (1991) and O’Brien and
Buol (1984), in some situations, the advanced stage
of modification results in a C horizon structure with
greater similarity to soil than to rock. In this case, due to evidence of the pedogenesis structure, authors such
as Pedron et al. (2009, 2010, 2011) classified the C
horizon as part of the soil, differing from a Cr layer that represents saprolite at different stage of alteration, but always with the structure of the parent rock.
The same situation has been observed in Alisols
of southern Brazil, where it is very common to find
a horizon that has a pedogenetic structure, differing from the saprolite layer (Cr) and also from the B
horizon. This has been named the “C horizon”, and it is not contemplated in field morphological guides, which only mention the “C horizon”that is little
affected or unaffected by pedogenic processes or with strong gleying (Santos et al., 2013; USDA, 2014).
The horizons/layers designated as C and/or Cr, when located near the surface, play a critical role in the environment (Schafer et al., 1979;
Lietzke and Weber, 1981). However, in many soil
surveys, these layers are not adequately described
(Tandarich et al., 1994), and the field soil description
guides (Schoeneberger et al., 2012; Santos et al., 2013) do not clearly state the procedures for identification of the soil-saprolite boundary. This may lead to an incomplete description that compromises evaluation of land use potential.
rESuMO: Limite entre SoLo e SaproLito em argiSSoLoS no SuL do BraSiL
apesar de vários estudos abordando o limite inferior do solo e o seu contato com a camada saprolítica,
ainda existem demandas referentes à padronização da identificação e anotação dessas variáveis no
campo. em solos rasos, a anotação correta desses limites ou contatos é essencial para determinar o seu
comportamento e potencial de uso. Os objetivos deste estudo foram identificar e definir o contato e, ou, zona de transição entre solo e saprolito em perfis de Argissolos derivados de arenito fino e siltito argiloso
em ambiente subtropical no sul do Brasil e, subsequentemente, validar as observações de campo pelas
análises multivariadas de dados obtidos no laboratório. Nos seis perfis avaliados, a sequência de horizontes encontrada foi A, Bt, C e Cr, onde C foi considerado parte do solo, em razão da sua estrutura pedogênica; e Cr, saprolito, por causa da estrutura de rocha. Os atributos morfológicos que foram determinados no campo e se evidenciaram diferentes entre os horizontes B e C e a camada Cr foram: cor, estrutura, textura e fragmentos de saprolito. De acordo com o teste de médias, os atributos que suportam a inclusão do horizonte C como parte do solo foram: areia, argila, argila dispersa em água, relação silte/argila, macroporosidade, porosidade total, resistência a penetração, capacidade de troca de cátions, ferro extraído com DCB, Al, H+Al e atividade da argila. Os atributos que suportam o horizonte C como uma zona de transição foram: silte, Ca, C orgânico total e Fe extraído com oxalato de amônio. A análise discriminante indicou diferenças entre os três horizontes avaliados (B, C e Cr).
The aims of this study were to identify and define the field contact and/or transition zone between soil and saprolite in the Alisols derived from fine
sandstone and clayey siltstone in subtropical southern Brazil for the purpose of contributing to knowledge of the horizons that make up
this contact/transition area. Subsequently, field
observations and laboratory data were validated through multivariate analysis, highlighting the soil properties that might help pedologists in identifying
those horizons and layers in the field.
MATErIAL AND METhODS
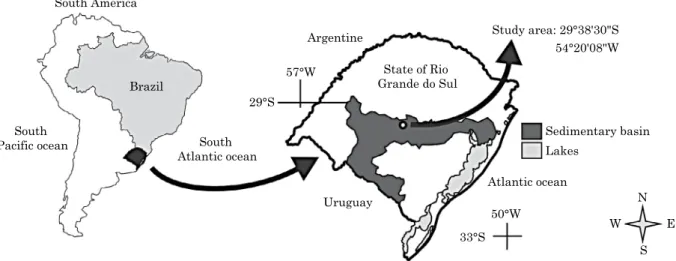
The area under study is in the central region of the State of Rio Grande do Sul (RS), Brazil, in the municipalities of São Pedro do Sul and Santa Maria (Figure 1). The altitude ranges from 132 to 160 m a.s.l, with a predominantly softly undulating to undulating relief. The geology of the area is dominated by sedimentary rocks of the Sanga do Cabral Formation, which consists
of fine sandstones, subarcosians to arcosians, and
the Santa Maria Formation (Alemoa member) composed of clayey siltstones, both in the presence of carbonate concretions (Sartori, 2009). The climate is Cfa - humid subtropical without a dry season with an average annual rainfall of 1,708 mm and an average annual temperature of 19.2 °C (Maluf, 2000).
Table 1 provides landscape data and soil classification according to the Brazilian Soil Classification System (Embrapa, 2013) and the
WRB - IUSS/FAO (IUSS Working Group WRB, 2014).The six profiles, identified as P1 to P6, were
sampled in natural pasture areas, and all of the soils had shallow depth and somewhat poor drainage.
The landscape characteristics and morphology of
the profiles were evaluated according to the field
description guides of Schoeneberguer et al. (2012) and Santos et al. (2013). The contacts/transitions between
soil and saprolite were initially identified in the field through observation of the structure, color, and
volume of fragments of the altered parent material.
The particle size distribution of the fine earth
fraction (<2 mm) was determined by the pipette method as described in Donagema et al. (2011),
using 1mol L-1 naOH as the chemical dispersant.
Water-dispersible clay (WD clay) was determined
by the same method without the use of a chemical dispersant. The particle size distribution of the coarse fraction (>2 mm), performed by dry sieving,
the silt-to-clay ratio, the degree of flocculation (DG),
and hydraulic conductivity (Ks) were all calculated according to Donagema et al. (2011).
After the values of Ks were determined, macroporosity, microporosity, and bulk density were measured in the same samples. The water contents corresponding to the saturation point and water tension of 6kPa were assumed to be equal to total porosity (TP) and microporosity, respectively. Macroporosity was determined by the difference between total porosity and microporosity, and bulk density (BD) was obtained by the ratio of
the mass of dry matter (kg) and its volume (dm3)
(Donagema et al., 2011).
Resistance to penetration (RP) was determined using an impact penetrometer with a conical tip at
a 30° angle. The final values of RP were obtained using Holland’s equations, suggested by Stolf (1991).
The water-stable aggregates were analyzed in undisturbed soil samples collected in each horizon and
layer of the six profiles. The procedure followed the
proposal of Kemper and Chepil (1965). The fraction
South America
South Atlantic ocean South
Pacific ocean
Brazil
29°S 57°W
33°S 50°W
N
W E
S 54°20'08"W Study area: 29°38'30"S Argentine
Uruguay
State of Rio Grande do Sul
Lakes
Sedimentary basin
Atlantic ocean
that passed through the 8-mm sieve and was retained in the 4.76-mm sieve was used to calculate the percentages of water-stable aggregates >2 and <2 mm.
Chemical analyses were performed on the fine
earth fraction (<2 mm). The pH was determined in water using the soil:water ratio of 1:2.5. Calcium and Mg contents were determined by atomic absorption spectrophotometry (AAS) after extraction with a
1.0 mol L-1 KCl solution. Exchangeable sodium was
extracted with 0.05 mol L-1 HCl and determined
by flame photometry. Potential acidity (H+Al)
was determined in extracts of 1.0 mol L-1 (pH 7.0)
Ca(OAc)2 and titrated with 0.0606 mol L-1 naOH.
Exchangeable Al was extracted with 1.0 mol L-1
KCl solution and titrated with 0.025 mol L-1 naOH.
Total organic carbon (TOC) was determined by wet
oxidation with 0.4 mol L-1 K
2Cr2O7 and titrated with
0.1 mol L-1 Fe(nH
4)2.(SO4)2. These analyses followed
the procedures of Donagema et al. (2011).
From the analytical data, the potential cation exchange capacity of the soil (CEC) was calculated by the sum of bases (Ca+Mg+K+na) and H+Al, and clay reactivity (Tclay) was calculated by (CEC × 100)/% clay, as proposed by Donagema et al. (2011).
The soil samples were also subjected to
extraction of Fe with H2SO4 concentrate in the
ratio 1:1 (Donagema et al., 2011), with tribasic sodium dithionite, sodium citrate dihydrate, and sodium bicarbonate (DCB) (Mehra and Jackson,
1960), and with a 0.2 mol L-1 ammonium oxalate
(AO) solution in acid medium (pH 3.0) in the dark (McKeague and Day, 1966). The Fe concentration
in the H2SO4, the DCB, and the AO extracts were
determined by AAS.
Chemical dissolutions were performed on the
samples of fine earth to determine the K content,
according to Jackson et al. (1986). Exchangeable K (Kex)
contents were estimated using the Mehlich-1 extractant (0.05 mol L-1 HCl + 0.025 mol L-1 H
2SO4) and the levels
of non-exchangeable K (Kst) were estimated by the
1.0 mol L-1 HnO
3 method adapted by Melo et al. (2000).
Initially, chemical and physical soil properties were evaluated through the values of average and standard deviation in each horizon/layer, and then
the differences of each property were evaluated using a one-way AnOVA test, followed by the Tukey
test (p≤0.05) or Dunnett T3 test (p≤0.05) when the data showed a non significant or significant
heterogeneity, respectively, by the Levene test
(p≤0.01). The Kolmogorov-Smirnov test (p≤0.05) was
used to verify the normality of the data.
To conduct the Fisher multiple discriminant analysis (MDA), the database was standardized using the procedure of mean=0 and standard deviation=1(Manly, 2005). Two MDAs were run using all of the independent variables (chemical and physical), and two MDAs were run using
independent variables selected by the Wilks Lambda test (λ) and the F statistic (Brown and Wicker, 2000). All of the calculations for obtaining
discriminant analysis phases can be found in Manly (2005). SPSS 13.0 software was used for discriminant analysis.
rESuLTS
The sequence of the horizons and layers was A,
E, Bt, C, and Cr for the P3 and P4 profiles and A, Bt, C, and Cr for the P1, P2, P5, and P6 profiles
(data from the A and E horizons not shown). The
profiles showed depths ranging from 90 to 118 cm
from the top of the A horizon to the upper limit of the Cr layer. Color changes occurred mainly with increasing depths, varying from red to yellow. The horizons showed clear and abrupt boundaries, with horizontal boundaries ranging from smooth to irregular to wavy (Table 2).
The moist consistency ranged from firm in the
Bt horizons to friable in the C horizon and Cr
layerin the profiles derived from Clayey siltstone. In the profiles derived from fine sandstone, the moist consistency in Bt was predominantly firm to friable, and very firm to extremely firm in C and Cr. As for wet consistency, in the profiles derived from fine sandstone, sticky and plastic conditions
predominated for the Bt horizons, and non plastic and non sticky for the Cr layers.
Table 1. Environmental characterization and taxonomic classification of the soil profiles
Profile relief(1) Parent material(2) Brazilian classification(3) WRB classification(4)
P1 SU CS PBACa abrúptico Hyperalic Alisol (abruptic)
P2 U CS PBACa típico Haplic Alisol
P3 SU FS PBACa abrúptico Umbric Alisol (abruptic)
P4 SU FS PBACa abrúptico Hyperalic Umbric Alisol (abruptic)
P5 SU FS PBACa típico Umbric Alisol
P6 SU FS PBACa típico Umbric Alisol
(1) Relief: SU - softly undulating (3-8 %); U - undulating (8-20 %). (2) Parent Material: CS - clayey siltstones (Sanga do Cabral Formation);
FS - fine sandstone (Santa Maria Formation). (3) Embrapa (2013); PBACa: Argissolo Bruno-Acinzentado alítico (Embrapa, 2013).
The presence of red fragments, vestiges of saprolite in the B and C horizons, ranged from 5 to 25 %, while in the Cr, the values ranged from 70 to 90 %. The size of the fragments also increased with
depth in the profile. The quantity of roots ranged
from many to few in the Bt and C horizons, and were rare in the Cr. The predominant structures were angular and subangular blocks in the Bt horizons; and angular to massive blocks, typical of
a geogenic structure, in the Cr layers (Table 2). The C horizons showed an intermediate morphology of predominating angular blocks.
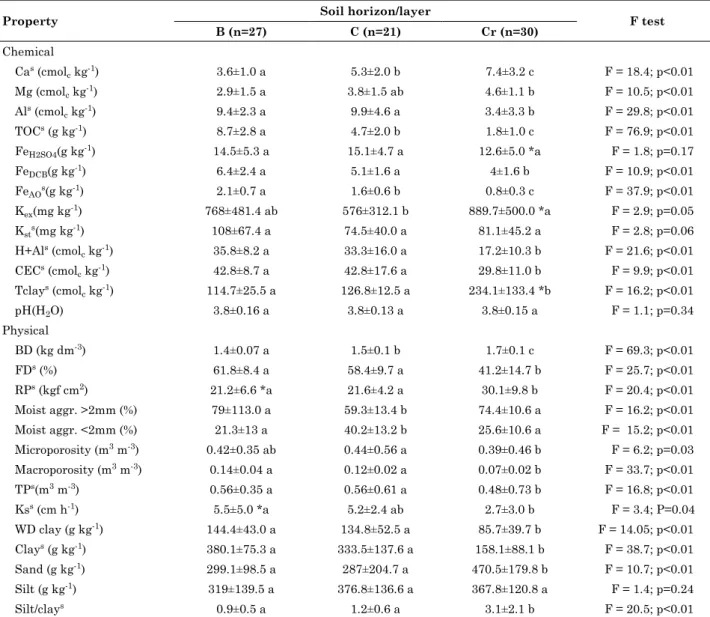
Analysis of variance for the chemical variables
(Table 3) showed significant differences among the
three horizons/layers (B, C and Cr) for TOC, Ca, and
FeAO. The averages of the Cr layers differed from
those of the other horizons (B and C) for Al, H+Al,
Table 2. Morphological data of the Alisol profiles
hL(1) Depth Moist color
(matrix)
horizon boundary(2)
Consistency(3)
Saprolite
fragments Structure
(4) Textural
class moist wet
cm % Ø mm
Profile 1 - Hyperalic Alisol (abruptic)
Bt1 15-27 10yR 3.5/3 cl/sm f/fr vp/vs 8 2-8 as/me/m clay
Bt2 27-43/53 10yR 3.5/2 cl/sm f vp/vs 8 2-8 as/oe/ms clay
C 43/53-65 10yR 4.5/3 cl/sm f/fr vp/vs 15 2-12 ac/e/mw clay loam C/Cr 65-90/110 10yR 6/1.5 cl/ir f/fr vp/vs 25 2-12 a/ve/ms clay loam
Cr 90/110-180+ 2.5yR 4/8 - f/fr mp/ms 70 15-55 apc/vm/mw loam
Profile 2 - Haplic Alisol
Bt1 20-35 7.5yR 3.5/2 cl/wa vf/ef vp/vs 5 1-10 as/oe/s clay loam
Bt2 35-52 7.5yR 3.5/2 cl/sm f/fr vp/vs 5 1-10 as/oe/m clay
C1 52-67 2.5yR 6.5/1 abr/sm f mp/ms 8 1-5 a/oe/mw clay
C2 67-95 2.5yR 6.5/1 cl/sm f vp/vs 10 1-10 a/oe/mw siltclay
Cr 95-180+ 2.5yR 4/8 - eh/f mp/ms 80 15-50 a/me/mw silt clay loam
Profile 3 - Umbric Alisol (abruptic)
Bt 63-88/93 7.5yR 4.5/2 cl/ir f vp/vs 12 1-5 a/oe/m clayloam
C 88/93-98/105 7.5yR 6/1 abr/ir f mp/ms 15 1-5 as/om/mw sandclay C/Cr 98/105-110/130 7.5yR 6/1 abr/ir f mp/ms 23 20-100 am/om/mw loam
Cr 130-170+ 2.5yR 4/8 - f np/ns 90 50-200 m/of/w loamysand
Profile 4 - Hyperalic Umbric Alisol (abruptic)
Bt 55/60-85/90 7.5yR 3/2 cl/wa f/fr vp/vs 10 1-10 ac/om/mw clay CB 85/90-100 7.5yR 6/4 cl/wa f sp-np/ss-ns 20 1-20 as/o/m sandy loam Cr/C 100-115/125 7.5yR 6/4 cl/wa f sp-np/ss-ns 50 15-100 am/vm/s sandyloam Cr 115/125-170+ 2.5yR 4/8 - f sp-np/ss 70 30-200 m/vm/s sandyloam
Profile 5 - Umbric Alisol
Bt 25/35-47 7.5yR 4.5/4 abr/sm f/fr sp/ms 5 2-8 as/oe/ms siltclayloam
BC 47-66 7.5yR 5/5 cl/sm vf sp/ss 8 2-5 ap/of/m siltclayloam
C 66-85/105 7.5yR 6.5/2 cl/ir ef sp-np/ss 15 2-5 ac/of/ms loam
Cr1 85/105-120 2.5yR 4/8 cl/ir ef np/ns 70 10-100 am/vm/s loam
Cr2 120-180+ 2.5yR 4/8 - ef np/ns 85 50-200 m/vo/s sandyloam
Profile 6 - Umbric Alisol
Bt 53-68/76 7.5yR 5/4 cl/wa f mp/ms 12 2-15 as/oe/ms clayloam
C 68/76-115/130 7.5yR 5/4 cl/wa vf/ef sp-mp/ss-ms 25 15-40 ap/oe/ms clayloam Cr 115/130-210+ 2.5yR 4/8 - vf/ef np/ns 90 15-40 am/o/s sandyloam (1) HL: profile horizons/layers; (2) cl: clear, sm: smooth, abr: abrupt, ir: irregular, wa: wavy; (3) f: firm, fr: friable, vf: very firm,
ef: extremely firm, eh: extremely hard, vp: very plastic, mp: moderately plastic, sp: slightly plastic, np: nonplastic, vs: very sticky,
ms: moderately sticky, ss: slightly sticky, ns: nonsticky; (4) Structure - ab: angular blocks, sab: subangular blocks, p: prismatic,
c: columnar, m: massive, c: coarse, vc: very coarse, m: medium, vf: very fine, f: fine, mo: moderate, st: strong, wk: weak. Structure
(Form/Size/Resistance) - Form: a-angular, s-subangular, p-prismatic, c-colunar, m-massive; Size: v-very coarse, o-coarse, m-medium,
CEC, Tclay, and FeDCB. For the Mg variable, the B horizon differed from the Cr layer, while the C horizon was not different from the other horizons. For the
variable Kex, the C horizon differed from Cr, while
the B horizon was similar to the other horizons. For the physical variables, AnOVA reported
significant differences among the three horizons only for BD. The Cr horizon differed significantly from the B and C horizons for seven variables (sand, WD clay,
clay, macroporosity, RP, TP, and Ks). The C horizon differed from the others for aggregates >2 mm, while the C horizon differed from Cr for microporosity. There were no differences in the silt averages.
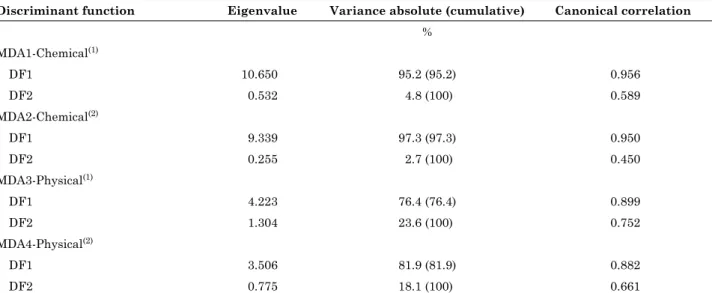
The multiple discriminant models performed for the chemical properties (MDA1 and MDA2)
generated similar results. The main discriminant functions (FD1) had high Eigenvalues, explaining the percentage of variance (greater than 95 % power of discrimination between groups) (Table 4). For the physical property models, MDA4 had higher
variation, explained by its first Eigenvalue (81.9 %
power of discrimination between the groups) than that of MDA3 (76.4 %). The physical and chemical properties selected may have good discriminatory potential due to the high correlations for the canonical discriminant functions with the properties in all four models.
In MDA2, the stepwise method indicated that
six of the 13 chemical properties best classified the
soil layers. The properties that contributed most to
Table 3. Average, standard deviation, and ANOVA test of the soil chemical and physical properties
Property Soil horizon/layer f test
B (n=27) C (n=21) Cr (n=30)
Chemical Cas (cmol
c kg-1) 3.6±1.0 a 5.3±2.0 b 7.4±3.2 c F = 18.4; p<0.01 Mg (cmolc kg-1) 2.9±1.5 a 3.8±1.5 ab 4.6±1.1 b F = 10.5; p<0.01 Als (cmol
c kg-1) 9.4±2.3 a 9.9±4.6 a 3.4±3.3 b F = 29.8; p<0.01 TOCs (g kg-1) 8.7±2.8 a 4.7±2.0 b 1.8±1.0 c F = 76.9; p<0.01 FeH2SO4(g kg-1) 14.5±5.3 a 15.1±4.7 a 12.6±5.0 *a F = 1.8; p=0.17 FeDCB(g kg-1) 6.4±2.4 a 5.1±1.6 a 4±1.6 b F = 10.9; p<0.01 FeAOs(g kg-1) 2.1±0.7 a 1.6±0.6 b 0.8±0.3 c F = 37.9; p<0.01 Kex(mg kg-1) 768±481.4 ab 576±312.1 b 889.7±500.0 *a F = 2.9; p=0.05 Ksts(mg kg-1) 108±67.4 a 74.5±40.0 a 81.1±45.2 a F = 2.8; p=0.06 H+Als (cmol
c kg-1) 35.8±8.2 a 33.3±16.0 a 17.2±10.3 b F = 21.6; p<0.01 CECs (cmol
c kg-1) 42.8±8.7 a 42.8±17.6 a 29.8±11.0 b F = 9.9; p<0.01 Tclays (cmol
c kg-1) 114.7±25.5 a 126.8±12.5 a 234.1±133.4 *b F = 16.2; p<0.01
pH(H2O) 3.8±0.16 a 3.8±0.13 a 3.8±0.15 a F = 1.1; p=0.34
Physical
BD (kg dm-3) 1.4±0.07 a 1.5±0.1 b 1.7±0.1 c F = 69.3; p<0.01 FDs (%) 61.8±8.4 a 58.4±9.7 a 41.2±14.7 b F = 25.7; p<0.01 RPs (kgf cm2) 21.2±6.6 *a 21.6±4.2 a 30.1±9.8 b F = 20.4; p<0.01 Moist aggr. >2mm (%) 79±113.0 a 59.3±13.4 b 74.4±10.6 a F = 16.2; p<0.01 Moist aggr. <2mm (%) 21.3±13 a 40.2±13.2 b 25.6±10.6 a F = 15.2; p<0.01 Microporosity (m3 m-3) 0.42±0.35 ab 0.44±0.56 a 0.39±0.46 b F = 6.2; p=0.03 Macroporosity (m3 m-3) 0.14±0.04 a 0.12±0.02 a 0.07±0.02 b F = 33.7; p<0.01 TPs(m3 m-3) 0.56±0.35 a 0.56±0.61 a 0.48±0.73 b F = 16.8; p<0.01 Kss (cm h-1) 5.5±5.0 *a 5.2±2.4 ab 2.7±3.0 b F = 3.4; P=0.04
WD clay (g kg-1) 144.4±43.0 a 134.8±52.5 a 85.7±39.7 b F = 14.05; p<0.01
Clays (g kg-1) 380.1±75.3 a 333.5±137.6 a 158.1±88.1 b F = 38.7; p<0.01 Sand (g kg-1) 299.1±98.5 a 287±204.7 a 470.5±179.8 b F = 10.7; p<0.01 Silt (g kg-1) 319±139.5 a 376.8±136.6 a 367.8±120.8 a F = 1.4; p=0.24
Silt/clays 0.9±0.5 a 1.2±0.6 a 3.1±2.1 b F = 20.5; p<0.01
* rejected the hypothesis of normality of the data by the Kolmogorov-Smirnov test with p≤0.05. s significant properties for heterogeneity
of variances by Levene’s test (p≤0.01), the others showed homogeneity of variances (Levene p>0.01). Lowercase letters in the same
row mean differences in means by the Tukey test (properties with homogeneity of variances) or Dunnett T3 test (properties with
distinguishing the groups were, in descending order
of importance, TOC, Ca, FeDCB, Mg, Al, and FeH2SO4
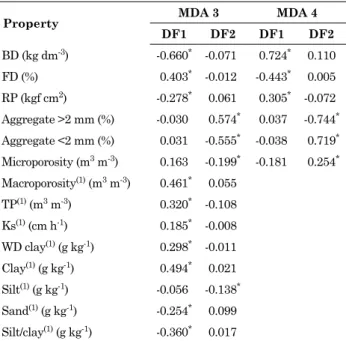
(Table 5). In MDA4, the stepwise method selected six of the 14 physical variables used for discrimination of the soil horizons. The most important properties were BD, FD, RP, microporosity, and wet aggregates (>2 mm and <2 mm). Considering the whole group of properties, the models selected 12 physical and chemical properties with high power for distinguishing the three horizons in the soils evaluated.
In the two-dimensional perceptual maps (Figure 2), it can be seen that the discriminant model for both the chemical and physical properties showed a clear separation of the three groups. It likewise evidenced the similarity between points of the B and C horizons and C horizon and Cr layers by the distribution of samples. Another noteworthy aspect
in this figure is the similarity between the B and C
horizons, both for chemical and physical properties.
DISCuSSION
Identification of the boundary between soil and saprolite in the field
Initially, the A, E, Bt, and Cr horizons/layers
were identified based on field morphology; and an
apparently transitional layer between the Bt horizon
and Cr layer was verified in all of the profiles. Initially, this layer was called the “C horizon” due
to differences in the color, structure, texture, root penetration, and amount of saprolite fragments.
The Bt horizon showed strong to moderately developed structures and angular and subangular
blocks with an increase in clay content, characterizing the lessivage process (Quénard et al., 2011). The predominant moist color was yellow, and the amount of saprolite fragments was smaller than in the underlying layers. In the C horizon, a clear grayish color, with moderate and angular blocks predominated, with up to 25 % of saprolite fragments. In the Cr layer, the predominant color was red, due to the occurrence of red saprolite
above 70 % in volume. The modified structure -
from angular to massive blocks, with a larger size
Table 5. Structure matrix coefficients of the soil chemical properties discriminant models
Property MDA 1 MDA 2
Df1 Df2 Df1 Df2
Ca2+ (cmol
c kg-1) -0.209* 0.027 -0.224* 0.000 Mg2+ (cmol
c kg-1) -0.153* -0.014 -0.163* 0.049 Al3+ (cmol
c kg-1) 0.232 -0.576* 0.252 0.789* TOC (g kg-1) 0.433* 0.210 0.461* -0.385 FeH2SO4 (g kg-1) 0.046 -0.202* 0.050 0.283* FeDCB (g kg-1) 0.175* 0.017 0.187* -0.057 FeAO(1) (g kg-1) 0.307* -0.090
Kex(1) (g kg-1) -0.037 0.353* Kst(1) (g kg-1) 0.071 0.240* H+Al(1) (cmol
c kg-1) 0.216 -0.348* CEC(1) (cmol
c kg-1) 0.142 -0.309* Tclay(1) (cmol
c kg-1) -0.192 0.330* pH(H2O)(1) -0.034 0.174*
* Largest absolute correlation between each property and any discriminant function. (1) This property was not selected by the stepwise procedure to be used in the MDA 2.
Table 4. Summary of descriptive fisher’s discriminant model
Discriminant function Eigenvalue Variance absolute (cumulative) Canonical correlation
% MDA1-Chemical(1)
DF1 10.650 95.2 (95.2) 0.956
DF2 0.532 4.8 (100) 0.589
MDA2-Chemical(2)
DF1 9.339 97.3 (97.3) 0.950
DF2 0.255 2.7 (100) 0.450
MDA3-Physical(1)
DF1 4.223 76.4 (76.4) 0.899
DF2 1.304 23.6 (100) 0.752
MDA4-Physical(2)
DF1 3.506 81.9 (81.9) 0.882
DF2 0.775 18.1 (100) 0.661
than in the overlying horizons - is characteristic
of geogenic processes (Lietzke and Weber, 1981;
Stolt et al., 1991).
Morphological features, such as transitions between horizons and the soil consistency, showed
greater variation, which was difficult to interpret.
However, the tendency was reduction in the degree of wet consistency with depth; and transitions were smooth between the Bt and C horizons and irregular
to wavy between the C horizons and Cr layers. Irregular and wavy transitions are common among less developed layers, as registered in the Cr layers,
reflecting variability of alteration in the weathering
processes (Stolt et al., 1993; Pedron et al., 2009, 2010). Thus, although incipient, a major variation in the C horizon can be interpreted as resulting from pedogenetic processes.
Statistical analyses of the chemical and physical data
Physical and chemical analyses are in agreement with field morphology. Discriminant analysis showed that the B and C horizons and the Cr layers can be distinguished based on chemical and physical properties. However, AnOVA analysis (Table 3) indicated similarities between the B and C horizons in regard to some chemical and physical properties.
The MDA specified which properties were most
important in distinguishing between the layers and in determining how they differ from each other by a linear combination of p-dependent properties. The use of chemical and physical properties selected in the stepwise system allowed for a better
fit of the classification and distinction of layers
evaluated in MDA2 and MDA4. However, all of the other properties (not used by stepwise) did not
significantly influence the classification, as indicated
by the power of MDA1 and MDA3to represent the variability of the data for both groups of chemical and physical properties (Tables 4 and 5).
The chemical and physical properties selected by the discriminant models that were generated by the
stepwise method included TOC, Ca, FeDCB, Mg, Al,
FeH2SO4, BD, RP, microporosity, and wet aggregates
(>2 and <2 mm), and they had greater power in
Table 6. Structure matrix coefficients of the soil physical properties discriminant models
Property MDA 3 MDA 4
Df1 Df2 Df1 Df2
BD (kg dm-3) -0.660* -0.071 0.724* 0.110 FD (%) 0.403* -0.012 -0.443* 0.005 RP (kgf cm2) -0.278* 0.061 0.305* -0.072 Aggregate >2 mm (%) -0.030 0.574* 0.037 -0.744* Aggregate <2 mm (%) 0.031 -0.555* -0.038 0.719* Microporosity (m3 m-3) 0.163 -0.199* -0.181 0.254* Macroporosity(1) (m3 m-3) 0.461* 0.055
TP(1) (m3 m-3) 0.320* -0.108 Ks(1) (cm h-1) 0.185* -0.008
WD clay(1) (g kg-1) 0.298* -0.011
Clay(1) (g kg-1) 0.494* 0.021 Silt(1) (g kg-1) -0.056 -0.138* Sand(1) (g kg-1) -0.254* 0.099 Silt/clay(1) (g kg-1) -0.360* 0.017
* Largest absolute correlation between each property and any discriminant function. (1) This property was not selected by the stepwise procedure to be used in the MDA 4.
DF2 (2.3%)
DF1 (97.3 %) 6
(a) (b)
3
0
-3
-6
-6 Cr
Cr C
C
B
B
-3 0 3 6
DF2 (18.1%)
DF1 (81.9 %) 6
3
0
-3
-6
-6 -3 0 3 6
representing data variance. Therefore, these properties
are suggested for use in assessing field morphology data
to distinguish the soil-saprolite boundary.
The average test results for sand, clay, WD clay,
silt/clay ratio, microporosity, TP, and RP indicate that the C horizons are closer to the B horizons than to the Cr layers. The reduction in BD, RP, and Ks in the C horizons compared to the Cr layers is the greatest alteration, matching the structural development and its smaller size and the presence of biochannels,
which contribute to increased porosity, water flow,
and root penetration (Pedron et al., 2011).
The mean Ks show the similarity between the B and C horizons and their difference from the Cr layers. However, this difference was not statistically
significant, due to high standard deviation values,
especially in the C horizons and Cr layers. These
results corroborate those of O’Brien and Buol
(1984) and Schoeneberger et al. (1995). The low conductivity of saturated layers in all of the Cr
layers is associated with a significant reduction in
macroporosity and TP and an increase in BD. The resistance of aggregates decreased for the >2mm aggregates from the Bt to the C horizon, possibly related to the decrease in organic matter and Fe oxides (Hickman et al., 2011; Vezzani and Mielnickzuk, 2011). The >2 mm aggregates increased from the C horizons to the Cr layers as a result of the increased volume of saprolite, which has a higher natural resistance (Stolt et al., 1991).
The properties CEC, FeDCB, Al, H+Al, and Tclay
statistically differed between the C horizons and Cr layers, and were similar in the C and B horizons. The other chemical properties, such as Ca, TOC, and
FeAO, showed differences from B to Cr, separating
C as transitional.
The concentration of illuvial Fe in the Bt horizons match the lessivage process. The K
values showed variation within the profile, with a significant reduction from Cr to C, and an increase from C to Bt. However, no significant differences
were found between the mean values in C when compared with the mean values in Bt and Cr for
either Kst or Kex. Considering the high amounts of
mica and K-feldspar in the fine sandstone and the
rapid alteration of these minerals in tropical and subtropical environments, it was expected that the dissolution data of K would be a good indicator of the soil-saprolite boundary, which was not observed by the test of means or by the discriminant models.
Boundary between soil and saprolite
The data presented in this study suggest two perspectives. In the first, the C horizon provides stronge vidence of pedogenesis, based on morphological, physical, and chemical properties that have more similarities to the B horizon than to the saprolite. The second indicates that the C horizon is a
transitional zone between saprolite (Cr) and soil (B), separated from both but with some mixed properties.
The data obtained for Alisols in the South of Brazil revealed that the C horizon should not be considered as saprolite as it does not show morphological or physical and chemical properties compatible with that layer, validating the results of Pedron et al. (2009,
2010). In this study, the C horizon was identified
according to clear evidence of a pedogenic process, which is not in agreement with the description found
in the guides used to describe and classify soil profiles
(Schoeneberguer et al., 2012; Santos et al., 2013;
IUSS Working Group WRB, 2014; USDA, 2014).
This situation was indicated by most of the morphological and physical properties used to identify saprolite in the field. These properties
have practical applicability in the field related to
water and root penetration, which are inferred by properties such as morphology (color, structure, texture, and roots), density, porosity, excavation and penetration strength, and hydraulic conductivity. If the C horizon is part of the soil, its lower limit becomes the lower limit of the soil, also called the soil-saprolite contact.
However, as indicated by some chemical properties, if C is considered a separate horizon as a transition
between soil and saprolite, the profile no longer
displays the lower limit or soil-saprolite contact, but rather represents a transition zone, as proposed by
Lietzke and Weber (1981) and Stolt et al. (1993).
In both perspectives presented in this article, the concept of the C horizon is different. So, considering our limited database, further studies should be conducted to verify the representative nature and
practical applicability of the perspectives in the field.
In the case of the Alisols studied, where the saprolite is close to the surface, it performs important environmental functions (Lietzke and
Weber, 1981). According to Schafer et al. (1979),
Sternberg et al. (1996), and Pedron et al. (2011), the saprolite layers of shallow soils may have equal or greater water retention and availability to plants than the soil itself. Thus, considering the C horizon as part of the soil and, additionally, as part of the solum would demand greater detail in its morphological description in soil surveys.
Landscape complexity limits clear identification of
the soil lower limit, as highlighted by Tandarich et al. (2002) and USDA (2014). However, validating morphological and physical procedures that can be
used to separate these layers in the field and better
distinguish the soils are fundamental for technical and taxonomic soil interpretations. The results of this study suggest that the C horizonin Alisols
can be identified in the field by the presence and
The C horizons and the Cr layers included in this study showed distinct natures. The C horizons showed clear evidence of pedogenesis, which was not the case in the Cr layers. In addition, there are all the morphological, physical, and chemical
differences perceived in the field and validated
by statistical tests. In this case, designation of
both with the letter “C” becomes inadequate. The
authors of this study suggest the use of the letter
“Cr” for saprolite, as cited in Tandarich et al. (2002).
However, as already mentioned, more studies are needed to verify the representative nature of these
data in terms of occurrence in the field.
CONCLuSIONS
The results indicated two situations: the C horizon developed with strong evidence of pedogenesis, showing morphological, physical, and chemical behaviors similar to those of the B horizon; and the C horizon is a transition zone between saprolite (Cr) and soil (B), independent of both.
The morphological variables analyzed in the
field that showed differences between the B and C
horizons and Cr layer were color, structure, texture, roots, and fragments of saprolite. The variables that support inclusion of the C horizon as part of
the soil are sand, clay, WD clay, silt/clay ratio,
macroporosity, TP, RP, FD, CTC, FeDCB, Al, H+Al,
and Tclay. The variables that support the C horizon
as a transition zone are silt, Ca, TOC, and FeAO.
Multiple discriminant analysis was effective in separating the three layers studied, and the discriminant functions of the chemical variables
classified the samples with an accuracy greater
than 93 %, while the discriminant functions of the
physical variables classified the samples with an
accuracy greater than 85 %.
The discriminant models generated by the stepwise method suggested the variables TOC, Ca,
FeDCB, Mg, Al, FeH2SO4, BD, RP, microporosity, and
wet aggregates (>2 and <2 mm) for validating the
morphological data in the field in identification of
the limit between soil and saprolite.
ACKNOwLEDGEMENTS
We wish to thank the CNPq (Brazilian National Council for Scientific and Technological
Development) for funding this study and for providing a research excellence award to the third
and fourth authors. We also wish to thank the
assistant editor and the anonymous reviewer who contributed to improvement of the text.
rEfErENCES
Brown MT, Wicker LR. Discriminant analysis. In: Tinsley HEA,
Brown SD, editors. Handbook of applied multivariate statistics and mathematical modeling. San Diego: Academic Press, 2000. p.209-34.
Donagema GK, Campos DVB, Calderano SB, Teixeira WG, Viana
JHn. Manual de métodos de análise de solo. 2ª ed. Rio de Janeiro: Embrapa Solos; 2011.
Empresa Brasileira de Pesquisa Agropecuária - Embrapa.
Sistema brasileiro de classificação de solos. 3ª ed. Brasília,
DF: 2013.
Hickman C, Costa LM, Schaefer CEGR, Fernandes RBA, Andrade CLT. Atributos físico-hídrico e carbono orgânico de um Argissolo após 23 anos de diferentes manejos. R Caatinga. 2012;25:128-36.
IUSS Working Group WRB. World reference base for soil
resources 2014: International soil classification system for naming soil and creating legends for soil maps. Rome: FAO; 2014.
(World Soil Resources Report, 103).
Jackson ML, Lim CH, Zelazny LW. Oxides, hydroxides, and
aluminosilicates. In: Klute A, editor. Methods of soil analysis: Physical and mineralogical methods. Madison: American Society of Agronomy; 1986. Pt 1. p.101-50.
Kemper WD, Chepil WS. Size distribution of aggregates. In: Black
CA, editor. Methods of soil analysis. Madison: American Society of Agronomy; 1965. Pt 1. p.495-509.
Lietzke DA, Weber RS. The importance of Cr horizons in
soil classification and interpretations. Soil Sci Soc Am J. 1981;45:593-9.
Maluf JRT. Nova classificação climática do estado do Rio Grande
do Sul. R Bras Agrometeorol. 2000;8:141-50.
Manly BFJ. Multivariate statistical methods: A primer. 3rd.ed. new york: Chapman & Hall; 2005.
Mckeague JA, Day JH. Dithionite and oxalate extractable Fe and Al as aids in differentiating various classes of soil. Can J Soil Sci. 1966;46:13-22.
Mehra OP, Jackson ML. Iron oxide removal from soils and clays by a dithionite-citrate system buffered with sodium bicarbonate. In: Proceedings of the 7th national Conference Clays and Clay Mineral; 1960; London. London: 1960. p.317-27.
Melo VF, novais RF, Fontes MPF, Schaefer CEGR. Potássio e magnésio em minerais das frações areia e silte de diferentes solos.R Bras Ci Solo. 2000;24:269-84.
O’brien EL, Buol SW. Physical transformation in a vertical
soil-saprolite sequence. Soil Sci Soc Am J. 1984;48:354-7.
Pedron FA, Azevedo AC, Dalmolin RSD, Sturmer SLK, Menezes FP. Morfologia e classificação taxonômica de neossolos e saprolitos derivados de rochas vulcânicas da Formação Serra Geral no Rio Grande no Sul. R Bras Ci Solo. 2009;33:119-28.
Pedron FA, Fink JR, Dalmolin RSD, Azevedo AC. Morfologia dos contatos entre solo-saprolito-rocha em neossolos derivados de arenitos da Formação Caturrita no Rio Grande do Sul. R Bras Ci Solo. 2010;34:1941-50.
Pedron FA, Samuel-Rosa A, Dalmolin RSD. Variação das características pedológicas e classificação taxonômica de Argissolos derivados de rochas sedimentares. R Bras Ci Solo. 2012;36:1-9.
Quénard L, Samouëlian A, Laroche B, Cornu S. Lessivage as a major process of soil formation: a revisitation of existent data. Geoderma. 2011;167/168:135-47.
Rice TJ, Buol SW, Weed SB. Soil-saprolite profiles derived from mafic rocks in the North Caroline Piedmont: I. Chemical,
morphological and mineralogical characteristics and transformations. Soil Sci Soc Am J. 1985;49:171-8.
Santos RD, Lemos RC, Santos HG, Ker JC, Anjos LHC. Manual de descrição e coleta de solo no campo. 5ª. ed. Viçosa, MG: Sociedade Brasileira de Ciência do Solo; 2013.
Sartori PLP. Geologia e geomorfologia de Santa Maria. Ci Amb. 2009;38:19-42.
Schoeneberger PJ, Amoozegar A, Buol SW. Physical property
variation of a soil and saprolite continuum at three geomorphic positions. Soil Sci Soc Am J. 1995;59:1389-97.
Schoeneberger PJ, Wysocki DA, Benham EC, Broderson WC,
editors. Field book for describing and sampling soils. Version 3.0. Lincoln: natural Resources Conservation Service, 2012.
Schafer WM, Nielsen GA, Nettleton WD. Morphology of a
paralithic contact in a soil over soft sandstone. Soil Sci Soc Am J. 1979;43:383-6.
Sternberg PD, Anderson MA, Graham RC, Beyers JL, Tice KR. Root distribution and seasonal water status in weathered granitic bedrock under chaparral. Geoderma. 1996;72:89-98.
Stolf R. Teoria e teste experimental de fórmulas de transformação dos dados de penetrômetro de impacto em resistência do solo. R Bras Ci Solo. 1991;15:229-35.
Stolt MH, Baker JC, Simpson TW. Micromorphology of the
soil-saprolite transition zone in Hapludults of Virginia. Soil Sci Soc Am J. 1991;55:1067-75.
Stolt MH, Baker JC, Simpson TW. Characterization and genesis
of saprolite derived from gneissic rocks of Virginia. Soil Sci Soc Am J. 1992;56:531-9.
Stolt MH, Baker JC, Simpson TW. Soil-landscape relationships
in Virginia: I. Soil variability and parent material uniformity. Soil Sci Soc Am J. 1993;57:414-21.
Stolt MH, Baker JC. Strategies for studying saprolite and saprolite genesis. In: Cremeens DL, Brown RB, Huddleston JH,
editors. Whole regolith pedology. Madison: Soil Science Society
of America; 1994. p.1-20. (Special publication, 34).
Tandarich JP, Darmody RG, Follmer LR. The pedo-weathering
profile: A paradigm for whole-regolith pedology from the Glaciated
Midcontinental United States of America. In: Cremeens, DL, Brown
RB, Huddleston JH, editors. Whole regolith pedology. Madison: Soil
Science Society of America; 1994. p.97-117 (Special publication, 34). Tandarich JP, Darmody RG, Follmer LR, Johnson DL. Historical
development of soil and weathering profile concepts from Europe