ISSN: 1809-4430 (on-line)
REGIONALIZATION OF MAXIMUM AND MINIMUM FLOW IN THE TELES PIRES BASIN, BRAZIL
Doi:http://dx.doi.org/10.1590/1809-4430-Eng.Agric.v37n1p54-63/2017
TÁRCIO R. LOPES1, CORNÉLIO A. ZOLIN2*, GIULIANI DO PRADO3, JANAÍNA PAULINO1, FREDERICO T. DE ALMEIDA1
2*Corresponding author. Embrapa Agrossilvipastoril/ Sinop - MT, Brasil. E-mail: cornelio.zolin@embrapa.br
ABSTRACT: In a watershed there is space and climate variability within its catchment area, causing changes in water qualitative and quantitative characteristics. Thus, the hydrological data collected from a specific basin may be extrapolated to neighboring basins with similar physical characteristics, using techniques of hydrological regionalization. This study developed the flow regionalization in the Teles Pires Basin, using historic series and probabilistic models to verify the data adherence through the regression equations adjustment according to the hydrologically homogeneous regions. The linear and power regression models were tested, employing physical and climatic characteristics and then the best adjustments were selected based on coefficients of determination, adjusted coefficient of determination, significance by F-test and small number of variables in the equation. The physical characteristics of the basin, drainage area and mainstream length, and the climatic variable, annual total precipitation showed higher adjustments. These equations can provide subsidy for decision making in the process of water resource management.
KEY WORDS: hydrological regionalization, natural flow, water resources management.
INTRODUCTION
With the approval of the National Water Act of 1997 (Law 9.433/97), which defines the National Water Resources Policy, the number of Water Resources Use Grant as well as the establishment of facilities such as small hydroelectric plants increased significantly, thus increasing the need of determining the hydrological variables to be used in the management of water resources. In the absence of hydrological data, regionalization of the hydrological variables used in water resource planning and environmental control is paramount. In this sense, among the methods employed for this objective, regionalization is widely used as techniques to overcome the lack of hydrological data. (SILVA JUNIOR et al. 2003; FIOREZE, 2008).
Regionalization can be defined as a set of procedures that takes into account existing information in order to estimate the hydrologic variables in places where data are missing or insufficient, in other words, it seeks to transfer information from one location to another (TUCCI, 2009) to support decision makers in water resource planning.
Flow regionalization in some cases becomes crucial, especially when the cost for implementation of hydrometric network to measure data becomes unfeasible. Additionally, the regionalization process improves the estimates of hydrologic variables and allows checking the consistency of hydrological data series (SILVA et al, 2006; NOVAES et al., 2007).
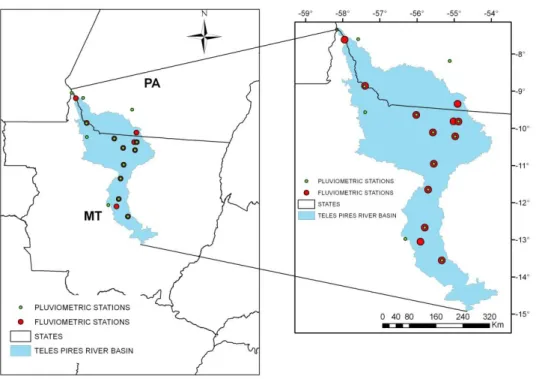
The Teles Pires basin has great extension and is provided by only 12 fluviometric stations within its coverage area. Thus, the study of water availability of this basin, the concession granting the right of the water use, as well as the assessment of floods while designing hydraulic structures is challenging. It is important to note that the basin has great potential for hydroelectric sector, with several licensed hydroelectric plants or under construction.
permanence (Q90) and 95% permanence (Q95) and maximum flow rates with the purpose of giving
technical and scientific information to support decision makers in water resources management of Teles Pires basin.
MATERIAL AND METHODS
The Teles Pires River is one the formers of Tapajós River that is one of the most important tributaries of the right margin of the Amazon River. The Teles Pires basin is situated in the range 15º to 7º south latitude and 54º' to 58º' west longitude (Figure 1), its largest portion is inserted in the state of Mato Grosso and a small portion in the state of Pará. Its drainage area is approximately 141,483 km2 (DALMAGRO et al., 2007) comprising the Cerrado ecosystem and the transition
zones between the Cerrado and Amazon biomes.
FIGURE 1. Map of the Teles Pires river basin and the localization of the fluviometric and pluviometric stations used in the regionalization analyses.
TABLE 1. Fluviometric stations used to obtain time series of Teles Pires river basin.
Code Station Lat Long Area (km²) extention Serie
(years)
17200000 Porto Roncador 13º33’27” 55º20’05” 10800 24 17210000 Teles Pires 12º40’27” 55º47’34” 13900 22 17230000 PCH Canoa Quebrada Lucas do Rio Verde 13º03’07” 55º54’18” 5435 18 17280000 Cachoeirão 11º39’06” 55º42’09” 34600 21 17300000 Fazenda Tratex 10º57’21” 55º33’03” 40700 13
17340000 Indeco 10º06’48” 55º34’14” 52200 24
17355000 PCH Braço Norte Jusante 09º49’00” 55º01’00” 3100 15 17380000 Jusante Foz Peixoto de Azevedo 09º38’26” 56º01’10” 81600 17 17410000 Santa Rosa 08º51’28” 57º24’07” 131000 17 17420000 Três Marias 07º36’53” 57º57’01” 138000 20
17350000 Cachimbo 09º49’02” 54º53’09” 1010 30
17345000 Base do Cachimbo 09º20’32” 54º54’29” 465 28 Source: ANA (2014).
TABLE 2. Pluviometric stations used to obtain time series of Teles Pires river basin.
Code Station City Lat Lon Serie extention (years)
0857000 Santa Rosa Apiacás 08º52’13” 57º24’59” 25 0957001 Novo Planeta Apiacás 09º33’59” 57º23’41” 22 0954001 Cachimbo Guaranta do Norte 09º49’07” 54º53’11” 20 1055000 Estrada Cuiabá – Santarém Peixoto de Azevedo 10º13’13” 54º58’16” 07 0956001 Jusante Foz Peixoto de Azevedo Alta Floresta 09º38’36” 56º01’07” 21 1055001 Indeco Carlinda 10º06’45” 55º34’12” 35 1055003 Fazenda Tratex Colider 10º57’15” 55º32’55” 11 1255001 Teles Pires Sorriso 12º40’30” 55º47’35” 23 1155000 Cachoeirão Sinop 11º39’04” 55º42’09” 24 1256002 Fazenda Divisão Lucas do Rio Verde 12º58’50” 56º18’06” 13 1355001 Porto Roncador Sorriso 13º33’23” 55º19’54” 25 0855000 KM 947 BR-163 Itaituba 08º11’14” 55º07’10” 30 0757001 Missão Cururu Itaituba 07º36’00” 57º35’00” 07 0758000 Barra do São Manuel Borba 07º20’20” 58º09’18” 19 Source: ANA (2014).
EUCLYDES et al. (2002) presented two criteria for identification of hydrologically homogeneous regions; the first is based on the study of the dimensionless flow frequency distribution and the second in the statistical analysis of the multiple regressions adjustment of the average flow rates considering the physical and climatic variables of the basin. In this study the homogeneous regions were chosen from the best regression adjustment based on hydrologic and climatic characteristics of the basin.
The following hydrological variables were used in regionalization of Teles Pires basin: drainage area (A) in km2, drainage density (Dd) in km km-2 and length of main water body (L) in
km. As climate variables we used the total annual precipitation (Pa) in mm, precipitation of rainiest semester (Prs) in mm and precipitation of driest season (Pds) in mm, according to [eq. (1)].
) , Pr , , , ,
(A Dd L Pa s Pds f
The criteria for choosing the hydrologically homogeneous regions, was also based on the location and availability of existing fluviometric stations in the basin. Thus, the regions were divided based on statistical values for the coefficients of determination (R ²), the standard error of the estimate and level of significance by F-test.
For each hydrologically homogeneous region, the minimum and maximum river flows were adjusted to statistical probability models. The minimum river flows were adjusted according to Gumbel, Weibull and Gamma models at two parameters. As for the maximum river flows, the data were submitted to the Log-Normal model at two and three parameters, Gumbel and Gamma at two parameters. The data adherence and selection of the models were based on the Kolmorogov-Smirnov test and the chi-square test at 5% significance level.
The selected probabilistic models were used to calculate the maximum flows rates for the returning periods of 2, 5, 10, 20, 50 and 100 years, and for the determination for the minimum flow rates of seven days for the returning period of 10 year (Q7,10), of 95% and 90% permanence (Q95
and Q90).
For the regression analyses the physical characteristics of the basin (A, L, Dd) were determined using the ArcMap10.1 interface of the ArcGIS, where it was used vector files Shapefile format available in the virtual library of the National Water Agency (ANA, 2014), thus obtaining the coded hydrographic network and Ottobasins (grouped graphic representation at level 3), which are polygonal features of the basin areas. The determination of the climatic variables (Pa, Prs, Pds), for employment in the regression analysis, was used the weighting method by the inverse distance of the pluviometric station to the fluviometric station used (GARDIMAN et al., 2012).
The maximum and minimum river flow data, depending on the physical and climatic variables of the watershed, underwent to the multiple regression analysis for both linear and potential models. Regarding the minimum flow, the independent variables used were Pds, Pa, A, Dd and L. The same variables were used for the maximum flow estimates with exception of Pds, which was replaced by Prs.
The equations were adjusted by the STATISTICA 8.0 software and the best regression models were selected based on the coefficient of determination (R²), the adjusted coefficient of determination (R²a), the level of significance by F-test and the small number of variables in the equation.
RESULTS AND DISCUSSION
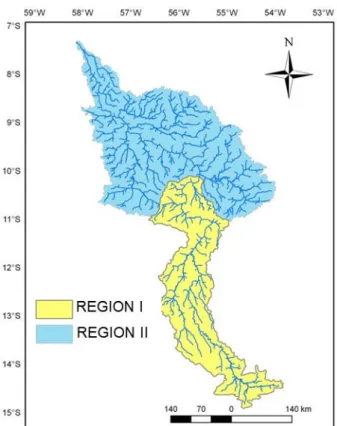
The regression models showed unsatisfactory results when the fluviometric stations were grouped in order to represent a single hydrologically homogeneous region, with determination coefficient below 0.80 and no significant values for F-test. Thus, it was considered the regression models with coefficient of determination higher than 0.80 among which we selected the best three models for minimum flow and the best two models for maximum flow. Therefore, the regional functions are not similar for the entire Teles Pires basin, consequently, the features within the basin are not similar to its full extension in accordance with TUCCI (2009) recommendations.
FIGURE 2. Map of hydrologically homogeneous regions for maximum and minimum flow of Teles Pires river basin.
The Log-Normal distribution at three parameters showed better adjustment for maximum flows and the Weibull model showed better adjustment for minimum flows corroborating with the studies realized by BARBOSA et al. (2005) that found for minimum flow rates, the Weibull distribution model with the better adjustments meeting the significance criteria analyzed by the same tests.
As reported in the literature, in most studies of flow regionalization the model that best adjusts to the maximum flows data is the Pearson type III. However, LORENZONI et al. (2013) found that the Log-Normal model at three parameters was the one that best adjusted with the data of the maximum annual precipitation in the Cianorte region - PR, according to Kolmogorov-Smirnov test at 5% significance level.
In the regression analysis were selected the best models with highest values for the coefficient of determination and adjusted coefficient of determination close to one and values with higher significant values by F-test (Tables 3 and 4).
TABLE 3. Regression models recommended to estimate the minimum flow (m³ s-1) associated with
statistical parameters.
Region Equation R² R²a %F
-2.381 2.818
L A 0.000246
Q7,10 0.99 0.99 0.0007
I Q95%0.000302A2.961L-2.641 0.99 0.99 0.0012
-2.741 3.024
L A 0.000332
Q90% 0.99 0.99 0.0008
Pa A
Q7,10-1419.08-0.0063 0.6177 0.99 0.99 0.0000 II Q95%-2483.56-0.0068A1.0817Pa 0.99 0.99 0.0003
Pa A
TABLE 4. Regression models recommended to estimate the maximum flow (m³ s-1) depending on
the return time (RT), associated with statistical parameters.
RT Equation R² R²a %F
Region I
2 Q-4415.642.4510.13-2.47A32767.42Dd-0.83L 0.99 0.99 0.0089 L
A 0.142
Q 0.98 0.97 0.0066
5 -2.802 3.1 2.519 L Dd A 135.424
Q 0.99 0.98 0.0228
-2.413 2.375
L A 0.253
Q 0.98 0.97 0.0063
10 -2.6619 3.137 2.392 L Dd A 196.064
Q 0.99 0.98 0.0273
-2.362 2.319
L A 0.356
Q 0.98 0.97 0.0066
20 -2.565 2.807 2.321 L Dd A 136.469
Q 0.98 0.97 0.0330
-2.309 2.264
L A 0.479
Q 0.97 0.97 0.0071
50 -2.441 2.514 2.223 L Dd A 113.643
Q 0.98 0.97 0.0406
-2.24 2.194
L A 0.685
Q 0.97 0.96 0.0080
100 -2.355 2.321 2.155 L Dd A 101.334
Q 0.98 0.96 0.0468
-2.189 2.143
L A 0.879
Q 0.97 0.96 0.0089
Region II 2 0.441 0.898 A 0.00639
Q Pa 0.99 0.99 0.0000
0.943 A 0.115
Q 0.99 0.99 0.0000
1.493 L 0.165
Q 0.99 0.99 0.0000
5 0.736 0.061 L A 126.878
Q 0.99 0.99 0.0000
Dd A
Q-575.70.069 -1932.09 0.99 0.99 0.0000 0.893
A 0.243
Q 0.99 0.99 0.0000
10
Pa A
Q453.3840.074 -2.025 0.99 0.99 0.0000 -0.422
1.107 L A 0.447
Q 0.99 0.99 0.0000
0.869 A 0.356
Q 0.99 0.99 0.0000
20
Pa A
Q9870.1080.080 -4.2 0.99 0.99 0.0000 -0.818
1.321 L A 0.669
Q 0.99 0.99 0.0000
0.851 A 0.477
Q 0.99 0.99 0.0000
50
Pa A
Q17450.660.087 -7.49 0.99 0.99 0.0000 -1.315
1.607 L A 0.905
Q 0.99 0.99 0.0000
0.833 A 0.644
Q 0.99 0.99 0.0000
100
Pa A
Q23862.480.092 -10.27 0.99 0.99 0.0000 -1.675
1.823 L A 1.008
Q 0.99 0.99 0.0000
0.824 A 0.772
Q 0.99 0.99 0.0000
Pa-total annual precipitation (mm); L - length of main water body(km); A -Drainage area (km²) and Dd- drainage density (km km-²).
The equations which used the drainage density or total annual precipitation as isolated explanatory variables were not presented here due to their low values for the coefficients of determination and level of significance by F-test.
In regard to the climatic variables used in the regression models, the total annual precipitation showed better results when compared with the rainfall of the driest and the wettest season, reason why these last models are not shown in Tables 3 and 4.
associated with the independent variables of drainage area and length of the main water body. For region II, besides the variable drainage area, the total annual precipitation also affected the results of the multiple regression models.
LISBOA et al. (2008) found that the potential regression model best represented the hydrological behavior of minimum flows for the Paracatu river basin when considering drainage area as the only physical characteristic in the model. RIBEIRO et al. (2005) also tested regression models for minimum flows in the Doce River in Minas Gerais and found that when considering as physical and climatic variables the drainage area and the precipitation, respectively, potential models were those that best represented minimum flows regimes in the basin.
Regarding the maximum flows, in the hydrologically homogeneous region I (Table 4), the coefficient of determination ranged from 0.97 to 0.99 and the adjusted coefficient of determination ranged from 0.96 to 0.99, with significance level of 0.05 by F-test. The drainage area and the length of the main water body as independent variables in the regression model were satisfactory in explaining the maximum flows of region I for the returning periods of 2, 5, 10, 20, 50 and 100 years. In the hydrologically homogeneous region II, the coefficients of determination was 99% and the drainage area, as independent variable in the regression model, was sufficient to estimate the maximum flow in the Teles Pires basin.
BAENA et al. (2004) adjusted multiple regression models for four different homogeneous regions of Paraíba do Sul river basin, covering the states of Minas Gerais, Rio de Janeiro and São Paulo and in its results, the drainage area, length of main water body, or a combination of these variables, were adequate to explain the maximum flow of the three regions. For a single region, the average slope of the basin properly represented the maximum flow.
Maps of minimum and maximum flows generated through interpolations realized from data of the fluvial stations used in regionalization are presented in Figure 3. A more accurate result in the interpolation could be obtained if there were more numbers of fluviometric stations, especially in the left side of the Teles Pires river basin.
The northwestern region of the Teles Pires basin (Figure 3) shows higher values for maximum and minimum flow rates, while the lowest values are observed in the northeast and southern part of the basin.
The minimum flow rate Q90 and Q95 (Figure 3A and 3B) ranged from 4.32 to 23.62 and 2.62
to 21.03 L s-1 km-2, respectively. The assessment of Q
95 is essential, as this is used to
water resources use grants in the state of Mato Grosso. The minimum flow of seven days of duration associated with a 10 year return period (Q7,10) ranged from 1.63 to 20.59 L s-1 km-2
(Figure 3C).
The maximum flow rates (Figure 3D to 3I) showed similar distribution for the interpolated feature, with higher return period resulting in higher flow rate. For a return period of two years the maximum flow ranged from 40.77 to 187.90 L s-1 km-2, while for a return period of 100 years, the
FIGURE 3. Maps of minimum flow (L s-1 km-²) Q90% (A), Q95% (B), Q7,10 (C) and maximum
flow (L s-1 km-²) for 2 years (D), 5 years (E), 10 (F), 20 years (G), 50 years (H) and
100 years (I) return period (RT) for Teles Pires river basin.
CONCLUSIONS
Two hydrologically homogeneous regions were identified in the Teles Pires Basin.
The potential and linear models showed the best adjustment for maximum and minimum flow rates estimates for both regions of Teles Pires Basin studied.
The drainage area and length of main water body were the physical characteristics that produce the best results for minimum flow estimates for region I. For region II the drainage area and total annual precipitation produce the best results for minimum flow estimates.
For maximum flow rates, the physical characteristics of length of main water body and drainage area or only drainage area were sufficient for maximum flow estimative.
ACKNOWLEDGMENTS
The authors thank the Embrapa Agrossilvipastoril, the Federal University of Mato Grosso (UFMT) through the graduate studies program in Agronomy (Sinop Campus), the National Council of Scientific and Technological Development (CNPq) and the Mato Grosso State Research Foundation (FAPEMAT).
REFERENCES
ANA - Agência Nacional das Águas. Biblioteca virtual. 2014. Disponível em: < http://www.ana.gov.br/bibliotecavirtual/ottobacias.asp>. Acesso em: 15 ago. 2014.
ANA - Agência Nacional das Águas. Hidroweb: Sistemas de informações hidrológicas. 2014. Disponível em: <http://hidroweb.ana.gov.br>. Acesso em: 15 ago. 2014.
BAENA, L. G. N.; SILVA, D. D. DA; PRUSKI, F. F.; CALIJURI, M. L. Regionalização de vazões com base em modelo digital de elevação para a bacia do Rio Paraíba do Sul. Engenharia Agrícola, Jaboticabal, v.24, n.3, p.612-624, 2004.
BARBOSA, S. E. S.; BARBOSA JÚNIOR, A. R.; SILVA, G. Q.; CAMPOS, E. N. B.;
RODRIGUES, V.C. Geração de modelos de regionalização de vazões máximas, médias de longo período e mínimas de sete dias para a Bacia do Rio do Carmo, Minas Gerais. Engenharia
Sanitária e Ambiental, Campina Grande, v.10, n.1, p.64-71, 2005.
DALMAGRO, H. J.; MUNHOZ, K. C. A.; MARIA DE FÁTIMA, F.; SALIMON, C. I.;
KRUSCHE, A. V.; UMETSU, C. A.; ROSA, R. D.; UMETSU, R. K.; ALMEIDA, L. G.; SANTOS, V. A.; SANCHES, L.; NOGUEIRA, J. S. Dinâmica do carbono inorgânico dissolvido nos rios Teles Pires e Cristalino na Bacia Amazônica. Ciência e Natura, Santa Maria, v.29, n.2, p.115-127, 2007. EUCLYDES, H. P.; FERREIRA, P. A.; RUBERT, O. A. V.; SANTOS, R. M. Regionalização hidrológica na bacia do alto São Francisco a montante da barragem de Três Marias, Minas Gerais. Revista Brasileira de Recursos Hídricos, Porto Alegre, v.6, n.2, p.81-105, 2002.
FIOREZE, A. P.; DE OLIVEIRA, L. F. C.; FRANCO, A. P. B. Avaliação do desempenho de equações de regionalização de vazões na bacia hidrográfica do Ribeirão Santa Bárbara, Goiás, Brasil. Ambiente & Água - An Interdisciplinary Journal of Applied Science, Taubaté, v.3, n.2, p. 62-76, 2008.
GARDIMAN, B. S.; MAGALHÃES, I. A. L.; FREITAS, C. A. A. de; CECÍLIO, R. A. Análise de técnicas de interpolação para espacialização da precipitação pluvial na bacia do rio Itapemirim (ES). Ambiência, Guarapuava, v.8, n.1, p. 61-71, 2012.
LISBOA, L.; MOREIRA, M. C.; SILVA, D. D.; PRUSKI, F. F. Estimativa e regionalização das vazões mínimas e média na bacia do rio Paracatu. Revista Engenharia na Agricultura, Viçosa, MG, v.16, n.4, p.471-479, 2008.
NOVAES, L. F.; PRUSKI, F. F.; QUEIROZ, D. O.; RODRIGUEZ, R. G.; SILVA, D. D.; RAMOS, M. M. Avaliação de desempenho de cinco metodologias de regionalização de vazões. Revista Brasileira de Recursos Hídricos, Porto Alegre, v.12, n.2, p.51-61, 2007.
RIBEIRO, C. B. M.; MARQUES F. A.; SILVA D. D. Estimativa e regionalização de vazões mínimas de referência para a bacia do rio Doce. Engenharia na agricultura. Viçosa, MG, v.13, n.2, p.103-107, 2005.
SILVA JUNIOR, O. B.; BUENO E. O.; TUCCI, C. E M.; CASTRO N. M. R. Extrapolação espacial na regionalização da vazão. Revista Brasileira de Recursos Hídricos, Porto Alegre, v.8, n.1, p.21-37, 2003.
SILVA, A. M.; OLIVEIRA, P. M.; MELLO, C. R. DE; PIERANGELI, C. Vazões mínimas e de referência para outorga na região Alto do Rio Grande, Minas Gerais. Revista Brasileira de Engenharia Agrícola e Ambiental, Campina Grande, v.10, n.2, p.374-380, 2006.