ORIGINAL ARTICLE
CITE AS: Zaiatz, A.P.S.R.; Zolin, C.A.; Vendrusculo, L.G.; Lopes, T.R.; PAULINO, J. 2018. Agricultural land use and cover change in the Cerrado/Amazon ecotone: A case study of the upper Teles Pires River basin. Acta Amazonica 48: 168-177.
Agricultural land use and cover change in the Cerrado/
Amazon ecotone: A case study of the upper Teles Pires
River basin
Ana Paula Sousa Rodrigues ZAIATZ1*, Cornélio Alberto ZOLIN2, Laurimar Goncalves VENDRUSCULO3,
Tarcio Rocha LOPES4, Janaina PAULINO5
1 Universidade Federal de Mato Grosso. Programa de Pós Graduação em Agronomia. Av. Alexandre Ferronato, 1200 - St. Industrial, CEP: 78698-000, Sinop - MT 2 Empresa Brasileira de Pesquisa Agropecuária, Embrapa Agrossilvipastoril. Rodovia dos Pioneiros MT-222, Km 2,5, Zona Rural, CEP: 78550-970, Sinop – MT 3 Empresa Brasileira de Pesquisa Agropecuária, Embrapa Informática Agropecuária. Av. André Tosello, nº 209, Campus da Unicamp, Barão Geraldo
CEP: 13083-886, Campinas – SP.
4 Universidade de São Paulo, Escola Superior de Agricultura “Luiz de Queiroz”. Departamento de Engenharia de Biossistemas. Av. Pádua Dias, 11, CEP: 13418-900, Piracicaba – SP
5 Universidade Federal de Mato Grosso, Instituto de Ciências Agrárias e Ambientais. Av. Alexandre Ferronato, 1200 - St. Industrial, CEP: 78698-000, Sinop – MT * Corresponding author: [email protected]
ABSTRACT
The upper Teles Pires River basin is a key hydrological resource for the state of Mato Grosso, but has suffered rapid land use and cover change. The basin includes areas of Cerrado biome, as well as the areas transitional between the Amazon and Cerrado vegetation types, with intensive large-scale agriculture widely-spread throughout the region. The objective of this study was to explore the spatial and temporal dynamics of land use and cover change from 1986 to 2014 in the upper Teles Pires basin using remote sensing and GIS techniques. TM (Thematic Mapper) and TIRS (Thermal Infrared Sensor) sensor images aboard the Landsat 5 and Landsat 8, respectively, were employed for supervised classification using the “Classification Workflow” in ENVI 5.0. To evaluate classification accuracy, an error matrix was generated, and the Kappa, overall accuracy, errors of omission and commission, user accuracy and producer accuracy indexes calculated. The classes showing greatest variation across the study period were “Agriculture” and “Rainforest”. Results indicated that deforested areas are often replaced by pasture and then by agriculture, while direct conversion of forest to agriculture occured less frequently. The indices with satisfactory accuracy levels included the Kappa and Global indices, which showed accuracy levels above 80% for all study years. In addition, the producer and user accuracy indices ranged from 59–100% and 68–100%, while the errors of omission and commission ranged from 0–32% and 0–40.6%, respectively.
KEYWORDS:Amazon Basin, remote sensing, GIS, territorial management
Mudança do uso e cobertura do solo na zona de transição entre os biomas
Amazônia e Cerrado: Estudo de caso da bacia do alto Rio Teles Pires
RESUMO
ZAIATZ et al. Land use change in the upper Teles Pires River basin
ACTA
AMAZONICA
INTRODUCTION
From the perspective of Brazilian domestic, as well as international agricultural production, the state of Mato Grosso is recognised as one of the largest global agricultural granaries. To guarantee extensive production, the current agricultural model combines monoculture, mechanization and intensive agrochemical usage (Theodoro 2002; Machado and Guarim 2013). On the other hand, while this has had economic benefits, the expansion of agriculture activities is also one of the main driving factors in the clearing of forests and savannas in this part of Brazilian Amazonia, with important impacts on greenhouse-gas emissions, as well as biodiversity (Fearnside et al. 2009; Geist and Lambim 2002). Such a major expansion of croplands under heavily mechanized agriculture imposes a significant new dynamic on land use and cover changes, which is likely to result in extensive environmental impacts (Forster et al. 2007) and, therefore, deserves attention.
The natural cover in the region was originally Cerrado, and Amazon/Cerrado transition vegetation. In this context, it is important to mention that, while the Cerrado biome is the second largest biome in Brazil, only 0.85% of its area is legally protected. At the same time, more than 50% of the area formerly occupied by Cerrado (approximately 2 million km2)
has been converted into pasture and agricultural land in recent decades (Klink and Machado, 2005) at rates of 1.2-1.5% per year (22,000 to 30,000 km2 year-1) (Machado et al. 2004). This
has made the Cerrado biome the most important area in terms of grain production in Brazil. Additionally, its natural and anthropogenic coverage is one of the most difficult to map of all Brazilian biomes due to its large extension, high seasonality and the rapid and dynamic nature of spatio-termporal changes in land cover (Sano et al. 2008; Probio 2007).
The upper Teles Pires basin includes some of the prime centers for soybean and corn production in Brazil, including Lucas do Rio Verde, Sorriso, Nova Mutum and Sinop municipalities. More than 17% of the total GDP of Mato Grosso is generated in the municipalities that are within (totally or partially) this river basin (EPE 2009; SEPLAN 2017).
As the upper Teles Pires basin is of such great economic and agricultural significance for Mato Grosso, a spatiotemporal analysis of land use and land cover is paramount to provide an informed platform for decision making and regional planning. The conducted analysis involved using Geographic Information Systems (GIS) and Remote Sensing (RS) techniques to conduct a systemic and integrated study of the landscape factors.
GIS and RS techniques have been efficiently used to monitor Cerrado and Amazon biomes, as well as to provide significant support for policies and initiatives aimed at sustainable development. An example of this has been Brazil’s Soy Moratorium (SoyM) initiative, which was the first voluntary zero-deforestation agreement implemented in the
tropics, wherein response to pressure from retailers and non-governmental organizations (NGOs), major soybean traders signed the SoyM, agreeing not to purchase soy grown on lands deforested after July 2006 in the Brazilian Amazon (Gibbs et al. 2015). Moreover, the Brazilian National Institute for Space Research (INPE) has also used the aforementioned techniques to produce data on spatial extent of deforestation in the Amazon since 1988 through the Program for Deforestation Monitoring in the Brazilian Legal Amazon (PRODES). Another important initiative is the TerraClass project, which complements PRODES by adding information on land use and its spatial distribution, as well as regional statistics for the deforested areas up to 2008 (Almeida et al. 2016). In addition, the partnership between the Brazilian and Norwegian governments, where Norway agreed to pay US$1 billion to Brazil’s Amazon Fund to finance the reduction of deforestation in the Amazon, has also played a major role in the reduction in land cover change and deforestation-promoting land use in this part of Brazil.
Despite several studies of land use and cover change in the Amazon and Cerrado biomes (Fearnside et al. 2009; Morton et al. 2006; Gibbs et al. 2015; Rudorff et al. 2011) there is still a lack of information on the Teles Pires River basin, a key region for Mato Grosso and Brazilian agriculture. Such studies are crucial for informed strategies for land management and improved planning of agricultural activities in the region.
Thus, the objective of this study was to assess the dynamics of land use and cover change in the the Amazon/Cerrado ecotone of the upper Teles Pires sub-basin from 1986 and 2014, in order to support land management and improve planning of agricultural activities in the basin.
MATERIALS AND METHODS
The study area covered a portion of the Teles Pires River basin, which covers 141,278.62 km2, and links into the Amazon
River basin. The Teles Pires River marks the territorial division between the states of Mato Grosso and Pará (Figure 1) between its outlet to the Tapajós River, and the outlet of the Paranaíta River. The upper Teles Pires sub-basin covers some 37.444 km2, has an average slope of 0.79 m/km-1,and a mean annual
rainfall of 2000 mm. The highest specific average flow of the basin was recorded at 28.14 L s-1 km-2 (the Middle and Lower
Teles Pires report 24.39 L s-1 km-2 and 23.13 L s-1 km-2, on
average, respectively) (EPE 2009).
Colored bands 3 (blue), 4 (green) and 5 (red) were produced by the Landsat-5 satellite, thus providing sharper and improved visual quality, and enabling the visualization and categorization of land cover and its usage (Rizzi and Rudorff 2005). Use of images from Landsat-8, added more spectral bands and allowed the construction of RGB color compositions. For Landsat-8 images, bands 4, 5 and 6 were used to guarantee wavelength correspondence with the Landsat-5 images. Selection was made based upon available image quality, and a lowest degree of cloud cover. Intervals of two years or more are preferred for significant changes to be noted within the study time period (Rozon et al. 2015).
Reflectance corrections were incorporated while preprocessing images to decrease the influence of atmospheric dispersion. For this purpose, the Internal Average Relative Reflectance (IAR) algorithm, available in ENVI 5.0 software, was applied.
The supervised classification was performed with “Classification Workflow” in ENVI 5.0 software, employing 100 training samples (polygons) for each class, which the classifier subdivided for individual characterization of the thematic classes, to produce a final total of 600 samples. Locations and areas of the training samples were kept as similar as possible for all classes, barring slight variations resulting from the relative differences in area and segmentation, as well as the spatial extension of each class (Furtado et al. 2015).
Visual analysis and photo-interpretation of images allowed classification and mapping of landscape elements and facilitated
the multitemporal analysis of land use and occupation according to such elements as color, tone, texture, form, size, presence of shadows, brightness, and location of infrastructure (Tavares et al. 2012, Wan et al. 2015). The agricultural calendar, and the associated annual land use changes for Mato Grosso, was drawn up based on the images collected during the harvest of 2014.
Classes used were: “Agriculture”, “Rainforest”, “Water”, “Pasture” and “Burned”. “Agriculture” was considered to be predominantly regions of annual crops. As the images were recorded between August and September, which is the dry season, with reduced cloud cover, these areas were characterized by fallow (bare ground) areas awaiting the onset of the rains for planting. “Pasture” was the class predominantly associated with pasture; however, this cover class may be also associated with capoeira (secondary vegetation in early stages) and other types of shrub vegetation.
During periods when the atmospheric correction was inadequate to totally rule out the effects of clouds on the satellite image(s), the “Cloud” class was included in the analysis. Additionally, classes with small overall summed areas (e.g. cities, roads and flooded areas) were excluded due to difficulties of gathering a sufficient number of samples. The class was also confounded by small numbers of sample pixels; on such occasions, larger fragments were scanned and areas counted as the locally predominating category (Prado et al. 2007). As a result, though detectable, items such as highways,
ZAIATZ et al. Land use change in the upper Teles Pires River basin
ACTA
AMAZONICA
railways and cities were excluded from the analysis as specific entities or as a class.
Quantification of the rate (%) of homologous variation among the different classes during the study period was conducted using the method of Puyravaud (2003), in line with Equation (1), where A1 and A2 refer to the soil cover at times t1 and t2 (percent per year).
r = (1 / (t2-t1)) * ln (A2 / A1) ( 1 )
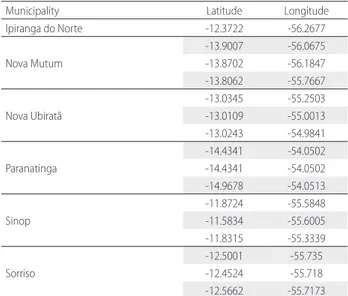
The maps and fields thus generated were compared using accuracy indices, and ground-truthing field checks. Field checks were conducted at 39 locations during 2011, located throughout the Teles Pires basin, 13 of which related to “Pasture”, 16 to “Agriculture”, 8 to “Rainforest” and 2 to “Water”. Of these, 16 were within the upper Teles Pires basin (see Table 1).
To test for accuracy, 100 locations from each class were sampled from the processed satellite images through visual analysis according to the criteria of Panizza and Fonseca (2011), taking these to be true fields to establish that the unbiased results of the analyses did not sample the same locations used as references for classification. After transformation into raster format, points were incorporated into the land use classification. The ranked file for each year was converted to a vector file (shape file) to calculate respective their areas.
The error matrix was generated using the “R” statistical programming language, and included the following parameters: kappa index, overall accuracy, errors of omission and commission, user accuracy, and producer accuracy. The classification quality can be defined based on the following ranges of the Kappa index: bad (< 0.20), acceptable
(0.20–0.40), good (0.41–0.60), very good (0.61–0.80), and excellent (0.81–1.00) (Landis and Koch 1977). According to Congalton (1991) and Ferreira et al. (2005), inferences can cause misunderstanding if they are based solely on the overall accuracy index. In light of these observations, and to achieve greater accuracy in the analysis, producer and user accuracies were also calculated. The producer accuracy index represents the number of pixels correctly classified in a particular category as a percentage of the total number of pixels actually belonging to that category in the image, while the user accuracy indicates how often the class on the map will actually be present on the ground, which is also referred to as ´reliability´. Regarding to commission errors, they reveal the points that were erroneously included in a category. Finally, the degree of linear relationship between the six evaluated classes was also assessed using correlation analysis.
RESULTS
Ten thematic maps were obtained from the pre-processing and supervised classification of the images. These showed changes in land use and land cover in the upper Teles Pires River basin for the years 1986, 1989, 1993, 1996, 1999, 2004 2006, 2009, 2011 and 2014 (Figure 2).
Spectrally more homogeneous classes, like “Rainforest”, showed less overlap with other classes due to the small extent of tonal variation, despite the relatively heterogeneous texture. On comparing the field samples and supervised classification, 100% agreement was found for the “Rainforest” class, and 76.92% and 94.22% for “Pasture” and “Agriculture” classes respectively. Estimates generated from the thematic maps (Figure 3) quantified the areas of each class as a percentage over the study period (1986–2014).
In 1986 land use was mainly represented by “Rainforest”, accounting for 44.06% (15,149.65 km²) of the total upper Teles Pires basin catchment area. A significant change in the “Rainforest” class were visible between 1996 (15,711.7 km²) and 1999 (13,425.8km²), with a decrease of 14.5% in Rainforest cover. A deforestation peak (of 3,316.87 km²) was recorded between 1999 and 2006 (Figure 4).
The “Agriculture” class covered 22.3% of the total area of the river basin in 1986. In 2011, this same class covered 67.8% of the total area, but then dropped to 47.8% in 2014 (Figure 3). The six classes shown in Figure 3 were subjected to correlation tests, which showed a strong negative correlation (r = - 0.71) for both the class pairs of “Agriculture” vs “Pasture” and “Agriculture” vs “Rainforest” (p < 0.001).
The class “Pasture” doubled between 2011 (10.17%) and 2014 (26.11%). This pronounced increase may have been due to the fact that satellite images were collected during the harvest of 2014, which may have resulted in the classification of areas of recently harvested fields as areas of sparse natural vegetation. The class equivalent to “Pasture” also had the
Table 1. Location of the field checks within the upper Teles Pires River basin, Brazil. WGS-84 datum.
Municipality Latitude Longitude
Ipiranga do Norte -12.3722 -56.2677
Nova Mutum
-13.9007 -56.0675 -13.8702 -56.1847 -13.8062 -55.7667 Nova Ubiratã
-13.0345 -55.2503 -13.0109 -55.0013 -13.0243 -54.9841 Paranatinga
-14.4341 -54.0502 -14.4341 -54.0502 -14.9678 -54.0513 Sinop
-11.8724 -55.5848 -11.5834 -55.6005 -11.8315 -55.3339 Sorriso
Figure 2. Maps of land use and cover change in the upper Teles Pires River basin, Brazil, from 1986 to 2014. This figure is in color in the electronic version. highest value in 1993 (14,508.98 km²) and the lowest in
2011 (3,655.88 km²) (Figure 3), with a 37% coefficient of variation (CV) between 1986 and 2014.
The area occupied by the class “Burned” (Figure 5) was highly variable in size across the study period (CV 54.60%). Overall, an increase was observed between 1993 and 2006,
followed by a significant drop in 2011, followed by another rise. The highest incidence of the class “Burned” occurred in 2006 when some 1009.37 km2 (approximately 2.13% of the total area
ZAIATZ et al. Land use change in the upper Teles Pires River basin
ACTA
AMAZONICA
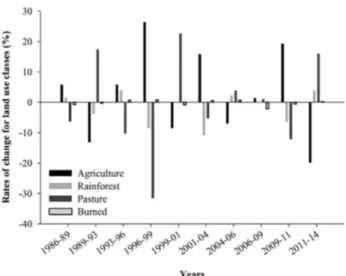
were recorded in the class “Agriculture” between 1996 and 1999 (+ 27.47%), 2009 and 2011 (+ 18.19%), and 2011 and 2014 (-11.62%). Class “Pasture” showed significant variations in the periods 1996–1999 (-29.75%), 1999–2001 (+ 28.06%), 2009–2011 (-36.95%) and 2011–2014 (+ 31.42%). The highest variations in the class “Rainforest” were recorded between 2001 and 2004 (-11.80%), and 2009 and 2011 (-13.18%). However, the greatest increase for this class was recorded between 2011 and 2014 (+ 5.42%). The class “Burned” showed greatest variation in cover between 2006–2011 (-118.37%), and 2011–2014 (+ 45.77%).
For index accuracy, the Kappa and Global Accuracy rates showed values above 80% for the years studied, with the lowest value occurring in 2011 (84%) and highest (99%) in 2004 (Table 2).
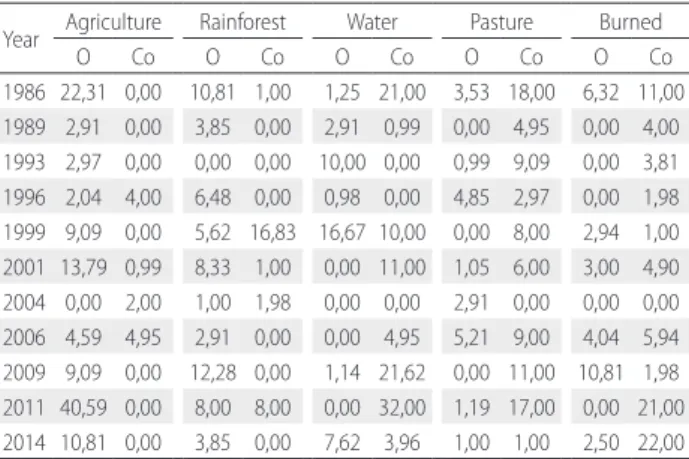
Producer and user accuracies (Table 3) were persistently high, ranging from 59% to 100% (the lower value being for the “Agriculture” class in 2011), and 68 to 100% (the lower value being for the “Water” class in 2011), respectively.
The omission error varied between 0 and 32%, the highest error occurring in the “Water” class in 2011. This implies that about 32% of the points that needed to be classified as water did not correspond to the category in reality, and therefore were omitted. When comparing the classes, the commission error was significantly higher for the “Agriculture” class (40.58%) during 2011 (Table 4).
Figure 6. Rates of change for land use classes in the upper Teles Pires River basin, Brazil, from 1986-2014.
Figure 3. Trends in Agriculture, Rainforest, Water, Pasture and Burned land use classes in the upper Teles Pires River basin, Brazil, from 1986-2014.
Figure 4. Deforestation (+) and reforestation (-) trends in the upper Teles Pires River basin, Brazil, from 1986-2014.
Figure 5. Trends in burned area extent in the upper Teles Pires River basin, Brazil, from 1986-2014.
Table 2. Kappa and overall accuracy indexes for supervised classification in the upper Teles Pires River basin, Brazil, from 1986-2014
1986 1989 1993 1996 1999 2001 2004 2006 2009 2011 2014 Kappa 0,89 0,98 0,97 0,97 0,93 0,91 0,99 0,95 0,93 0,84 0,94 Overall
DISCUSSION
The classes with the greatest coverage in 1986 were “Rainforest” and “Agriculture”, covering 44.06% and 22.22% of the basin, respectively. These two classes showed the highest variation among the studied classes, ranging from 7,655.84 km² to 17,179.55 km² and from 15,149.65 km² to 9,133.645 km², respectively for “Agriculture” and “Rainforest”. The “Rainforest” cover class had the lowest levels of tonal variation, which resulted in less overlap with other classes. This fact may be explained by the lower level of spectral dissimilarity between forest cover across the basin. Since the transition zone between Amazon and Cerrado biomes is characterized by areas of both rainforest and seasonal forest, they may present similar spectral signatures. Studying the structure and classification of seasonal forests and ecotone areas in the state of Tocantins, Haidar et al. (2003) also found similar characteristics between forest cover.
Significant areas with annual crops in stages of vegetative development were not identified, and this nonappearance was
linked to the time of year at which imaging occurred, which coincided with the post-harvest period of crops in the basin under study. Therefore, in some areas vegetative growth of the annual crop might have been mistaken for some degree of pasture degradation. Nascimento et al. (2006) reported a similar issue in their image ratings during an assessment of the efficiency of digital analysis and image processing for identification of the extent of degradation of various grasslands in an area within the Rainforest Zone of Minas Gerais state, Brazil.
Vegetation cover in the basin was observed to have experienced continuous change over the analysed years, resulting from anthropogenic activities in the open areas exploited for agriculture, a situation also reported by Pessoa et al. (2013) in their spatiotemporal analysis of vegetation cover and land use of the Middle Paraguay River Basin in the south region of Mato Grosso. Although several fragment size classes were recorded in this study, all were suppressed due to their small representative areas. This also occurred in the study by Pereira et al. (2014) when analysing spatiotemporal evolution of land use in the Ribeirão Piancó hydrographic basin, in Goiás State, Brazil.
It is worth mentioning that deforestation must be appreciated as a complex phenomenon that does not result from a single factor (Vasconcellos and New 2004). Indirectly, and when bearing in mind the agricultural expansion process in the upper Teles Pires basin, it appears that post-deforestation land was mainly used for livestock (Walker et al. 2013), which supports the fact that between 1986 and 1996 the class “Pasture” showed greatest expansion. With the boost of agriculture in the Cerrado due to the Program for the Modernization of the Agricultural Tractor Fleet and Related Accessories and Harvesters (Moderfrota) launched in 2000, grazing areas were transformed into agricultural land, implying that the shift of rainforest to livestock pasture was one of the major reasons for the deforestation process. This was because the cost involved in converting pasture to agriculture was less than the expense involved in opening up a new area via active deforestation (Brandão et al. 2006). Driven by favorable crop prices, deforested areas are first used mainly for livestock, then converted to areas of agricultural production (annual crops), and, under a scenario of favorable prices of agriculture commodities, and then, finally, to soybean production (Morton et al. 2006). Other studies have also suggested that agriculture and pasture expansion are among the main causes of deforestation in Amazon and Cerrado biomes (Barone et al. 2010; Gibbs et al. 2015; Almeida et al. 2016).
The reduction in deforestation observed after the 1999-2006 peaks reflects the dramatic decrease in deforestation resulting from the Soy Moratorium (SoyM) (Gibbs et al. 2015) (see Figure 4). After SoyM, deforestation associated with soy production had, at least up until 2014, dropped dramatically (Gibbs et al. 2015).
Table 3. Producer (Pro) and user (Usu) accuracy indexes for supervised classification in the upper Teles Pires River basin, Brazil, from 1986-2014
Year Agriculture Rainforest Water Pasture Burned Usu Pro Usu Pro Usu Pro Usu Pro Usu Pro 1986 100 77,69 99,00 89,19 79,00 98,75 83,00 97,65 89,00 93,68 1989 100 97,09 100 96,15 99,01 97,09 95,05 100 96,00 100 1993 100 97,03 100 100 100 90,00 90,91 99,01 96,19 100 1996 96 97,96 100 93,52 100 99,02 97,03 95,15 98,02 100 1999 100 90,91 83,17 94,38 90,00 83,33 92,00 100 99,00 97,06 2001 99,01 86,21 99,00 91,67 89,00 100 94,00 98,95 95,10 97,00 2004 98,00 100 98,02 99,00 100 100 100 97,09 100 100 2006 95,05 88,07 100 97,09 95.05 100 91,00 94,79 94,06 95,96 2009 100 90,91 100 87,72 78,38 98,86 89,00 100 98,02 89,19 2011 100 59,41 92,00 92,00 68,00 100 83,00 98,81 79,00 100 2014 100 89,19 100 96,15 96,04 92,38 99,00 99,00 78,00 97,50
Table 4. Omission (O) and commission (Co) errors for supervised classification in the upper Teles Pires River basin, Brazil, from 1986-2014
Year Agriculture Rainforest Water Pasture Burned
O Co O Co O Co O Co O Co
ZAIATZ et al. Land use change in the upper Teles Pires River basin
ACTA
AMAZONICA
The class “Burned” is fundamentally related to favorable weather conditions and human activities. Burning is often justified by the direct initial conversion of rainforest land to pasture as, after a few years, pasture land drops in quality, and thus the operation of repeated fire cycles is frequently considered to be a “good” management practice in such regions (Alves et al. 2003). Assessing the biomass burning areas, Cardozo et al. (2016) identified a similar trend in Rondônia State between 2000 and 2011. The dynamics of this land management practice also explains the burning trends observed in the current study.
In their study of the role of agricultural prices and government policies in the recent deforestation in the Legal Amazon, Ferreira and Coelho (2015) reported a significant decrease in the rainforest area, most obvious from 2001, and proposed that deforestation results from an increase in the prices of agricultural products, especially soybean, which reached its highest value in 2004. These authors also emphasized that more consistent and focused command and control policies, such as field inspections, economic embargos and credit restriction on farmers who were noncompliant with environmental laws, played an important role in decreasing deforestation, especially in Mato Grosso, an opinion shared by Almeida et al. (2016), Aubertin (2015) and Sayer and Cassman (2013).
Although correlation does not explain possible causal relations, it did reveal the dissimilarity between the class pairs of “Agriculture” vs “Pasture”, and “Agriculture” vs “Rainforest”. A study of the dynamics of land use in a watershed in the state of Rio Grande do Sul between 1964 and 2005, reported similar results, with a drop in the area covered by native rainforest and an increase in the classes corresponding to agriculture (Lopes et al. 2010).
According to our Kappa statistic values, the classification performance level in the current study can be classed as ‘excellent’ (Landis and Koch 1977). Consequently, the methodology used to analyze the dynamics of land use and occupation in the upper Teles Pires River basin was appropriate, and could make a viable contribution towards a clearer understanding of this subject in the agricultural border region between the Amazon and Cerrado biomes in the state of Mato Grosso. Additionally, producer and user accuracies were persistently high, indicating that this mapping unit possessed a high number of accurately classified points in the digital map (producer), and the probability that the unit shown on the map actually matched the ground reality was high (user). Finally, the significantly higher value of the commission error for “Agriculture” class (40.58%) during 2011 may be explained by the contribution of pixels of all classes that were similar to the spectral results of the “Agriculture” class (i.e., “contamination” by the same pixel form in different classes).
CONCLUSIONS
In this study the spatial and temporal dynamics of land use and cover of the Upper Teles Pires River basin, in the Cerrado/Amazon transition zone, were evaluated for the period 1986-2014, and the wide expansion of the agricultural area and data paucity were considered. Forest cover in the upper Teles Pires basin has suffered intense anthropization during the study period, and represented the class with the greatest percent reduction in area. The expansion of new areas, primarily for pasture and later agriculture (which increased 25.53% between 1986 and 2014), was the main driver in forest clearing in the upper Teles Pires basin. The GIS and remote sensing techniques used in this study in the supervised classification allow a better understanding of how the landscape cover has changed. Furthermore, this approach provided a rapid and economical way to observe and measure the dynamics of land use and cover change in the basin, which is of critical importance for policy- and decision-makers in the planning of natural resource management in this crucial agriculture frontier. Accuracy indices in this study were above 0.84 for all the years studied for the Kappa index and overall accuracy, and could therefore be rated excellent on the Landis and Koch scale. Producer and user accuracy rates were high, with the minimum values being 59.4% and 68%, respectively, both values having been recorded in 2011. Omission and commission errors ranged from 0 to 32% and from 0 to 40.5%, respectively, with the classes “Water” and “Agriculture” showing highest error values in 2011. Further studies addressing land use and cover changes, climate change scenarios and water resources availability are in progress and will serve to support improved agricultural and natural resource management in the region.
ACKNOWLEDGEMENTS
The authors thank Embrapa Agrossilvipastoril, Universidade Federal do Mato Grosso (UFMT) through the Programa de Pós-Graduação em Agronomia (Campus Sinop), Fundação de Amparo à Pesquisa do Estado do Mato Grosso (FAPEMAT), and the referees and journal editors for their suggestions and assistance.
REFERENCES
Aubertin, C. 2015. Deforestation control policies in Brazil: sovereignty versus the market. Forests, Trees and Livelihoods, 24: 147-162. Almeida, C.A.De.; Coutinho, A.C.; Esquerdo, J.C.D.M.; Adami,
M.; Venturieri, A.D. Cesar G. et al. 2016. High spatial resolution land use and land cover mapping of the Brazilian Legal Amazon in 2008 using Landsat-5/TM and MODIS data. Acta Amazonica, 46: 291–302.
Barone, E.; Ramankutty, N.; Hyman, G.; Coomes, O.T. 2010. The role of pasture and soybean in deforestation of the Brazilian Amazon. Environmental Research Letters, 5: 1-9.
Beuchle, R.; Grecchi, R.C.; Shimabukuro, Y.E.; Sellinger, R.; Eva, H.D.; Sano, E.; Achard, F. 2015. Land cover changes in the Brazilian Cerrado and Caatinga biomes from 1990 to 2010 based on a systematic remote sensing sampling approach. Applied Geophysics, 58: 116-127.
Brandão, A.S.P.; Rezende, G.C.D.; Marques, R.W.D.C. 2006. Crescimento agrícola no período 1999/2004: a explosão da soja e da pecuária bovina e seu impacto sobre o meio ambiente. Economia Aplicada, 10: 249-266.
Cardozo, F. da Silva.; Pereira, G.; Shimabukuro, Y. E.; Moraes, E. C. 2016. Avaliação das áreas queimadas no estado de Rondônia - Amazônia Brasileira. Revista Brasileira de Cartografia, 66: 705-716. Coelho, V.H.; Montenegro, S.M.; Almeida, C.D.N.; Lima, E.R.;
Neto, A.R.; Moura, G.S. 2014. Dinâmica do uso e ocupação do solo em uma bacia hidrográfica do semiárido brasileiro. Revista Brasileira de Engenharia Agrícola e Ambiental, 18: 64-72. Congalton, R.G. 1991. A review of assessing the accuracy of
classifications of remotely sensed data. Remote Sensing of Environment, 37: 35-46.
De Castro, P.A.; Fonseca, F.P. 2011. Técnicas de interpretação visual de imagens. GEOUSP: Espaço e Tempo (Online), 30: 30-43. Empresa de Pesquisa Energética, EPE—. 2009. Avaliação Ambiental
Integrada da Bacia Hidrográfica do rio Teles Pires. Relatório Final—Sumário executivo. CONCREMAT (http://www.epe.gov. br/MeioAmbiente/Documents/AAI%20Teles%20Pires/AAI%20 Teles%20Pires%20-%20Relat%C3%B3rio%20Final%20-%20 Sum%C3%A1rio%20Executivo.pdf ). Acessed on 19/09/2015. Dos Santos, D.I.P.; De Oliveira, A.É.; Pagani, C.H.H.P.; De Araújo,
M.E.B. 2015. Análise multitemporal de uso e ocupação do solo do núcleo inicial do projeto integrado de colonização Paulo de Assis Ribeiro no município de Colorado do Oeste-RO. Caderno de Geografia, 25: 34-51.
Fearnside, P.M.; Righi, C.A.; de Alencastro G.P.M.L.; Keizer, E.W.; Cerri, C.C.; Nogueira, E.M.; Barbosa, R.I. 2009. Biomass and greenhouse-gas emissions from land-use change in Brazil’s Amazonian “arc of deforestation”: The states of Mato Grosso and Rondônia. Forest Ecology and Management, 258: 1968-1978. Ferreira, E.; Santos, J.P.; Barreto, A.C.; Dantas, A.A.A. 2005.
Identification of small areas of semideciduous forest, by different analysts, in Lavras region, MG, using LANDSAT and
Cberssattelites images.Ciência e Agrotecnologia, 29: 649-656.
Ferreira, M.D.P.; Coelho, A.B. 2015. Desmatamento Recente nos Estados da Amazônia Legal: uma análise da contribuição dos preços agrícolas e das políticas governamentais. Revista de Economia e Sociologia Rural, 53: 91-108.
Forster, P.V.; Ramaswamy, P.; Artaxo, T.; Berntsen, R.; Betts, D.W.; Fahey, J.; et al. 2007. Changes in Atmospheric Constituents and in Radiative Forcing. In: Solomon, S.; Qin, D.; Manning, M.; Marquis, M.; Averyt, K.; Tignor, M.M.B.; Miller Jr, H.L.; Chen, Z.. (Ed.). Climate Change 2007: The Physical Science Basis. Contribution of Working Group I to the Fourth Assessment Report of the Intergovernmental Panel on Climate Change. Cambridge University Press, Cambridge and New York, p.129-234.
Furtado, L.F.D.; Silva, T.S.F.; Fernandes, P.J.F.; Novo, E.M.L.D.M. 2015. Land cover classification of Lago Grande de Curuai floodplain (Amazon, Brazil) using multi-sensor and image fusion techniques. Acta Amazonica, 45: 195-202.
Geist, H.J.; Lambin, E.F. Proximate causes and underlying driving forces of tropical deforestation. 2002. Bioscience, 52: 143–150. Gibbs, H.K.; Rausch, L.; Munger, J.; Schelly, I.; Morton, D.C.;
Noojipady, P. et al. 2015. Environment and development. Brazil’s Soy Moratorium. Science, 347: 377–378.
Haidar, R.F; Fagg, J.M.F.; Pinto, J.R.R.; Dias, R.R.; Damasco, G.; Silva, L.C.R.; Fagg, C.W. Florestas estacionais e áreas de ecótono no estado do Tocantins, Brasil: parâmetros estruturais, classificação das fitofisionomias florestais e subsídios para conservação. Acta Amazonica, 43: 261-290.
Klink, C.A.; Moreira, A.G. 2002. Past and current human occupation and land use. In: Oliveira, P.S.; Marquis, R.J. (Ed.). The Cerrados of Brazil: ecology and natural history of a Neotropical savanna. Columbia University Press, New York, p.69-88.
Landis, J.R.; Koch, G.G. 1977. The measurement of observer agreement for categorical data. Biometrics, 33: 159-174. Lopes, F.; Mielniczuk, J.; Bortolon, E.S.O.; Tornquist, C.G. 2010.
Evolução do uso do solo em uma área piloto da região de Vacaria, RS. Revista Brasileira de Engenharia Agrícola e Ambiental, 14: 1038-1044.
Machado, R.B.; Ramos Neto, M.B.; Pereira, P.G.P.; Caldas, E.F.; Gonçalves, D.A.; Santos, N.S.; Tabor, K.; Steininger, M. 2004. Estimativas de perda da área do Cerrado brasileiro. Conservação Internacional, Brasília, 22p.
Machado, N.G.; dos Santos, G.V.L.M. 2013. Usos do solo no divisor de águas das Bacias Amazônica e Do Alto Paraguai–Mato Grosso, Brasil. Profiscientia, 4: 227-238.
Marchetti, D.A.B.; Garcia, G.J. 1977. Princípios de fotogrametria e fotointerpretação. Livraria Nobel, São Paulo. 720p.
Morton, D.C.; De Fries, R.S.; Shimabukuro, Y. E.; Liana, O.A.; Arai, E.; del Bon Espirito-Santo.; Freitas, R.; Merisette, J. 2006. Cropland expansion changes deforestation dynamics in the southern Brazilian Amazon. Proceedings of the National Academy of Sciences, 103: 14637-14641.
Nascimento, M.C.; Riva, R.D.; Chagas, C.D.S.; Oliveira, H.D.; Dias, L.E.; Fernandes Filho, E.I.; Soares, V.P. 2006. Uso de imagens do sensor ASTER na identificação de níveis de degradação em pastagens. Revista Brasileira de Engenharia Agrícola e Ambiental, 10: 196-202.
Oliveira, C.M.D., & Santana, A.C.D. 2012. A governança no Arranjo Produtivo de Grãos de Santarém e Belterra, estado do Pará: uma análise a partir do grão soja. Revista de Economia e Sociologia Rural, 50: 683-704.
Pereira, L.S.; Gonçalves, B.B.; Silva Neto, C.D.M.; Ferreira, S.A.L. 2014. Evolução espaço-temporal do uso e cobertura da terra do ribeirão Piancó em Anápolis–Go. Revista Mirante, 7: 1-15. Pessoa, S.P.M., Galvanin, E.A.D.S., Kreitlow, J.P., Neves, S.M.A.D.S.,
ZAIATZ et al. Land use change in the upper Teles Pires River basin
ACTA
AMAZONICA
Prado, R.B.; Novo, E.M.L.M.; Pereira, M.N. 2007. Avaliação da dinâmica do uso e cobertura da terra na bacia hidrográfica de contribuição para o reservatório de Barra Bonita-SP. Revista Brasileira de Cartografia, 59: 127-135.
Probio, 2007. Mapeamento da cobertura vegetal do bioma cerrado. Relatório Final. - Projeto de Conservação e Utilização Sustentável da Diversidade Biológica Brasileira (Probio). Ministério do Meio Ambiente (MMA), Brasília. 93p.
Puyravaud, J.P. 2003. Standardizing the calculation of the annual rate of deforestation. Forest Ecology and Management, 177: 593-596. Rizzi, R.; Rudorff, B.F.T. 2005. Estimativa da área de soja no Rio
Grande do Sul por meio de imagens LANDSAT. Revista Brasileira de Cartografia, 57: 226-234.
Rozon, C.; Lucotte, M.; Davidson, R.; Paquet, S.; Oestreicher, J.S.; Mertens, F.; Passos, C.;J.S.; Romana, C. 2015. Spatial and temporal evolution of family-farming land use in the Tapajós region of the Brazilian Amazon. Acta Amazonica, 45: 203-214. Rudorff, B.F.T.; Adami, M.; Aguiar, D.A.; Moreira, M.A.; Mello, M.P.; Fabiani, L.; Amaral, F.A.; Pires, B.M. 2011.The soy moratorium in the Amazon biome monitored by remote sensing images. Remote Sensing, 3: 185-202.
Sano, E.E.; Rosa, R.; Brito, J.L.S.; Ferreira, L.G. 2008. Notas científicas mapeamento semidetalhado do uso da terra do Bioma Cerrado. Pesquisa Agropecuaria Brasileira, 43: 153-156.
This is an Open Access article distributed under the terms of the Creative Commons Attribution License, which permits unrestricted use, distribution, and reproduction in any medium, provided the original work is properly cited.
Sayer, J.; Cassman, K.G. 2013. Agricultural innovation to protect the environment. Proceedings of the National Academy of Sciences, 110: 8345-8348.
Seplan, Secretaria de Estado de Planejamento. 2017. PIB Mato Grosso e Municípios. (http://www.seplan.mt.gov.br/-/3934855-pib-mato-grosso-e-municipios). Accessed on 06/06/2017. Tavares, A.O.; Pato, R.L.; Magalhães, M.C. 2012. Spatial and
temporal land use change and occupation over the last half century in a peri-urban area. Applied Geography, 34: 432–444. Theodoro, S.H. 2002. Conflitos e uso sustentável dos recursos naturais.
Garamond, Rio de Janeiro. 288p.
Walker, N.F.; Patel, S.A.; Kalif, A.B. 2013. From Amazon pasture to the high street: deforestation and the Brazilian cattle product supply chain. Tropical Conservation Science, 3:446-467. Wan, L.; Zhang, Y.; Zhang, X.; Qi, S.; Na, X. 2015. Comparison of
land use/land cover change and landscape patterns in Honghe National Nature Reserve and the surrounding Jiansanjiang Region, China. Ecological Indicators, 51: 205-214.
RECEIVED: 29/06/2017