E-mail: [email protected]
Maximum discharge and probable rainfall at Aiuruoca basin, Minas
Gerais State
doi: 10.4136/ambi-agua.1312
Received: 11 Feb. 2014; Accepted: 30 May 2014
Leandro Campos Pinto*;Pedro Luiz Terra Lima; Zélio Resende de Souza
Universidade de Lavras (UFLA), Lavras, MG, Brasil Departamento de Ciência do Solo
*Corresponding author: e-mail:[email protected], [email protected], [email protected]
ABSTRACT
Research on rainfall and annual daily maximum discharge rates is essential to support decisions during the design of hydraulic structures. This study tested the adequacy of probability functions to predict the probable rainfall and discharge rates of the Aiuruoca River Basin in Minas Gerais State in Brazil. This basin is very important as starting point of the Rio Grande Basin that eventually discharges into the Parana River in the southern region of Brazil at the border with Argentina. It was found that the log-normal two parameters probability function provided the best fit to historical monthly rainfall series. For example, in the month of January, there is a 75% probability that 201 mm of rainfall will occur. This is the month with the highest volume of rainfall in the region. On another hand, for flow rate, the best fit was provided by the log-normal distribution with three parameters.
Keywords: probability distribution, Log-Normal, Gamma distribution, water resources planning.
Estudo de vazões máximas e precipitação provável para a região de
Aiuruoca, Minas Gerais
RESUMO
Rev. Ambient. Águavol. 9 n. 2 Taubaté – Apr. / Jun. 2014
de vazões do Rio Aiuruoca foi melhor ajustada pela distribuição Log-Normal de três parâmetros.
Palavras-chave: distribuição de probabilidades, Log-Normal, distribuição Gamma, planejamento de recursos hídricos.
1. INTRODUCTION
Flooding events have become more evident in Brazil as population grows and occupies
the river margins ear the water’s edge, which can result in considerable losses in terms of life
and property damage. A better understanding of rainfall and flow behavior can help engineers design hydraulic structures and can also help government to plan urban growth. While minimum discharge rates are important in determining water scarcity and availability, maximum discharge rates are very important to determine flood risks.
When measured regularly for long periods, the flow rates can be used to generate probability models that can help to predict future events. Such procedures commonly involve time series analysis and the fitting of probability distribution functions (Tucci, 1993). Similar observations were published by Haan (2002) and Douglas and Vogel (2006) when these authors suggested statistical analysis through probability studies and/or stochastic analysis.
According to Silvino et al. (2007), water ceased to be a free commodity and started to have economic value as shortage became common. Thus, available water quantity variation over the years is very important, mainly because it has been impacted by environmental changes, such as deforestation, long-term single crops, fire, and others.
Water quantity is also highly important for designing hydraulic projects, city supplies, irrigation, power generation, etc. Therefore, maximum discharge estimation associated to rainfall data analysis is critically important to the cost and safety of engineering projects.
According to Mesquita et al. (2009), knowledge of rainfall is also important for hydraulic projects in rural areas, so that structures can be built to properly withstand projected rainfalls. These authors state that such knowledge is necessary for planning terracing systems, road drainage and also for the release of water stored at dams for flood mitigation, among others applications.
Aiuruoca River is one of the most important tributaries of the Grande River and its water is used to maintain the Camargos Reservoir, generating 45 megawatts of electricity and contributing downstream to the Itutinga and Funil Reservoirs that generate, respectively, 52 and 180 megawatts. Camargos Lake has a total storage capacity of 792 billion liters of water.
Therefore, this research aimed to identify and compare the adequacy of probability distribution functions applied to discharge rates at the Aiuruoca River and probable rainfall at the basin, in order to determine the best statistical distribution to predict rainfall and discharge rates.
2. MATERIAL AND METHODS
Discharge and rainfall data were obtained from the Hidroweb Service, managed by the Brazilian National Water Agency –“Agência Nacional das Águas” (ANA, 2007).
Rainfall data at Aiuruoca City was obtained from the pluviometric station coded as
The climate at the basin is classified as Cwb near the top of the basin, near Serra of Mantiqueira, where the pluviometric index exceeds 2,300 mm, and as Cwa at the largest catchment portion, that presents annual average rainfall of approximately 1,500 mm, being 80% of which is rain during the summer season. The average annual temperature is 18oC (Viola et al., 2009; Figure 1).
Figure 1. Aiuruoca River catchment location, Minas Gerais, Brazil.
Nota: Adapted from Viola et al. (2009).
Rainfall and discharge time series were fitted to the following distributions: a) Log-Normal 2 parameters distribution
Log-Normal 2 parameters distribution is described by Naghettini and Pinto (2007) as Probability Density Function (PDF) (Equation 1).
2
) ( . 5 , 0
. 2 . .
1 )
(
:
n
n x Ln e n
x X f
FDP
(1)
where:
μn and σn are distribution parameters, corresponding to average and standard deviation of
logarithms values of variables (rainfall or flow rate). The basic equation used for hydrological studies using Log-Normal 2 parameters distribution is adapted from the general equation of Ven te Chow (Haan, 2002; Equation 2).
TR
K n n TR e
Rev. Ambient. Águavol. 9 n. 2 Taubaté – Apr. / Jun. 2014
where:
XTRis the hydrologic variable value (rainfall) associated to return period (RP) and
KTR is the reduced variable.
b) Log-Normal 3 parameters distribution
The function has its PDF presented by Equation 3.
2
5 , 0 . . 2 . . 1 ) ( : n n x Ln e n x x f PDF
(3)
And its parameters estimated by Equations 4 -7 following Naghettini and Pinto (2007).
y n n
(4)
3 1 3 2 1
y (5)
2 40,5
2
y y
(6)
3 . 2 . 1 s x x n n n y n i i
(7)
The procedure for estimating values starts primarily by calculating the y value
(Equation 7), considered as the distribution asymmetry. Then, ø is estimated by Equation 6,
ηy by Equation 5 and, based on this last value and on average (μn) and standard deviation (σn)
of data transformed into logarithms, parameter β is estimated by Equation 4. At this point, the basic equation for hydrologic variable estimation is given by Haan (2002); Equation 8.
nK n TR
TR
e
X . (8)
c) Gamma distribution
Incomplete Gamma distribution is defined, according to Lanna (2001), by integral equations such as Equations 9-11.
0
1 , >0
dx e
x x (9)
x xdx e x x P 0 1 ,
(10)
x x dx e x x P 0 1 ,
(11)
x
e x x
f PDF
x 0 , . . ) ( .
1 )
(
: 1
(12)
where:
ν > 0, β > 0, Γ(ν) > 0, which
ν is a dimensionless form parameter,
β is a scale parameter and
x a random variable (rainfall).
Parameters ν and β can be estimated by Equations 13 and 14.
2 2
x s
x
(13)
x sx2
(14)
where:
x is arithmetic mean of data series and
Sx the standard deviation.
In order to evaluate the accuracy of the fitting of distribution statistical functions at all of the periods evaluated, Kolmogorov-Smirnov and chi-square (χ2) tests were performed at a 5% significance level, as suggested by Ferreira (2005) and Naghettini and Pinto (2007).
The Kolmogorov-Smirnov test is performed by comparing the maximum deviation (absolute value) resulting from the difference between the observed values and the predicted frequencies and comparing it to tabulated values based on sample size and significance level. In the chi-square test, a comparison is made between the sum of the squared deviations between observed and estimated frequencies (λ²calculated) to a table value (λ²tabulated), according to the number of degrees of freedom (number of classes - number of parameters -1) and significance level. The number of classes was obtained by the square root of the number of values. To consider the probability function as adequate, the calculated values have to be equal or lower than tabulated values for each test.
Probable rainfall data were estimated for each period using distribution function that presented the lowest value of χ2, at probability levels exceeded by 75, 85 and 95%, corresponding, respectively, to return periods of 4, 7 and 20 years. According to Walpole and Myers (1978), the distribution function that presented the lower χ2 value can be considered the most precise to estimate values.
3. RESULTS AND DISCUSSION
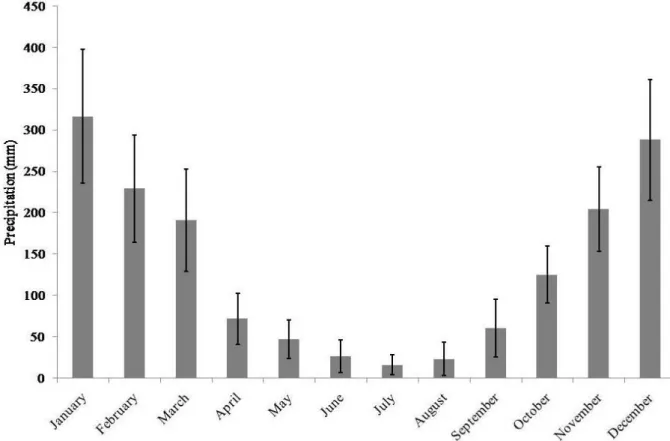
Rainfall monthly values (mm) at Aiuruoca River, Minas Gerais, Brazil, are presented at Figure 2. Average annual rainfall is 1,603.0 mm.
Rev. Ambient. Águavol. 9 n. 2 Taubaté – Apr. / Jun. 2014
Figure 2. Rainfall monthly distribution (mm) of Aiuruoca Region, MG, Brazil (monthly average from 1944 to 2007).
Analysis of probability distribution functions from the Kolmogorov-Smirnov test (KS) (Table 1) revealed that a good fit during the dry season (June to September) was not obtained, mainly by Log-Normal 2 parameters and Gamma distributions.
Table 1. Adequacy of probability distributions by the KS test.
Month Log-Nomal 2P Log-Normal 3P Gamma
January A A A
February A A A
March A A A
April A A A
May A A A
June NA A NA
July NA NA NA
August NA NA NA
September NA A NA
October A A A
November A A A
December A A A
A= Adequate; NA= non-adequate.
Gamma distribution, which presented several inadequate periods (April to September, and November). The inadequacy of Gamma distribution by χ2 test during the driest season of the year also occurred when the period analyzed was November. In fact, Sampaio et al. (1999), using the Log-Normal 2 parameters distribution to calculate probable rainfall at Lavras (130 km far from Aiuruoca Basin), MG state, Brazil, observed that this distribution adequately fits data only during the rainy season.
Junqueira Júnior et al. (2007), analyzing probable rainfall to Madre de Deus Region (85 km far from Aiuruoca), at Minas Gerais State, Brazil, stated that the Log-Normal 3 parameters distribution was the most adequate to fit the data series monthly.
Dourado Neto et al. (2005) tested probability distribution functions to fit the daily rainfall time series in Piracicaba, Brazil, and found that the Gamma distribution is the most adequate.
Table 2. Chi-square test (χ2) to Log-Normal 2 parameters, Log-Normal 3 parameters and Gamma distributions to montlhy rainfall to Aiuruoca Basin, MG, Brazil.
Months Jan Feb Mar Apr May Jun Jul Aug Sep Oct Nov Dec
Log 2P 0.05A 0.09A 0.05A 0.61A 1.24 A 5.19A 5.55A 5.58A 2.93A 0.60A 2.35A 0.47A
Log 3P 0.47A 0.54A 0.70A 0.48 A 0.38A 0.18A 0.71A 1.76A 0.86A 0.71A 1.43A 1.61A
Gamma 3.89A 5.47A 6.45A 10.28NA 11.92NA 28.59NA 19.68NA 32.71NA 18.54NA 7.36A 8.23NA 7.41A Nota: A= Adequate; NA= non-adequate.
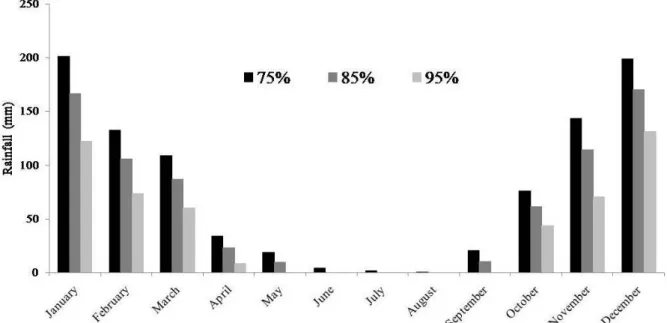
Probable monthly rainfall associated to probability levels of 75, 85, and 95%, estimated based on the best probability distribution, according to Table 2, is presented at Figure 3.
Figure 3. Probable monthly rainfall of Aiuruoca Region, MG, Brazil, with 75, 85, and 95% probability level.
Rev. Ambient. Águavol. 9 n. 2 Taubaté – Apr. / Jun. 2014
helpful for engineers to plan hydraulic projects, to manage irrigation and drainage, to estimate soil erosion, and for other purposes.
Statistical adequacy analysis from KS and χ2 tests to Aiuruoca River discharge rate series can be seen in Table 3. The Log-Normal 3 parameters presented a better fit of the Aiuruoca River discharge series, due to its lower value of χ2.
Table 3. Statistical adequacy analysis results of probability distribution to Aiuruoca River discharge series.
Test Log-nomal 2P Log-Normal 3P Gamma
KS 0.05A 0.05A 0.53NA
χ2 0.02A 0.01A 1.89A
Nota: A= Adequate; NA= non-adequate.
It is possible to state from Figure 4 the good fit of Log-Normal 3 parameters distribution, being this PDF recommended to be used to predict annual daily maximum discharge rates.
Figure 4. Log-Normal 3P distribution applied to annual maximum discharge historical series of Aiuruoca River.
4. CONCLUSIONS
The Log-Normal 2 parameters probability distribution function presented the best fitting for monthly rainfall time series at the Aiuruoca Basin, MG, Brazil.
In order to fit discharge rates, the Log-Normal 3 parameters distribution function appears to be more accurate than the same function with two parameters.
5. REFERENCES
BOTELHO, V. A. Ajuste da distribuição de probabilidade gamma aos dados de precipitação para a região de Lavras, MG. 1989. 98 f. Dissertação (Mestrado) - Universidade Federal de Lavras, Lavras, 1989.
DOUGLAS, E. M.; VOGEL, R. M. Probabilistic behavior of floods of Record in the United States. Journal of Hydrologic Engineering, v. 11, p. 482-488, 2006. http://dx.doi.org/10.1061/(ASCE)1084-0699(2006)11:5(482)
DOURADO NETO, D.; ASSIS, J. P.; TIMM, L. C.; MANFRON, P. A.; SPAROVEK, G.; MARTIN, T. N. Ajuste de modelos de distribuição de probabilidade a séries históricas de precipitação pluvial diária em Piracicaba-SP. Revista Brasileira de Agrometeorologia, Piracicaba, v. 13, n. 2, p. 273-283, 2005.
FERREIRA, D. F. Estatística básica. Lavras: UFLA, 2005. 654 p.
HAAN, C. T. Statistical methods in hydrology. 2. ed. Ames: Iowa State University, 2002. 377 p.
JUNQUEIRA JUNIOR, J. A.; GOMES, N. M.; MELLO, C. R. ; SILVA, A. M. da. Precipitação provável para a região de Madre de Deus, Alto Rio Grande: modelos de probabilidades e valores característicos. Ciência e Agrotecnologia, v. 31, p. 842-850, 2007. http://dx.doi.org/10.1590/S1413-70542007000300034
LANNA, A. E. Elementos de estatística e probabilidade. In: TUCCI, C. E. M. Hidrologia: ciência e aplicação. 2. ed. Porto Alegre: ABRH; UFRGS, 2001. p. 79-176.
MESQUITA, W. O.; GRIEBELER, N. P.; OLIVEIRA, L. F. C. Precipitações máximas diárias esperadas para as regiões central e sudeste de Goiás. Pesquisa Agropecuária Tropical, Goiânia, v. 39, n. 2, p.73-81, 2009.
NAGHETTINI, M.; PINTO, E. J. A. Hidrologia estatística. Belo Horizonte: CPRM, 2007. 552p.
SAMPAIO, S. C.; CORRÊA, M. M.; SOUZA, M. R.; GUIMARÃES, J. C.; SILVA, A. M. Precipitação provável para o Município de Lavras, MG, utilizando a distribuição log-normal. Ciência e Agrotecnologia, Lavras, v. 23, n. 2, p. 382-389, 1999.
SILVINO, A. N. O.; SILVEIRA, A.; MUSIS, C. R.; WYREPKOWSKI, C. C. Determinação de vazões extremas para diversos períodos de retorno para o Rio Paraguai utilizando métodos estatísticos. Geociências, São Paulo, v. 26, n.4, p. 369-378, 2007.
TUCCI, C. E. M. Hidrologia: ciência e aplicação. [S.l.]: EDUSP; Editora da UFRGS; ABRH, 1993. 952p.
VIOLA, M. R.; MELLO, C. R. DE; ACERBI JÚNIOR, F. W.; SILVA, A. M. Modelagem hidrológica na Bacia Hidrográfica do Rio Aiuruoca, MG. Revista Brasileira Engenheira Agrícola e Ambiental, v. 13, p. 581-591, 2009. http://dx.doi.org/10.1590/S1415-43662009000500011