ISSN 0101-2061 Food Science and Technology
DI:
D http://dx.doi.org/10.1590/1678-457X.36016
1 Introduction
Bee pollen is a nutrient collected from various flowering plants by bees and stored and brought to the beehive in their back legs (Dagaroglu, 2004). Bees use the pollen as the primary source of nutrition for their nourishment. It is constituted of the bee’s oral secretions and some nectar. The main difference between bee pollen and flower pollen is that bee pollen is diluted with nectar, saliva and honey (Campos et al., 2008; De-Melo et al., 2015). Therefore, the mineral level in flower pollen is higher than mineral levels in bee pollen (Stanciu et al., 2011).
Bee pollen is used in apitherapy with particular emphasis placed on its antioxidant and antimicrobial properties. Its structure contains various enzymes, co-enzymes, steroids, vitamins, antibiotics, mineral substances and flavonoids (Bogdanov, 2006; Pascoal et al., 2014). 100g of bee pollen contains; 500-3000 mg mineral substances, 13-55 g carbohydrates, 10-40 g protein, 1-10 g fat, 0.3-20 g dietary fibre, 20-100 mg vitamins and 40-3000 mg flavonoid glycosides (Bogdanov, 2006). Daily mineral requirement in human nutrition has been reported as; Ca: 0.8-0.9 g, P: 0.8-1.2 g, K: 800 mg, Mg: 300-400 mg, Mn: 4-5 mg, Fe: 10-20 mg, Zn: 6-22 mg, Cu: 1-3 mg, Se: 60-120 µg, Ni: 15-25 µg (Demirci, 2014; Tayar & Cibik, 2011). Bee pollen is a good source of mineral for humans (Dagaroglu, 2004; Morgano et al., 2010). When pollen, propolis and honey were compared with respect to Fe, Zn and Mg mineral levels, the highest ratios were reported to be found in pollen. Bee pollen has been evaluated to be rich
regarding its Mg and Zn ratio, and high with respect to its Fe ratio (Formicki et al., 2013).
Alongside its nutritional value, bee pollen may also contain toxic elements (Bogdanov, 2006). Due to environmental contamination; heavy metals, radioactive isotopes, organic contaminants, pesticides, antibiotics and pathogenic microorganisms may be present in the air, soil, water and plants, and spread to bee pollen via these routes. Among heavy metals, Pb and Cd may have industrial origin as well as being present in the pesticide compound (Bogdanov, 2006; Campos et al., 2008). Arsenic may be present in many environmental sources such as; rocks, soil, water, dust and air. It has been reported that air and water play an important role in As contamination (Morgano et al., 2010).
It has been stated that, bee and bee products may be used as a bioindicator in determining environmental pollution and presence of heavy metals (Nispet et al., 2013). To collect pollen, bees roam an area with an average diameter of 7-13 km and approximately 80-100 flowers. Therefore, bees in the hive interact with approximately one million flowers (Dagaroglu, 2004; Nispet et al., 2013). For optimum pollen quality, pollen must be collected from areas at least 3 km away from the source of contamination (Bogdanov, 2006; Campos et al., 2008).
Turkey has an ecosystem suitable for apiculture. In Turkey, apiculture products are gaining importance due to an increasing demand for natural products as well as a long-standing apiculture
Mineral element and heavy metal (cadmium, lead and arsenic) levels of
bee pollen in Turkey
Sema Sandikci ALTUNATMAZ1*, Duygu TARHAN2, Filiz AKSU1, Umıt Bora BARUTÇU2, Mehmet Erman DR3
Received 14 Dec., 2016 Accepted 23 Jan., 2017
1Food Technology Programme, Food Processing Department, Faculty of Veterinary Medicine Vocational High School, Istanbul University, Avcilar, Istanbul, Turkey 2Department of Biophysics, Cerrahpasa Medicine Faculty, Istanbul University, Cerrahpasa-Istanbul, Turkey
3Department of Internal Medicine, Faculty of Veterinary Medicine, Istanbul University, Avcılar, Istanbul, Turkey *Corresponding author: [email protected]
Abstract
In this study, mineral element and heavy metal levels in bee pollen produced in various regions of Turkey (20 samples) and imported bee pollen (4 samples), were determined using an Inductively Coupled Plasma Dptical Emission Spectrometry (ICP-DES) device. Mineral and heavy metal levels of bee pollens produced in Turkey were determined to be within the following ranges (minimum-maximum, µg/gpollen); Cr (chromium): 0.124-1.595, Cu (copper): 3.728-14.994, Fe (iron): 28.603-725.360, Mg
(magnesium): 271.107-1278.340, Mn (manganese): 8.151-201.036, Se (selenium): 0.593-5.085, Zn (zinc): 14.832-39.079, B (boron): 0.592-61.33, Ni (nickel): 0.002-1.761, Si (silicon): 0.082-10.500, K (potassium): 992.107-2894.154, Ca (calcium): 491.853-1472.102, P (phosphorus): 795.899-5246.992 and Cd (cadmium): 0.006-0.181, Pb (lead): 0.000-0.479, As (arsenic): 0.006-1.035. As a result of this study, it can be concluded that bee pollens produced in Turkey may be a good source of mineral regarding the trace elements Se, Mn, Fe, Cr and Cu.
Keywords: bee pollen; heavy metal; ICP-DES; minerals.
tradition. The aim of this study is to determine mineral element and heavy metal (Pb, Cd, As) levels of bee pollens in Turkey.
2 Materials and methods
2.1 Sample collection
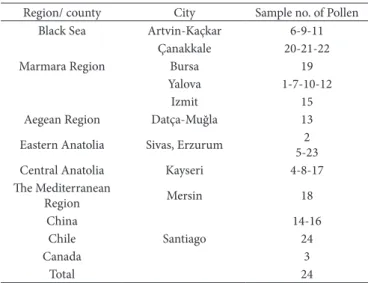
Bee pollen samples were collected from areas of intensive beekeeping. The samples were dried and prepared, suitable for consumption and their origins were determined via producers and sellers. Element measurements for pre-determined mineral and heavy metals were carried out in a total of 24 bee pollens. 20 of these samples were obtained from different regions of Turkey representing; the Black Sea, Central Anatolia, Eastern Anatolia, Marmara, The Mediterranean and Aegean regions. Four imported bee pollens, originating from Canada, China and Santiago and sold in Turkey, were included in the study (Table 1).
2.2 Preparation of samples for measurement
Pollen samples were placed into tared tubes, weighed using a precision balance and the weights recorded. 2 mL Nitric acid (HND3) was added to pollen samples placed into a heat-resistant graduated tube in a 200 °C drying oven and left to dissolve. The pollen and nitric acid mixture was left to cool at room temperature, after which 1 mL Perchloric acid (HClD4) was added and the mixture was returned to the 200 °C oven. The compound was subjected to wet ashing in the oven, vortexed and distilled water added, totaling its volume to 12 mL. It was vortexed once more and prepared for element analysis in the ICP-DES device.
2.3 Element measurement
Suitable wavelengths of 267.716, 324.754, 259.940, 285.213, 257.610, 196.090, 206.200, 189.042, 249.773, 221.647, 251.611, 228.802, 220.353, 766.490, 317.933 and 177.495 nm were used for the analysis of Cr, Cu, Fe, Mg, Mn, Se, Zn, As, B, Ni, Si, Cd, Pb, K, Ca, P elements respectively in the ICP-DES device (Thermo iCAP 6000 series). Samples were subjected to wet ashing and prepared for measurement. Four samples from each pollen type were prepared and mean values of the element analysis results
were calculated. The stock solution was prepared from standard solutions containing Cr, Cu, Fe, Mg, Mn, Se, Zn, As, B, Ni, Si, Cd, Pb, K, Ca ve P (Chem-Lab NV) and distilled water was used for the blank solution. The calibration graph was obtained from the ICP-DES device using blank and standard solutions and element concentration measurements of the prepared pollen samples were carried out. The measurements were repeated 4 times and mean values were determined.
3 Results
Minimum and maximum values (µg/gpollen) of all analyses
performed for each element in pollens in Turkey (20) were determined as; Cr: 0.075-1.912, Cu: 3.621-26.578, Fe: 22.848-1183.173, Mg: 258.246-1705.036, Mn: 7.401-237.695, Se: 0.520-6.617, Zn: 14.442-53.120, B: 0.558-74.316, Ni: 0.001-1.937, Si: 0.030-15.675, K: 711.458-3123.664, Ca: 378.407-2140.741, P: 229.8795-6095.05, Cd: 0.000-0.215, Pb: 0.000-1.383, As: 0.004-1.304. Mineral element and heavy metal mean values of bee pollens are shown in Tables 2-5.
Daily mineral requirement rates were calculated based on the 25 g/day consumption of bee pollens produced in Turkey. According to Brazilian legislation, mineral requirements of; Ca: 1000 mg/day, Fe: 14 mg/day, Cu: 900 µg/day, Cr: 35 µg/day, Mn: 2.3 mg/day, P: 700 mg/day, Zn: 7 mg /day and Mg: 260 mg/day, Se: 0.034 mg/day and K: 4700 mg/day for women and men aged between 19-30 years, were taken into account. Based on this data, bee pollens produced in Turkey supply daily mineral requirement at the following rates: K: 1%, Mg: 6%, Se: 46%, Cu: 28%, Fe: 36%, Mn:32%, Zn: 10%, Cr: 36%, Ca: 2%, P: 9%.
4 Discussion
Within the scope of this research, similarities or varying degrees of differences between mineral levels and the regions from which the bee pollens originated can be seen in all the bee pollens. In 3 bee pollens obtained from plants of different origin (colour differences) in the city of Çanakkale, while some mineral values were very close, differences between the Fe (55.333, 168.449), Mn (11.605, 54.628) and Ca (493.998, 954.493) values were interesting. In this study, it was concluded that similarities as well as differences may be present in mineral levels of bee pollens obtained from the same city. These differences or similarities in mineral levels are related to factors such as; flower varieties from which the bee pollen was collected, climate conditions, geography, environmental conditions, genetic composition of the plant species, agricultural procedures (fertilization and agricultural spraying) and apicultural processes (Bonhevi & Jorda, 1997; Dagaroglu, 2004; Dinkov & Stratev, 2016; Feas et al., 2012; Harmanescu et al., 2007; Nispet et al., 2013). It has been stated that, mineral levels are related to plant type rather than the soil and geographical situation. It has been expressed that, some of the minerals in bee pollen are of nectar origin (Kostic et al., 2015). Turkey has regional (Bursa, Çanakkale etc) Boron reserves. The fact that Boron levels are generally high in bee pollen obtained from regions and surrounding areas where Boron reserves are high suggests that soil type is also important. Changes in mineral levels of bee pollens in relation to many factors may cause difficulties regarding a standard product. Table 1. Regional distribution of bee pollen samples.
Region/ county City Sample no. of Pollen
Black Sea Artvin-Kaçkar 6-9-11
Çanakkale 20-21-22
Marmara Region Bursa 19
Yalova 1-7-10-12
Izmit 15
Aegean Region Datça-Muğla 13
Eastern Anatolia Sivas, Erzurum 2 5-23
Central Anatolia Kayseri 4-8-17
The Mediterranean
Region Mersin 18
China
Santiago
14-16
Chile 24
Canada 3
It is thought that, the control of human related factors such as, environmental pollution and apicultural procedures, may prevent differences, particularly with respect to heavy metals. In fact, in one study, Dinkov & Stratev (2016) expressed that there were no major differences between regions regarding Cd and Pb levels in bee pollens. It has also been stressed that,
by the bee’s feeding on heavy metal-containing nutrients, such as sugar, heavy metal contamination may also be present in bee products (Dinkov & Stratev, 2016).
In this study, amounts of mineral elements in one gram are arranged from greatest to smallest as; P, K, Ca, Mg, Fe, Mn, Zn, B, Cu, Se, Si, Cr, Ni. In some studies, the most common mineral element is reported to be K (Campos et al., 2008; Morgano et al., 2012; Szczesna, 2007). Despite changes in amounts depending on the type of mineral element in bee pollen, it has been reported that the mineral content of bee pollen is K 60%, Mg 20%, Na and Ca 10% (Campos et al., 2008). In 27 bee pollens collected in Poland, South Korea and China, mineral elements were reported to be arranged as K>Mg>Na>Ca>Fe>Mn>Zn>Cu (Szczesna, 2007). In another study, this line up was K > P > Ca > Mg > Na > Fe > Mn > Zn > Cu (Morgano, et al., 2012). In 25 bee pollens investigated in a study in Serbia, K: 2462-4236, Ca: 856-2032, Mg: 503-964, Fe: 39.56-141.29, Zn: 28.76-75.92, Mn: 13.52-92.23 mg/kg values were determined and the bee pollens were reported to be very rich with respect to Fe and Zn, while most commonly found were K, Ca and Mg (Kostic et al., 2015). When compared to the results of this study, in bee pollens produced in Turkey, Ca, K and Zn values were found to be lower, while Fe, Mg and Mn values were higher. The mineral element P was found to be more common in bee pollens produced in Turkey.
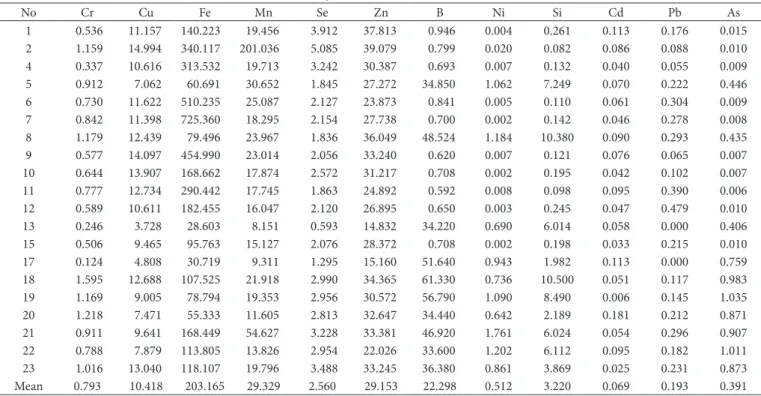
In a study carried out in Poland, South Korea and China (27 bee pollens, mg/kg), the following high values were determined; Poland, Ca: 542-1080 and Cu: 5.6-23.9, China Mn: 13.2-429.8, Mg: 1126-1893, K: 4247-5976, South Korea, Zn: 23.7-60.7 and Fe: 74.3-365.9 (Szczesna, 2007). In bee pollens produced in Turkey, while the Ca value is higher, Cu, K, Fe, Mg, Mn and Zn values were found to be lower. In this study, Table 2. Mineral element and heavy metal mean values (µg/gpollen) of bee pollens produced in Turkey.
No Cr Cu Fe Mn Se Zn B Ni Si Cd Pb As
1 0.536 11.157 140.223 19.456 3.912 37.813 0.946 0.004 0.261 0.113 0.176 0.015
2 1.159 14.994 340.117 201.036 5.085 39.079 0.799 0.020 0.082 0.086 0.088 0.010
4 0.337 10.616 313.532 19.713 3.242 30.387 0.693 0.007 0.132 0.040 0.055 0.009
5 0.912 7.062 60.691 30.652 1.845 27.272 34.850 1.062 7.249 0.070 0.222 0.446
6 0.730 11.622 510.235 25.087 2.127 23.873 0.841 0.005 0.110 0.061 0.304 0.009
7 0.842 11.398 725.360 18.295 2.154 27.738 0.700 0.002 0.142 0.046 0.278 0.008
8 1.179 12.439 79.496 23.967 1.836 36.049 48.524 1.184 10.380 0.090 0.293 0.435
9 0.577 14.097 454.990 23.014 2.056 33.240 0.620 0.007 0.121 0.076 0.065 0.007
10 0.644 13.907 168.662 17.874 2.572 31.217 0.708 0.002 0.195 0.042 0.102 0.007
11 0.777 12.734 290.442 17.745 1.863 24.892 0.592 0.008 0.098 0.095 0.390 0.006
12 0.589 10.611 182.455 16.047 2.120 26.895 0.650 0.003 0.245 0.047 0.479 0.010
13 0.246 3.728 28.603 8.151 0.593 14.832 34.220 0.690 6.014 0.058 0.000 0.406
15 0.506 9.465 95.763 15.127 2.076 28.372 0.708 0.002 0.198 0.033 0.215 0.010
17 0.124 4.808 30.719 9.311 1.295 15.160 51.640 0.943 1.982 0.113 0.000 0.759
18 1.595 12.688 107.525 21.918 2.990 34.365 61.330 0.736 10.500 0.051 0.117 0.983
19 1.169 9.005 78.794 19.353 2.956 30.572 56.790 1.090 8.490 0.006 0.145 1.035
20 1.218 7.471 55.333 11.605 2.813 32.647 34.440 0.642 2.189 0.181 0.212 0.871
21 0.911 9.641 168.449 54.627 3.228 33.381 46.920 1.761 6.024 0.054 0.296 0.907
22 0.788 7.879 113.805 13.826 2.954 22.026 33.600 1.202 6.112 0.095 0.182 1.011
23 1.016 13.040 118.107 19.796 3.488 33.245 36.380 0.861 3.869 0.025 0.231 0.873 Mean 0.793 10.418 203.165 29.329 2.560 29.153 22.298 0.512 3.220 0.069 0.193 0.391
Table 3. K, Mg, Ca, P mean values (µg/gpollen) of bee pollens produced in Turkey.
No K Mg Ca P
1 1811.094 919.343 580.278 865.879
2 2485.519 1200.501 491.853 795.899
4 2702.758 814.476 679.514 1331.377
5 1796.641 419.090 785.355 3518.333
6 2365.266 1278.340 1016.559 1786.657
7 2099.323 987.505 878.967 1191.741
8 2671.459 613.053 1227.646 4721.593
9 2165.239 721.926 764.602 1819.231
10 1699.761 949.572 920.300 1541.382 11 2004.736 593.459 847.933 1361.374 12 1664.247 633.786 902.981 1335.985 13 2224.814 271.106 1472.102 5246.992 15 1453.998 617.565 677.717 1045.813 17 1619.484 316.023 1019.669 4055.672 18 2894.154 720.719 1177.349 4714.479 19 1539.838 641.464 936.270 3839.639 20 1681.628 333.048 493.997 3301.834 21 1604.919 412.245 954.493 3363.309 22 1440.419 383.981 631.935 3147.411
23 992.107 568.204 789.182 4210.083
Mn, Mg and K levels in bee pollens from China were seen to be lower than those in the present research (Tables 4, 5). In another study carried out in China, levels of P: 5946, K: 5324, Ca: 2068, Mg: 1449, Fe: 119.3, Mn: 70.23, Zn: 45.10, Cu: 17.35 mg/kg were determined in bee pollens (Yang et al., 2013). In comparison with the mentioned study, the Fe level determined in the present study was seen to be higher, while P, K, Ca, Mg, Mn, Cu and Zn levels were lower, and that the Zn level in bee pollen from China was similar. The Fe level determined in the present study was found to be higher than the 26.1-92.0, 3.61-8.41, 1.24-2.49, 1.07-1.69 µg/g values determined by Formicki et al. (2013) in regions of Southern Poland and the Fe: 40.14-88.7 ppm value determined by Harmanescu et al. (2007). In 8 different bee pollens collected from various regions in Romania, Cu: 5.51-12.07 ppm, Zn: 33.93-54.35 ppm and Mn: 12.78-98.25 ppm was determined (Harmanescu et al., 2007). It can be seen that, in the mineral levels in bee pollens produced in Turkey, the Cu value is similar, the Mn value is higher and the Zn value is lower (Table 4). Concentration of the mineral substances were evaluated in terms of mg/kg where values were; Fe: 11.1-80.3, Ca: 252.9-850, Zn: 18.8-81.1, K: 2485-6411, Cu: 4.1-15.7, Mg: 273-815.7, P: 294.7-854.4, Mn: 7.4-8.3 and 20 bee pollens were evaluated (Bonhevi & Jorda, 1997). When compared to the present study, Fe, Ca, Cu, Mg, P and Mn values were found to be higher, while Zn and K values were found to be lower (Tables 2-5).
Mineral substance mean values (µg/gpollen) for bee pollens produced in Turkey were determined to be; K: 1945.870, Ca: 862.435, Mg: 669.769, Fe: 203.165, Cu: 10.418, Mn: 29.33, Zn: 29.153, Se: 2.560, P: 2659.73. In 154 bee pollen samples collected from different regions in Brazil, values were; K: 5089, Ca: 2215, Mg: 1179, Fe: 82, Cu: 9.6, Mn: 64, Zn: 46.7, Se 0.51, P: 4828 mg/kg. It has been reported that K, P, Ca and Mg are major mineral elements in pollen and that Mn and Se are rich sources for Brazilian pollen, while Cu, P and Zn may be a source (Morgano et al., 2012). When mean values were compared, Cu, Fe, Mn and Se values were found to be higher in the present study, while Zn, K, Mg, Ca and P values were seen to be lower. It can be said that, bee pollens produced in Turkey may be a rich source of Se and Mn minerals, while also a source of Ca. In another study carried out in 5 bee pollens in Brazil, mineral substance mean values (mg/100g) were determined as; Ca: 68.9, Fe: 13.4, Cu: 0.87, Cr: 1.0, Mn: 4.0, P: 480, Zn: 3.5. In view of the results obtained in the present study, Ca, Fe and Cu levels were high and Cr, Mn, P and Zn levels were low. According to legislative regulations in Brazil, depending on its mineral content, food is described as “source food” if RDI values >15% and “high content food” if RDI >30%. In the study carried out for bee pollens in Brazil, bee pollen was classed as “high content food” depending on its essential elements Fe, Cr and
Mn (Sattler et al., 2016). In the light of the data obtained in this study, bee pollen can be evaluated as “high content food” with respect to Se (46%), Fe (36%), Cr (36%), Mn (32%) and “source food” regarding Cu (28%).
In this study, Ni level was determined to be 0.002-1.761 µg/gpollen. In their studies, Morgano et al. (2010) and Harmanescu et al. (2007) determined Ni level to be < 0.10-1.13 mg/kg and 0-0.72 ppm, respectively. The results found in the present study were higher than these values, however, lower than the result found by Formicki et al. (2013) (Ni: 3.61-8.41 µg/g). According to Brazilian legislation, Maximum Tolerable Limit (MTL) has been determined as 5 mg/kg for Ni. In glucose metabolism, Cr plays a role together with insulin (Harmanescu et al., 2007; Mertz, 1981). According to Polish standards, Cr must not exceed 0.14 mg/kg (Roman, 2007; Roman et al., 2016). In one study, Cr was seen to be the most problematic element and 50% of the samples exceeded the limit value (0.14 mg/kg) (Roman et al., 2016). In the 20 bee pollens produced in Turkey, examined in this study, Cr value was determined to be below the 0.14 mg/kg value in only one sample. In the research carried out in Southwest Poland, Cr was determined as 0.138 mg/kg (Roman et al., 2016). In Brazil, Sattler et al. (2016) determined the recommended daily intake (RDI) for Cr as 35 µg. In this case, the Cr level found in this study supplies 36% of daily requirement (Sattler et al., 2016). For adults, the safe and sufficient Cr value has also been reported as 50-200 µg (Mertz, 1981). Differences in national standards and the lack of international standards cause difficulties in the assessment of bee pollens with respect to minerals. The mineral elements B and Si analysed in this study, had not been widely researched in previous bee pollen studies.
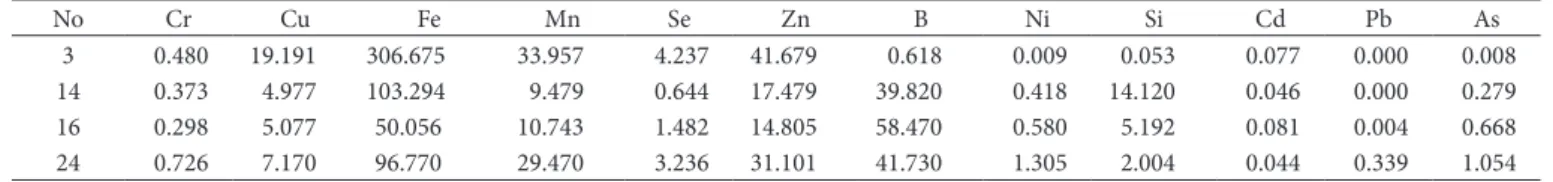
The heavy metal levels (µg/gpollen) of the analysed bee pollens were; Pb: 0.000-0.479, Cd: 0.006-0.181, As: 0.006-1.035, and Pb: 0.000-0.339, Cd: 0.044-0.081, As: 0.008-1.054 in imported bee pollens. It has been reported that, the heavy metal content in bee pollen should not exceed the amounts of; Cd: 0.03 mg/kg, Pb: 0.5 mg/kg, As: 0.5 mg/kg (Campos et al., 2008). In the light of this criteria, when all bee pollens in this study were assessed, it was observed that; As level had exceeded the limit in 8 bee pollens, Cd level had met these values in only 2 Turkish bee pollens and that Pb value had remained under the limit in all bee pollens. According to Polish standards, the following limits Table 5. K, Mg, Ca and P mean values (µg/gpollen) of imported bee pollens.
No K Mg Ca P
3 2471.018 1111.973 680.061 1043.708 14 2414.352 359.290 1296.739 3383.856 16 2726.714 561.295 1634.456 4694.666 24 1300.233 410.638 514.942 3064.424
Table 4. Mineral element and heavy metal mean values (µg/gpollen) of imported bee pollens.
No Cr Cu Fe Mn Se Zn B Ni Si Cd Pb As
3 0.480 19.191 306.675 33.957 4.237 41.679 0.618 0.009 0.053 0.077 0.000 0.008
14 0.373 4.977 103.294 9.479 0.644 17.479 39.820 0.418 14.120 0.046 0.000 0.279
16 0.298 5.077 50.056 10.743 1.482 14.805 58.470 0.580 5.192 0.081 0.004 0.668
must not be exceeded; Cd: 0.05, Pb: 0.50 and As: 0.20 mg/kg (Roman, 2007; Roman et al., 2016). With regard to this standard, As value exceeded the limit in 13 and Cd value in 15 bee pollens in the present study.
Results of the research with respect to heavy metal ratio were evaluated. In the investigation carried out on bee pollens collected from Southwest Brazil over a period of 1 year; As: < 0.01-1.38 mg/kg, Cd: 0.003-0.233 mg/kg, Pb: <0.01-0.44 mg/kg was determined (Morgano et al., 2010). In another study performed in Bulgaria, in 8 dried bee pollens, the highest and lowest Pb and Cd levels were determined to be 0.45-0.494 and 0.019-0.030 mg/kg, respectively (Dinkov & Stratev, 2016). In Southern Poland, depending on the regions, Cd and Pb levels in bee pollens were found to be 26.1-92.0 and 1.24-2.49 µg/g (Formicki et al., 2013). In 29 fresh bee pollens from midwest Dpolo (years 2005-2006), Pb: 0.910-0.490, Cd: 0.239-0.265, As: 0.069- 0.025 mg/kg levels were determined (Roman, 2007). In a study carried out in 36 bee pollens collected from two separate parts of the Dpolo region in the same years, Pb: 0.491-0.804, Cd: 0.234-0.272, As: 0.036-0.060 levels were reported (Roman, 2009). In a study investigating 25 pollen samples from Southwest Poland; As: 0.325, Pb: 0.093, Cd: 0.019 mg/kg levels were found (Roman et al., 2016). The highest heavy metal levels in the present study were determined as; Pb: 0.479, Cd: 0.181, As: 1.054.
Considering heavy metals can spread with environmental pollution via soil, water and air, environmental steps must be taken to prevent it reaching dangerous levels for health.
5 Conclusion
This study suggests that bee pollens produced in Turkey may be assessed as a good source of mineral regarding the trace elements Se, Mn, Fe, Cr and Cu, in particular. When compared to other studies, the Zn level was found to be lower. The lack of international limits to determine bee pollen quality, as well as differences in national standards, causes difficulties in assessment. In recent times, bee pollen has become a frontline product due to increased interest and consumer demand for natural products. Both its use in apitherapy and its components renders it important. Considering the fact that bee pollen may be consumed by children, elderly people and pregnant women, both producers and consumers should be cautious with respect to heavy.
Acknowledgements
This work was supported by Istanbul University, Faculty of Veterinary Medicine (VET-BH-16-8). The authors thanks to Dr. Defne Joan Sadalak Mckinstry for help during the study.
References
Bogdanov, S. (2006). Contaminants of bee products. Apidologia, 37(1),
1-18. http://dx.doi.org/10.1051/apido:2005043.
Bonhevi, S. J., & Jorda, E. J. (1997). Nutrient composition and microbiological quality of honeybee-collected pollen in Spain.
Agriultural Food Chemistry, 4, 725-732.
Campos, M. G. R., Bogdanov, S., Almeida-Muradian, L. B., Szczesna, T., Mancebo, Y., Frigerio, C., & Ferreira, F. (2008). Pollen composition
and standardisation of analytical methods. Journal of Apicultural
Research and Bee World, 47(2), 154-161. http://dx.doi.org/10.1080
/00218839.2008.11101443.
Dagaroglu, M. (2004). Modern beekeeping techniques (chap. 14, 2nd
ed.). Tekirdağ: Doga Arıcılık Tic.
De-Melo, A. A. M., Estevinho, M. L. M. F., & Almeida-Muradian, L. B. (2015). A diagnosis of the microbiological quality of dehydrated
bee-pollen produced in Brazil. Letters in Applied Microbiology, 61(5),
477-483. PMid:26280091. http://dx.doi.org/10.1111/lam.12480.
Demirci, M. (2014). Food chemical. (7th ed., pp. 148-156). Istanbul: Hat.
Dinkov, D., & Stratev, D. (2016). The content of two toxic heavy metals
in Bulgarian bee pollen. International Food Research Journal, 23(3),
1343-1345.
Feas, X., Vazquez-Tato, M. P., Estevinho, L., Seijas, J. A., & Iglesias, A. (2012). Drganic bee pollen: Botanical origin, nutritional value, bioactive compounds, antioxidant activity and microbiological
quality. Molecules, 17, 8359-8377. http://dx.doi.org/10.3390/
molecules17078359.
Formicki, G., Gren, A., Stawarz, R., Zysk, B., & Gal, A. (2013). Metal content in honey, propolis, wax and bee pollen and implications
for metal pollution monitoring. Polish Journal of Environmental
Studies, 22(1), 99-106.
Harmanescu, M., Bordean, D., & Gergen, I. (2007). Heavy metals
content of bee’s pollen from different locations of Romania. Lucrari
Stiintifice: Medicina Veterinara, 40, 253-260.
Kostic, A. Z., Pesic, M. B., Mosic, M. D., Dojcinovic, B. P., Natic, M. M., & Trifkovic, J. D. (2015). Mineral content of bee pollen from
Serbia. Arhiv za Higijenu Rada i Toksikologiju, 66(4), 251-258.
PMid:26751856. http://dx.doi.org/10.1515/aiht-2015-66-2630.
Mertz, W. (1981). The essential trace elements. Science, 213(4514),
1332-1338. PMid:7022654. http://dx.doi.org/10.1126/science.7022654. Morgano, M. A., Martin M. C. T., Rabonato, L. C., Milani, R. F.,
Yatsuyanagi, K., & Rodriguez-Amaya, D. B. (2012). A Comprehensive investigation of the mineral composition of Brazillian bee pollen: geographic and seasonal variations and contribution to human diet.
Journal of the Brazilian Chemical Society, 23(4), 727-736.
Morgano, M. A., Martins, M. C. T., Rabonato, L. C., Milani, R. F., Yotsuyanagi, K., & Rodriguez-Amaya, D. B. (2010). Inorganic
bee pollens from Southeastern Brazil. Journal of Agricultural and
Food Chemistry, 58(11), 6876-6883. PMid:20450185. http://dx.doi.
org/10.1021/jf100433p.
Nispet, C., Guler, A., Yarim, G. F., & Ardali, Y. (2013). Relationship between environmental and flora change with mineralk content of
honey bee products. Turkish Journal of Biochemistry, 38(4), 494-498.
http://dx.doi.org/10.5505/tjb.2013.07269.
Pascoal, A., Rodrigues, S., Teixeira, A., Feas, X., & Estevinho, L. M. (2014). Biological activities of commercial bee pollens: antimicrobial,
antimutagenic, antioxidant and anti-inflammatory. Food and
Chemical Toxicology, 63, 233-239. PMid:24262487. http://dx.doi.
org/10.1016/j.fct.2013.11.010.
Roman, A. (2007). Content of some trace elements in fresh honeybee
pollen. Polish Journal Of Food And Nutrition Sciences, 57(4C), 475-478.
Roman, A. (2009). Concentration of chosen trace elements of toxic
properties in bee pollen loads. Polish Journal of Environmental
Studies, 18(2), 265-272.
Roman, A., Popiela-Pleban, E., Migdat, P., & Kruszynski, W. (2016). As, Cr, Cd, and bee product from a polish industrialized region.
Sattler, D. A. G., De-Melo, A. A. M., Nascimento, K. S., Melo, I. L. P., Mancini-Filho, J., Sattler, A., & Almeida-Muradian, I. B. (2016). Essential minerals and inorganic contaminants (barium, cadmium, lithium, lead and vanadium) in dried bee pollen produced in
Rio Grande do Sul State, Brazil. Food Science and Technology
(Campinas), 36(3), 505-509. Retrieved from http://www.scielo.
br/scielo.php?pid=S0101-20612016005012103&script=sci_arttext
Stanciu, D. G., Margithas, L. A., Dezmirean, D., & Campos, M. G. (2011). A comparison between the mineral content of flower and honeybee
collected pollen of selected plant origin (Heliantus annuus L. and
Salix sp.). Romanian Biotechnological Letters, 16(4), 6291-6295.
Szczesna, T. (2007). Concentration of selected elements in
honeybee-collected pollen. The Journal of Agricultural Science, 51(1), 5-13.
Tayar, M., & Cibik, R. (2011). Food chemical. (2nd ed., pp. 157-178).
Bursa: Dora.
Yang, K., Wu, D., Ye, X., Liu, D., Chen, J., & Sun, P. (2013). Characterization
of chemical compozisition of bee pollen in China. Journal of
Agricultural and Food Chemistry, 61(3), 708-718. PMid:23265625.