molecules
ISSN 1420-3049 www.mdpi.com/journal/molecules ArticleMicrobiological Assessment, Nutritional Characterization and
Phenolic Compounds of Bee Pollen from
Mellipona mandacaia
Smith, 1983
Marivalda Santa Bárbara 1, Cerilene Santiago Machado 1, Geni da Silva Sodré 1, Luís G. Dias 2,3, Leticia M. Estevinho 2,4,* and Carlos Alfredo Lopes de Carvalho 1
1 Grupo de Pesquisa Insecta, Centro de Ciências Agrárias, Ambientais e Biológicas da Universidade
Federal do Recôncavo da Bahia, 44380-000 Cruz das Almas, Bahia, Brazil;
E-Mails: [email protected] (M.S.B.), [email protected] (C.S.M.); [email protected] (G.S.S.); [email protected] (C.A.L.C.)
2 Escola Superior Agrária, Instituto Politécnico de Bragança, Campus Santa Apolónia,
5301-855 Bragança, Portugal; E-Mail: [email protected]
3 Centro de Química-Vila Real, Universidade de Trás-os-Montes e Alto Douro,
5000-801 Vila Real, Portugal
4 Centro de Investigação de Montanha, Escola Superior Agrária, Instituto Politécnico de Bragança,
Campus Santa Apolónia, 5301-855 Bragança, Portugal
* Author to whom correspondence should be addressed; E-Mail: [email protected]; Tel.:+351-273-303-342; Fax: +351-273-325-405.
Academic Editor: Derek J. McPhee
Received: 04 June 2015 / Accepted: 03 July 2015 / Published: 9 July 2015
inferior values, respectively. Polyunsaturated fatty acids (54.1%) were significantly higher than saturated (42.18%) and monounsaturated (3.71%). It was found that the bee pollen is safe from the microbiological point of view and has a good nutritional quality. The influence of the geographical origin on the assessed parameters was evident, especially concerning the fatty acid profile.
Keywords: bee pollen; fatty acids; Melipona mandacaia; microbiological quality; nutritional characterization; stingless bee
1. Introduction
For several years, meliponiculture was considered a recreational activity, since colonies were thought to be low productive when compared with the ones from the honey bee Apis mellifera [1]. However, recent evidence supports that those easily reared bees constitute a feasible and important source of income for beekeepers, providing considerable amounts of high-quality products [2].
In Brazil, Melipona bees are indigenous stingless bees and present all over the country, although species differ according to the region [3]. Melipona mandacaia (Mandacaia stingless bee) is widespread in the Brazilian states of Bahia, Ceará, Paraíba, Pernambuco and Piauí, usually occurring around the São Francisco and the Vaza Barris rivers [4]. Besides their importance as major pollinators of most wild plants and some cultivated species, the products obtained from this species are also useful sources of therapeutically active compounds and play an important role in the nutritional industry [5].
Indeed, it has been claimed that the products obtained from meliponiculture possess distinctive characteristics when compared to the produced by Apis mellifera, particularly concerning the sensory properties, receiving higher ratings and meeting the demands of the consumers [6]. However, little evidence is available on the literature regarding the composition of these products, what hampers their further uses in the food and pharmaceutical industry.
Among these products, special emphasis may be laid on bee pollen, a natural product composed by flower pollen that bees collect and mix with their own specific substances, forming the pellets that are then placed in the honeycomb cells [7]. This beehive product has been used traditionally for human consumption, as well as in folk and complementary medicine. Indeed, recent evidence reports valuable biological properties, among them: antimicrobial, anti-inflammatory, antimutagenic [8], antioxidant [7], anti-allergic [9], antiviral, hypolipidemic, hypoglycemic and immunostimulating [10].
Bee pollen is rich in carbohydrates, crude fibers, lipids, vitamins and phenolic compounds, being commonly named as the “perfectly complete food”, due to the presence of all the essential amino acids [11]. In spite of this, the specific chemical composition of this natural product depends strongly on the bees’ specie, botanical and geographic origin, as well as on other factors, among which the climatic conditions, soil type and agricultural practices [8].
pollen from this bee specie, despite the increasingly higher scientific and socio-economic importance of this product.
2. Results and Discussion
A total of 21 samples of bee pollen collected from two regions of Bahia (João Dourado and Uibaí) in Brazil, were analyzed in triplicate by microbiological assays and chemical evaluation.
Due to the absence of literature specifications for the pollen collected by the Melipona bees, the pollen from Apis mellifera was used as element of comparison, based on the legislation of different countries and works done by various researchers [8].
2.1. Microbiological Contamination
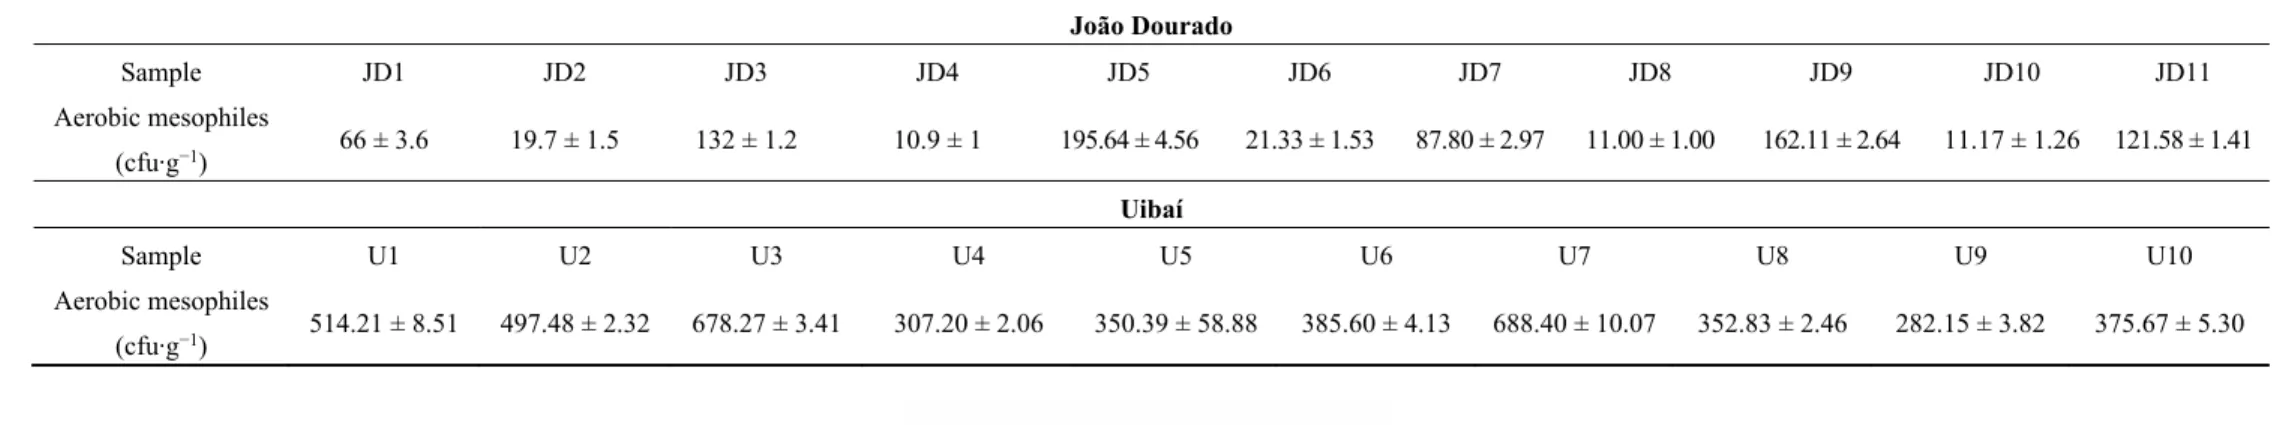
Regarding the results obtained in the microbiological analyses, it was noted that the Salmonella sp., sulfite-reducing clostridia, fecal coliforms, Escherichia coli, Staphylococcus aureus, yeast and moulds were absent in all samples. These results showed that, microbiologically, the analyzed pollen samples were safe and therefore able to be used as a food product. These analyses were performed since microbial contaminations are possible, mainly associated with the pollens’ processing, as observed in other works, for example, Coronel et al. [12] detected contaminations by faecal coliforms in twenty-three bee pollen samples and Estevinho, et al. [13] detected yeast and moulds in 60% of pollen samples, though in lower concentration. In Table 1 it are presented the determinations for the mesophilic aerobic microorganisms. The mesophilic aerobic microorganisms were present in all the analyzed pollen samples and with high variability in concentrations (85 ± 63 cfu·g−1 for JD and 443 ± 142 cfu·g−1 in U). All the results were within the limits established by Argentine Food Code [14], whose maximum value was set at 1.5 × 10³ cfu·g−1 for aerobic mesophilic microorganisms at 30 °C. This suggests that the hygiene conditions during harvest, cleaning, drying and storage were adequate.
In order to evaluate which statistical test could be used to verify if mesophilic aerobic microorganisms amounts present in samples were influenced by the pollens’ origin (region João Dourado, JD, and Uibaí, U), it was checked whether the data presented normality and homogeneity of variances. For each group, the Shapiro-Wilk test showed that the data had no normal distribution (p < 0.006 at α = 0.05) and the Levene’s test that between the two-formed groups there was no homogeneity of variance (p < 0.001 at
Table 1. Results obtained for the aerobic mesophiles (cfu·g−1) in the bee pollen samples from the two locations. João Dourado
Sample JD1 JD2 JD3 JD4 JD5 JD6 JD7 JD8 JD9 JD10 JD11
Aerobic mesophiles
(cfu·g−1) 66 ± 3.6 19.7 ± 1.5 132 ± 1.2 10.9 ± 1 195.64 ± 4.56 21.33 ± 1.53 87.80 ± 2.97 11.00 ± 1.00 162.11 ± 2.64 11.17 ± 1.26 121.58 ± 1.41
Uibaí
Sample U1 U2 U3 U4 U5 U6 U7 U8 U9 U10 Aerobic mesophiles
(cfu·g−1) 514.21 ± 8.51 497.48 ± 2.32 678.27 ± 3.41 307.20 ± 2.06 350.39 ± 58.88 385.60 ± 4.13 688.40 ± 10.07 352.83 ± 2.46 282.15 ± 3.82 375.67 ± 5.30
2.2. Nutritional Characterization and Phenolic Compounds
The physical and chemical parameters analyzed were: moisture content, ash content, water activity (aw), pH value, total acidity, protein content, fiber content, total phenolic content, flavonoid content and
reducing sugar content. The results showed that half of these parameters had values varying in a small interval, with standard deviation values percentage ranging between 1.10% and 6.60%. These parameters were the moisture content, which had an average value of 36.0 ± 2.0%; the ashes, with a percentage of 4.9 ± 0.3%; and, the water activity with 0.86 ± 0.02% (values obtained at 26.7 ± 0.8 °C). In addition, the average values of pH were 3.49 ± 0.04 and total acidity, 146 ± 10 meq·kg−1. Regarding the other
parameters under study, the relative standard deviation percentages ranged from 11% to 39%: protein content presented an average value of 21 ± 2%; average fiber content was 3.6 ± 1.4%; total phenolic content was 40 ± 13 mg GAE/g; flavonoid content was 1.0 ± 0.2 mg CAE/g; and, total sugars content was 12 ± 2%.
The obtained values for pH are lower than those established by Brazilian legislation [15] and Argentine Food Code [14], as well as, obtained by Coronel et al. [12] and Marchini et al. [16], in dehydrated pollen samples from Argentina and Brazil, respectively. With regard to aw, ash and moisture analyses, the
obtained values were higher than those found by Morais et al. [7], Feás et al. [11] and Nogueira et al. [17] in dehydrated pollen samples from Portugal. The ash content was in accordance with the Argentine Food Code’s established limits [14], i.e., between 2% and 5%, and also with those obtained by Almeida-Muradian et al. [18] (2.1 ± 0.8%) and Bonvehi et al. [19] (4.8%) in dehydrated pollen samples from Brazil and Spain, respectively. All the samples showed high moisture content, exceeding the maximum established limits by Brazil’s legislation (30% in bee pollen and 4% in dehydrated pollen), Argentina (8% in bee pollen), Bulgaria (10%), Poland and Switzerland (6%) [20]. According to Marchini et al. [16] this may be related to the fact that pollen, a hygroscopic product, is easily affected by environmental conditions. The protein content in pollen was similar to those obtained by Almeida-Muradian et al. [18], González-Martín et al. [21] and Carpes [22] in pollen samples from Brazil and Spain. Estevinho et al. [13] presented results of Portuguese pollen protein between 24% and 34%, values slightly higher than those found in this study. The content of reducing sugars was much lower than the values obtained by Carpes [22] (49 ± 4%) in pollen samples from Brazil and by González-Martín et al. [21] in Spanish pollen samples (23% to 41%). According to Silva et al. [23] and Carpes et al. [24], the reducing sugar content in pollen is associated with the amount of honey or nectar present in the product. The fiber content and the free acidity are within the limits stipulated by Brazilian law (2% minimum of fibers and 300 meq·kg−1 maximum of free acidity) [15].
Regarding to the content of total flavonoids, the pollen samples analyzed showed lower values than those found by LeBlanc et al. [26], Mărghitas et al. [28], Feás et al. [11] and Carpes [22], pollen samples from North America, Romania and Brazil, respectively.
In the collinearity study, using all variables, the linear relationships presented correlation coefficients (R) lower than 0.5, with the exception of 2 relationships: moisture content versus ash content (R = −0.67 with p < 0.001); total phenolic versus flavonoid content (R = 0.63 with p < 0.001).
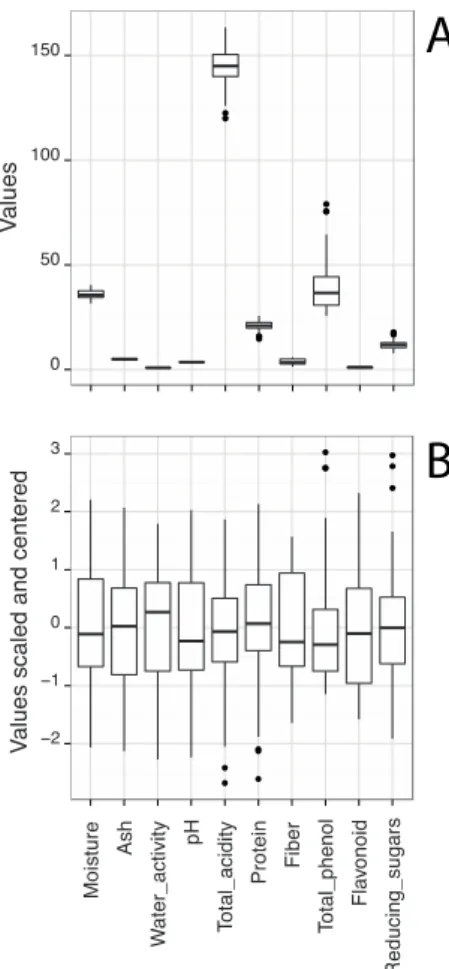
These results are in agreement with the fact that the range of variable values was not very large in order to obtain any relevant linear tendency. Figure 2 presents two boxplot graphs of all physical and chemical parameters measured in the samples: (A) raw data; (B) centralized and standardized data. Figure 2A allows visualizing the variability of variables into a single scale and to identify the extreme values.
Firstly, it was possible to check that the variables had different order of magnitude, indicating that when using multiple variables, they should be centralized and standardized so that all have the same importance in the statistical study. Secondly, the extreme values (better visualized in the Figure 2B) identified in the boxplot graph were: total acidity in U4 samples, protein content in J10 samples, total phenolic content in the U10 samples and total sugar content in JD7 samples. These extreme values were not common to other variables and so, the respective samples could not be considered as outliers.
Figure 2. Two boxplot graphs of all physical and chemical parameters measured in the samples: (A) raw data; (B) centralized and standardized data.
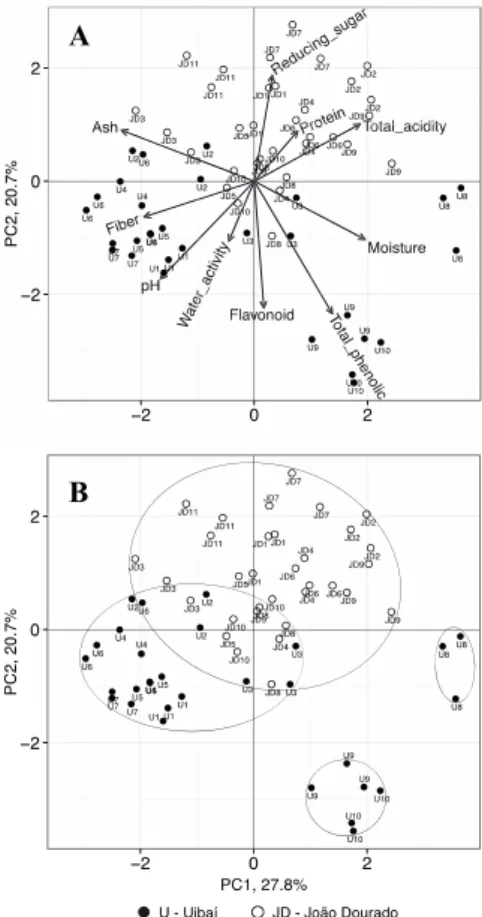
10 principal components (PCs) that explained 100% of overall data variance; PC1 explained 28% of the total variance, while PC2 explained 21%. The following three PCs represent 15%, 10% and 9% of the total data variance, while the remaining PCs had values between 0.8% and 6%. Figure 3 shows two graphs of the representation of samples scores in the first two principal components (PC1 and PC2), emphasizing the place of origin of each sample by using different markers; in the first plot (A) it is shown the loadings of the original variables; in the second plot (B), possible outline grouping samples is proposed. Other representations with other PC functions have been considered but it was verified that they showed no relevant information for the study. Figure 3 allowed to visualize that most samples from JD region are separated from the ones from U region, showing that the origin of the sample contributes to the physical and chemical characteristics.
Figure 3. Representation of the first two principal components for all pollen samples distinguishing the place of origin by using different markers: plot (A) includes loadings of the original variables; plot (B) includes possible outline grouping samples.
Samples from JD region, in general, are characterized by having higher values of total acidity, protein content and total sugar content and low/intermediate values of water activity, pH values, fiber content, flavonoid content and total phenolic content. Regarding the U samples, most had the opposite tendency, with the exception of samples U8, U9 and U10, which deviated from all others by presenting higher levels of total phenolic compounds and moisture content.
Prior to assessing the significance of the differences between the results of the two locations, it was evaluated the normality of the data using the Shapiro-Wilk test. The variables total acidity, protein, fiber, total flavonoids and reducing sugars showed lack of normality (p < 0.033) for JD pollen samples, while
A
for U pollen samples the same behavior was observed for pH, fiber and total flavonoids (p < 0.012) (instead of total acidity, protein content, fiber content, flavonoid content and the total sugar content of JD samples showed lack of normality (p < 0.033); the variables of U samples that showed lack of normality were the pH values, fiber content and flavonoid content (p < 0.012).
To confirm these results the normal QQ plots were obtained. It was possible to verify that a low degree of skew in lower values was present in distribution of same variables but all can be (instead of was present in some variable distribution but not all can be.
Secondly, the Levene’s test was used to assess the homogeneity of variances. Moisture, total acidity, fiber and reducing sugars parameter showed variance homogeneity (p > 0.57) in the data of two regions investigated (instead of Moisture content, total acidity, fiber content and total sugar content had variances homogeneity (p > 0.57) in the data of both regions. Anova one-way was applied and significant differences were found between the results obtained for the two regions for all the parameters, except moisture content (p = 0.78).
Regarding the variables ash content, water activity, pH values, protein content, total phenolic content and flavonoid content here was no homogeneity of variances. In this case, a Welch Anova was applied. The variables ash content, pH values, water activity and protein content did not presented significant differences between samples of each region (p > 0.070). In contrast, the total phenolic and flavonoid content differed significantly (p < 0.003). Globally, the variables total acidity, fiber, total phenolic, flavonoid and total sugar contents, had relevant information that allow to distinguish samples from the two regions and their contribution towards samples distinction is evident in Figure 3.
2.3. Fatty Acid Profile
Moreover, standard deviation values showed a high variability within the results for these fatty acids with low levels, which shows that, in this work, there was an intrinsic variability in samples used, even the ones from the same region.
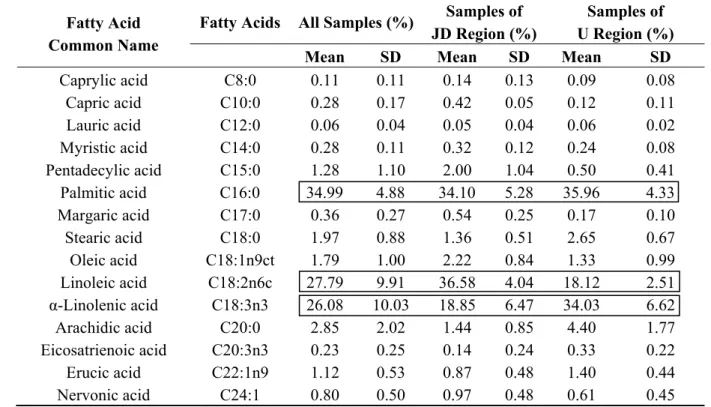
Globally, the levels of unsaturated fatty acids were generally higher than those of saturated fatty acids, presenting levels between 43% and 70% of the total fatty acids. Also, in general, polyunsaturated fatty acids were significantly higher than monounsaturated and total saturated fatty acids. The ratio of unsaturated/saturated fatty acids was 1.4 ± 0.4. Only 4 samples showed contrary tendencies, although in two samples the results between repetitions were not concordant. This ratio tendency was already reported in a previous work [13], which states that these results are in accordance to the hypothesis that the bees choose pollens with higher content of unsaturated fatty acids (more adequate to their metabolism). From a nutritional point of view, this ratio shows that this pollen can be an asset if added to processed food by improving the nutritional quality of the manufactured food [13].
Table 2. Descriptive analysis of pollen’s fatty acids.
Fatty Acid Common Name
Fatty Acids All Samples (%) Samples of JD Region (%)
Samples of U Region (%)
Mean SD Mean SD Mean SD
Caprylic acid C8:0 0.11 0.11 0.14 0.13 0.09 0.08 Capric acid C10:0 0.28 0.17 0.42 0.05 0.12 0.11 Lauric acid C12:0 0.06 0.04 0.05 0.04 0.06 0.02 Myristic acid C14:0 0.28 0.11 0.32 0.12 0.24 0.08 Pentadecylic acid C15:0 1.28 1.10 2.00 1.04 0.50 0.41
Palmitic acid C16:0 34.99 4.88 34.10 5.28 35.96 4.33 Margaric acid C17:0 0.36 0.27 0.54 0.25 0.17 0.10
Stearic acid C18:0 1.97 0.88 1.36 0.51 2.65 0.67 Oleic acid C18:1n9ct 1.79 1.00 2.22 0.84 1.33 0.99 Linoleic acid C18:2n6c 27.79 9.91 36.58 4.04 18.12 2.51
α-Linolenic acid C18:3n3 26.08 10.03 18.85 6.47 34.03 6.62 Arachidic acid C20:0 2.85 2.02 1.44 0.85 4.40 1.77 Eicosatrienoic acid C20:3n3 0.23 0.25 0.14 0.24 0.33 0.22 Erucic acid C22:1n9 1.12 0.53 0.87 0.48 1.40 0.44 Nervonic acid C24:1 0.80 0.50 0.97 0.48 0.61 0.45
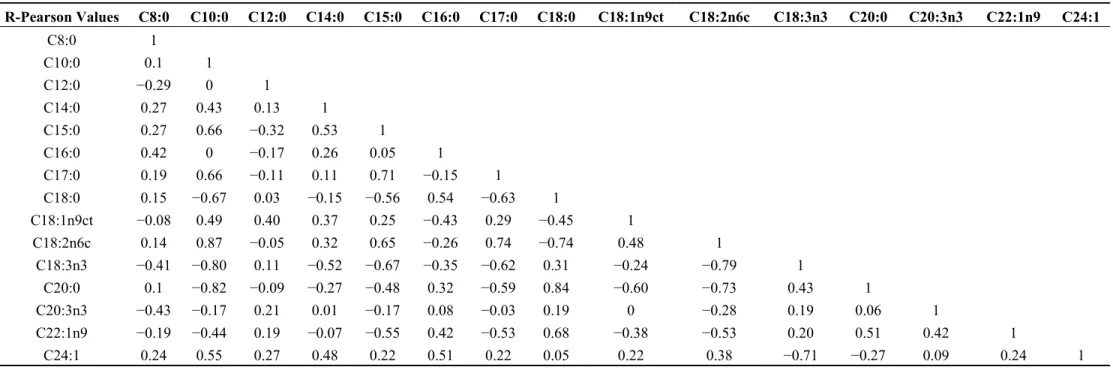
Table 3. Correlation matrix for the fatty acids using Pearson’s correlation coefficients.
R-Pearson Values C8:0 C10:0 C12:0 C14:0 C15:0 C16:0 C17:0 C18:0 C18:1n9ct C18:2n6c C18:3n3 C20:0 C20:3n3 C22:1n9 C24:1
C8:0 1
C10:0 0.1 1
C12:0 −0.29 0 1
C14:0 0.27 0.43 0.13 1 C15:0 0.27 0.66 −0.32 0.53 1 C16:0 0.42 0 −0.17 0.26 0.05 1 C17:0 0.19 0.66 −0.11 0.11 0.71 −0.15 1 C18:0 0.15 −0.67 0.03 −0.15 −0.56 0.54 −0.63 1 C18:1n9ct −0.08 0.49 0.40 0.37 0.25 −0.43 0.29 −0.45 1
C18:2n6c 0.14 0.87 −0.05 0.32 0.65 −0.26 0.74 −0.74 0.48 1
C18:3n3 −0.41 −0.80 0.11 −0.52 −0.67 −0.35 −0.62 0.31 −0.24 −0.79 1 C20:0 0.1 −0.82 −0.09 −0.27 −0.48 0.32 −0.59 0.84 −0.60 −0.73 0.43 1
C20:3n3 −0.43 −0.17 0.21 0.01 −0.17 0.08 −0.03 0.19 0 −0.28 0.19 0.06 1
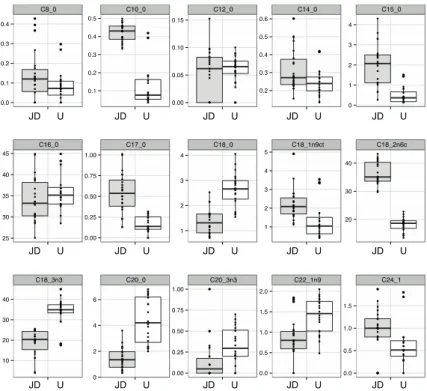
In Figure 4, boxplots for each fatty acid are presented allowing to visualize the data obtained for the pollen samples of the two regions and the variability found within each group. The figure showed plots with extreme values considered typical results (not outliers) since the samples did not showed the same trend in other variables.
Through the Shapiro-Wilk normality test, it was shown that the fatty acids variables without normality (p < 0.007) were: C8:0, C10:0, C12:0, C14:0, C15:0, C17:0, C18:1n9ct, C18:2n6c, C20:0 e C20:3n3. With p-values higher than 0.09, the variables presenting normality were C16:0, C18:0, C18:3n3, C22:1n9 e C24:1.
To assess the homogeneity of variances in each fatty acids, considering the groups defined, it was applied the Levene test. The variables that had variance homogeneity (p > 0.05) were: C8:0, C10:0, C14:0, C16:0, C18:0, C18:1n9ct; C18:3n3, C20:3n3, C22:1n9 and C24:1. For the variables that meet the assumptions of normality and homogeneity of variances, it was applied the Anova one-way to verify if there were significant differences between the mean values of samples from the two regions. Also in this scope, for those non-normal variables, non-parametric methods were used; the Kruskal-Wallis test, if variables were homoscedastic, or Welch test (Anova with Welch’s correction), if the variables were heteroscedastic.
The Anova method showed that only the fatty acid C16:0 had no significant differences between the two groups of samples (p = 0.22). With the non-parametric tests, it was found that only the fatty acids C8:0 and C12:0 presents no significant differences (p > 0.12) while the others variables showed significant differences among the samples of the two regions (p < 0.036). The 3 variables with no significant differences between groups of samples (C8:0; C12:0 and C16:0) were not used in the PCA study. The remaining variables, by having results with different magnitudes, were centered and scaled. Therefore, the data matrix for PCA was constructed using the results of 12 fatty acids analyzed in the 21 pollen samples.
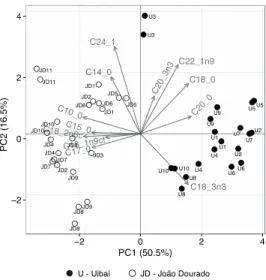
The results of PCA showed that 7 principal components were sufficient to explain 96% of the total variance of the data. The first and second principal components explained 67% of the data’s total variance. Figure 5 shows the representation of the first two principal component scores obtained for the results of the fatty acids analyzes.
Figure 5. The first two principal component scores of the pollen’s fatty acids.
It was possible to visualize the behavior of the samples variability, showing that pollen samples could be separated in two groups, according to the pollen’s place of origin. Using the first principal component (PC1), it was possible to separate the pollen samples of JD region, present in the negative quadrant, from the U region, present in the positive quadrant. The figure shows that the samples of U region were grouped in PC1 due mainly to high levels of C18:0, C18:3n3, C20:0, C20:3n3 and C22:1n9 fatty acids. Only the U3 sample deviates from this grouping by having overall median levels of fatty acids in the PC1 dimension but, mainly because it had higher values in the second principal component (PC2). Otherwise, in the same dimension, pollen from JD region showed to have a lipid profile with higher levels in the fatty acids: C10:0, C14:0, C15:0, C17:0, C18:1n9ct, C18:2n6c and C24:1. In this group, the sample JD8 also showed to have a distinctive profile over all other JD samples, which is emphasized by the PC2.
3. Experimental Section
3.1. Pollen Samples
stored by Mellipona mandacaia Smith bee. Each sample was identified using letters—U or JD, representing the geographic origin, and numbers. The preparation of the extracts was performed as described by Morais et al. [7], by mixing the bee pollen with methanol (1:2) (w/v). After maceration, the bee pollen extract was evaporated in a vacuum evaporator and the dried extract was kept in the dark at room temperature. All the analyses were carried out in triplicate, yielding 63 results for each parameter. 3.2. Microbiological Determinations
In order to evaluate the microbial quality of the Melipona mandacaia bee pollen samples, they were analyzed for the presence of mesophilic microorganisms, yeasts and moulds, fecal coliforms, Escherichia coli, Staphylococcus aureus, sulphite reducing clostridium spores and Salmonella.
3.2.1. Sample Preparation
A mass of 25 g of bee pollen were aseptically taken and homogenized for 3 min with 225 mL of pre-chilled (4 ± 0.5 °C) sterile peptone-physiological saline solution (0.1% neutral peptone + 0.85% NaCl in sterile deionized L1O, pH = 7.0 ± 0.05). Decimal serial dilutions were prepared from this homogenate in the same chilled sterile diluents (1:10 v/v) [31].
3.2.2. Enumeration of the Total Mesophilic Microorganisms
The total quantification of aerobic mesophilic microorganisms was done following the Portuguese regulations [32], with sowing by incorporation of 1 mL for each decimal dilution to Petri plates culture medium containing Plate Count Agar (PCA-Himedia, Mumbai, India). The colony counting was made after incubation plates at 30 °C for 72 h and the results were expressed as colony forming units per gram of bee pollen (cfu·g−1).
3.2.3. Enumeration of Yeast and Moulds
Moulds and yeasts enumeration was made on DG18 and incubated at 25 °C for 5 days. Microbial counts were expressed as cfu·g−1 [33].
3.2.4. Sulphite Reducing Clostridium Spores
3.2.5. Enumeration of Fecal Coliforms and Escherichia coli
For the quantification of total coliforms and Escherichia coli, SimPlate kit system from Bio Control, was used. The supplied culture medium was pre-hydrated in 9 mL of distilled water, inoculated with 1 mL of the stock suspension and homogenized by vortex, following the manufacturer’s recommendations. The contents were poured onto plates containing 84 wells. The liquid was evenly spread across the wells in a circular motion at low speed and the excess was removed. The plates were incubated at 35 °C for 24 to 48 h. The enumeration of total coliforms was performed by counting the number of wells in which the color change occurred in the culture medium. The enumeration of E. coli was performed by counting the number of wells in which the fluorescence was observed after exposure to a plate of ultraviolet light (UV) at 365 nm. The number of coliforms present in the sample was calculated according to the table provided by the manufacturer [35].
3.2.6. Detection of Salmonella sp.
The detection of Salmonella sp. was carried out using the immunodifusion 1–2 test, as described in the AOAC method [36]. The results were obtained 16–20 h after pre-enrichment in buffered peptone water and the results were interpreted visually, by monitoring the development of an immunoband, which is a characteristic immobilization pattern of cells.
3.2.7. Determination of Staphylococcus aureus
Serial dilutions of the sample were inoculated in Baird-Parker Broth with Egg Yolk Tellurite and Sulfadimidine Solution (Himedia) during 24 h (37 °C). Then, three to five characteristic colonies were selected, in order to verify the presence of coagulase and catalase. Microbial counts were expressed as colony-forming units per gram of bee pollen (cfu·g−1) [37].
3.3. Physicochemical Analyses 3.3.1. Moisture Content
Approximately 2 g of each sample of the Melipona mandacaia bee pollen was dried at a temperature of 105 °C, till constant weight [38].
3.3.2. Ash Content
The ash content was determined after ignition at 550 ± 15 °C by gravimetry [39]. 3.3.3. Water Activity
3.3.4. pH Values
pH was measured in the aqueous phase obtained after mixing 10 g of pollen in 75 mL of distilled water [40] by a pH combined electrode connected to a pH 211 Microprocessor pH Meter of Hanna Instruments. 3.3.5. Total Acidity
Regarding total acidity, 2.5 g of bee pollen were mixed with CO2-free water and the titration was
started with NaOH 0.05 N in a 5 mL per minute flow, until reaching the pH 8.5. This determination was carried out according to AOAC norm [40].
3.3.6. Protein Content
Nitrogen content was determined using the Kjeldahl method (230-Hjeltec Analyzer, Foss Tecator, Höganäs, Sweden). The crude protein (CP) content was calculated using the conversion factor of 6.25 (N × 6.25) [38].
3.3.7. Fiber Content
The fiber content was determined according to the method of Van Soest et al. [41] as adapted for Komarec [42] and Senger et al. [43], using neutral detergent and digestion by autoclaving.
3.3.8. Total Phenolic Content
The total phenolic content in the bee pollen extract was estimated following the Folin-Ciocalteau method, previously described by Moreira et al. [44]. Briefly, the reaction of 500 µL methanol extract (MeOH/bee pollen; 500 μL of 1:10 g·mL−1), mixed with 500 µL of the Folin-Ciocalteau reagent and
500 µL of Na2CO3 (10% w/v) was kept in the dark at room temperature for 1 h. Then, the absorbance of
the reaction mixture was read at 700 nm, using a Unicam Helios Alpha UV-visible spectrometer (Thermo Spectronic, Cambridge, UK). Galic acid standard solutions (0.01 × 10⁻³ to 0.08 × 10⁻³ M) were used for constructing the calibration curve. Total phenols content were expressed as mg of galic acid equivalents per g of bee pollen extract (GAEs).
3.3.9. Flavonoid Content
For flavonoid contents determination, 250 μL of the methanol extracts of bee pollen were mixed with 1.25 mL of distilled H2O and 75 μL of a 5% NaNO2 solution. After 5 min, 150 μL of a 10% AlCl3⋅H2O
solution were added. After 6 min, 500 μL of NaOH (1 M) and 275 μL of distilled H2O were added. The
solution was mixed well and the intensity of color was measured at λ = 510 nm. Catechin standard solutions (0.022 × 10⁻³ to 0.34 × 10⁻³ M) were used for constructing the calibration curve. Total flavonoids content were expressed as mg of catechin equivalents per g of bee pollen (CAEs).
3.3.10. Reducing Sugars
3.4. Determination of the Fatty-Acid Profile
The crude fat (CF) was extracted with petroleum ether using an automatic Soxtec device (FOSS, Soxtec™ 2050, Höganäs, Sweden) [41 AOAC, 1995]. Fatty acid methyl esters were prepared from the extracted CF fraction by transesterification using MeOH in the presence of H2SO4. A sample containing
20 ± 0.5 mg of lipids was redissolved in 0.75 mL n-hexane; then 0.1 mL of 2 N KOH in MeOH was added and the solution was mixed in a vortex mixer, for 2 min (Model Reax 2000, Schwabach, Germany) and dried over anhydrous Na2SO4. After phase separation, the superior layer of n-hexane containing the
fatty acid esters was removed and injected on a gas-chromatograph DANI model GC 1000 (Izasa, Barcelona, Spain) equipment, equipped with a split/splitless injector, a flame ionization detector (FID) and a Macherey-Nagel column (30 m × 0.32 mm ID × 0.25 µm: stationary phase of 50% cyanopropyl-methyl-50% phenylmethylpolysiloxane). The analysis of the methyl esters were performed using H2 as
carrier gas at a pressure of 0.61 bar and at split ratio was of 1:40. The flow rate of the carrier gas was set at 4.0 mL·min−1. A thermal gradient from 170 to 240 °C at 3.5 °C·min−1 was used with the injector and detector temperatures at 240 °C. The injection volume was 1 µL. The Fatty acid methyl esters were identified by comparing the retention times of the peaks obtained in the bee pollen sample with those of known reference esters. The fatty acid composition was expressed as percent of major fatty acid methyl esters from the peak areas. Results were recorded and processed using Clarity 4.0.1.7 Software (DataApex, Podohradska, Czech Republic).
3.5. Statistical Analysis
All the experiments were conducted in a fully randomized manner. In a first approach, it was performed an overall descriptive analysis, by calculating means, standard deviations and relative standard deviation percentages (RSD (%)). To assess the linear dependence between pairs of variables, Pearson’s correlation coefficients were calculated and presented in the form of correlation matrix.
Shapiro-Wilk’s test was used to verify whether data follow normal distributions for each category of the independent variable and normal QQ plot was used to confirm if the variables lacking normality could have an approximately normal distribution. The homogeneity of variances was assessed using Levene’s test. Then, Anova one-way was applied when variables had groups with normality and homogeneity of variances and Kruskal-Wallis test, whenever there was homogeneity of variances (homocedastic variables) and no-normality. The Anova with Welch’s correction was applied in no-normality and no-homogeneity of variances (heterocedastic) variables.
To study the overall data’s variability, principal component analysis (PCA), an unsupervised multivariate technic, was used to generate a new set of orthogonal variables (linear combinations of the original variables), principal components (PCs), which represents a new subspace where the main variation present in the original data is mainly represented by the first components. It was used for visualization of hidden groups, possible outliers and, considering the projections of the original variables loadings, the variables’ influence in samples distribution.
4. Conclusions
The bee pollen is a natural product with a chemical composition that gives relevant biological properties, confirming its added value as a food product. In this study, for the first time, it was studied the overall physico-chemical characterization and fatty acid profile of pollen samples collected by the Melipona mandacaia (Mandacaia stingless bee) in two regions. Also, it was verified the presence of microorganisms in order to assess their food security, since the samples followed a normal processing either in all steps of pollen harvesting or at storage level. In this last study, the results showed that all samples were free of microbial contamination and only the presence of mesophilic aerobic microorganisms were detected, indicating that pollen manipulation was appropriate.
The physical and chemical parameters showed values within the stipulated by legislation, except for pH and moisture content, which samples had lower and higher values, respectively, than those established by Brazilian Legislation [15] or Argentine Food Code [14]. These two parameters results suggested that the storage conditions should be improved to avoid undesirable fermentations of this product. It should be noted that the phenolic compounds have a high content that contributes to an increase in antioxidant capacity of pollen although, a different situation was found for the total flavonoids content. Considering the natural variability within pollens’ samples results, it was possible to verify that samples’ geographic origin had a great impact in the physical and chemical characteristics, confirmed by PCA by showing that overall results had relevant information to distinguish partially samples between the two regions. This point was more evident when dealing with fatty acids profile, which was shown that data allowed complete distinction between samples from the two regions under study. The fatty acid profiles confirmed that the polyunsaturated compounds were significantly higher than the monounsaturated and saturated fatty acids. Hence, considering the ratio between unsaturated vs. saturated fatty acids, the pollen collected by Mandacaia stingless bee can be an asset as food product due to its nutritional quality. Author Contributions
M.S.B. and C.S.M. performed the experiments and wrote the paper; L.G.D. and G.S.S. analyzed the data and contributed to draft the manuscript; L.M.E. and C.A.L.C. designed the experiments and supervised the work; All the authors revised and approved the paper.
Conflicts of Interest
The authors declare no conflict of interest. References
1. Venturieri, G.C.; Raiol, V.F.O.; Pereira, C.A.B. Avaliação da introdução da criação racional de Melipona fasciculata (Apidae: Meliponina), entre os agricultores familiares de Bragança-PA, Brasil. Biota Neotrop. 2003, 3, 1–7.
2. Contrera, F.A.L.; Menezes, C.; Venturieri, G.C. New horizons on stingless beekeeping (Apidae, Meliponini). R. Bras. Zootec. 2011, 40, 48–51.
4. Kuhn-Neto, B.; Contrera, F.A.L.; Castro, M.S.; Nieh, J.C. Long distance foraging and recruitment by a stingless bee, Melipona mandacaia. Apidologie 2009, 40, 472–480.
5. Batalha-Filho, H.; Waldschmidt, A.M.; Alves, R.M.O. Distribuição potencial da abelha sem ferrão endêmica da caatinga, Melipona mandacaia (Hymenoptera, Apidae). Magistra 2011, 23, 129–133. 6. Rodríguez-Malaver, A.J.; Rasmussen, C.; Gutiérrez, M.G.; Gil, F.; Nieves, B.; Vit, P. Properties of
honey from ten species of Peruvian stingless bees. Nat. Prod. Commun. 2009, 4, 1221–1226. 7. Morais, M.; Moreira, L.; Feás, X.; Estevinho, L.M. Honeybee-collected pollen from five Portuguese
Natural Parks: Palynological origin, phenolic content, antioxidant properties and antimicrobial activity. Food Chem. Toxicol. 2011, 49, 1096–1101.
8. Pascoal, A.; Rodrigues, S.; Teixeira, A.; Feás, X.; Estevinho, L.M. Biological activities of commercial bee pollens: Antimicrobial, antimutagenic, antioxidant and anti-inflammatory. Food Chem. Toxicol. 2014, 63, 233–239.
9. Moita, E.; Sousa, C.; Andrade, P.B.; Fernandes, F.; Pinho, B.R.; Silva, L.R.; Valentão, P. Effects of Echium plantagineum L. bee pollen on basophil degranulation: Relationship with metabolic profile. Molecules 2014, 19, 10635–10649.
10. Komosinska-Vassev, K.; Olczyk, P.; Kafmierczak, J.; Mencner, L.; Olczyk, K. Bee pollen: Chemical composition and therapeutic application. Evid. Based Complement. Altern. Med. 2015, 2015, doi:10.1155/2015/297425.
11. Feás, X.; Vázquez-Tato, M.P.; Estevinho, L.; Seijas, J.A.; Iglesias, A. Organic bee pollen: Bioactive compounds, antioxidante activity and microbiological quality. Molecules 2012, 17, 8359–8377. 12. Coronel, B.B.; Grasso, D.; Pereira, S,C.; Fernández, G. Caracterizacón bromatológica del pólen
apícola argentino. Cienc. Docencia Tecnol. 2004, 15, 141–181.
13. Estevinho, L.M.; Rodrigues, S.; Pereira, A.P.; Feás, X. Portuguese bee pollen: Palynological study, nutritional and microbiological evaluation. Int. J. Food Sci. Technol. 2012, 47, 429–435.
14. Argentine Food Code (Código Alimentario Argentino—CAA); De la Canal y Associados: Buenos Aires, Argentina, 1998.
15. Instrução Normativa nº3 de 19 de janeiro de 2001. Regulamentos Técnicos de Identidade e Qualidade de Apitoxina, Cera de Abelha, Geleia Real, Geleia Real Liofilizada, Polen Apicola, Propolis e Extrato de Propolis. Diário Oficial da República Federativa do Brasil, Brasilia, DF, 19 Janurary 2001. Available online: http://www.sfdk.com.br/imagens/lei/MA%20-%20Inst%20Norm %203.htm (accessed on 21 May 2015).
16. Marchini, L.C.; Reis, V.D.A.; Moreti, A.C.C.C. Composição físico-química de amostras de pólen colectado por abelhas Afrecanizadas Apis melífera (Hymenoptera:Apidae) em Piracicaba, Estado de São Paulo. Ciênc. Rural Santa Maria 2006, 36, 949–953.
17. Nogueira, C.; Iglesias, A.; Feás, X.; Estevinho, L.M. Commercial bee pollen with different geographical origins: A comprehensive approach. Int. J. Mol. Sci. 2012, 13, 11173–11187.
18. Almeida-Muradian, L.B.; Pamplona, L.C.; Coimbra, S.; Barth, O.M. Chemical composition and botanical evaluation of dried bee pollen pellets. J. Food Compos. Anal. 2005, 18, 105–111.
19. Bonvehí, J.S.; Jordà, R.E. Nutrient composition and microbiological quality of honeybee-collected pollen in Spain. J. Agric. Food Chem. 1997, 45, 725–732.
21. González-Martín, I.; Hermández-Hierro, J.M.; Barros-Ferreiro, N.; Marcos, C.C.; García-Villanova, R.J. Use of NIRS technology with a remote reflectance fibre-optic probe for predicting major components in bee pollen. Talanta 2007, 72, 998–1003.
22. Carpes, S.T. Estudo das características Físico-Químicas e biológicas do pólen apícola de Apis mellifera L. da região Sul do Brasil. PH.D. Thesis, Tese apresentada ao Programa de Pós-Graduação em Tecnologia de Alimentos, Sector de Tecnologia da Universidade Federal do Paraná, Paraná, Brazil, 2008.
23. Silva, T.M.S.; Camara, C.A.; Lins, A.C.S.; Barbosa-Filho, J.M.; Silva, E.M.S.; Freitas, B.M.; Santos, F.A.R. Chemical composition and free radical scavenging activity of pollen loads from stingless bee Melipona subnitida Ducke. J. Food Compos. Anal. 2006, 19, 507–511.
24. Carpes, S.T.; Cabral, I.S.R.; Rosalen, P.L.; Alencar, S.M.; Masson, M.L. Caracterização do potencial antimicrobiano dos extratos de pólen apícola da região sul do Brasil. Aliment. Nutr. 2009, 20, 271–277.
25. Carpes, S.T.; Begnini. R.; Alencar, M.; Masson, M.L. Study of preparations of bee pollen extracts, antioxidantand antibacterial activity. Ciênc. Agrotecnol. 2007, 31, 1818–1825.
26. LeBlanc, B.W.; Davis, O.K.; Boue, S.; DeLucca, A.; Deeby. T. Antioxidant activity of Sonoran Desert bee pollen. Food Chem. 2009, 115, 1299–1305.
27. Leja, M.; Mareczek, A.; Wyżgolik, G.; Klepacz-Baniak, J.; Czekoń, K. Antioxidative properties of bee pollen in selected plant species. Food Chem. 2007, 100, 237–240.
28. Mărghitas, L.A.; Stanciu, O.G.; Dezmirean, D.S.; Bobiş, O.; Popescu, O.; Bogdanov, S.; Campos, M.G. In vitro antioxidant capacity of honeybee-collected pollen of selected floral origin harvested from Romania. Food Chem. 2009, 115, 878–883.
29. Saa-Otero, M.P.; Díaz-Losada, E.; Fernández-Gómez, E. Analysis of fatty acids, proteins and ethereal extract in honeybee pollen: Considerations of their floral origin. Grana 2000, 39, 175–181.
30. Isidorov, V.A.; Isidorova, A.G.; Sczczepaniak, L.; Czyzewska, U. Gas chromatographic-mass spectrometric investigation of the chemical composition of beebread. Food Chem. 2009, 115, 1056–1063.
31. Microbiologia Alimentar—Preparação da amostra para análise microbiológica. In Norma Portuguesa (NP) 1829; Instituto Português de Qualidade (IPQ): Lisboa, Portugal, 1982.
32. Microbiologia Alimentar—Regras gerais para a contagem de microrganismos a 30 °C. In Norma Portuguesa (NP) 3788; Instituto Português da Qualidade (IPQ): Lisboa, Portugal, 2002.
33. Microbiology of Food and Animal Feeding Stuffs—Horizontal Method for the Enumeration of Yeasts and Moulds—Part 2: Colony Count Technique in Products with Water Activity Less Than or Equal to 0.95. In ISO 21527-2; International Standards Organization: Winterthur, Switzerland, 2006. 34. Microbiology of food and animal feeding stuffs—Horizontal method for the enumeration of
sulfite-reducing bacteria growing under anaerobic conditions. In ISO 15213; International Standards Organization: Winterthur, Switzerland, 2003.
35. Detection and confirmed quantitation of coliforms and E. coli in foods SimPlate coliform and E. coli color indicator first action. In AOAC-Official Method 2005.03; Association of Official Analytical Chemists: Arlington, VA, USA, 2005.
37. Microbiologia Alimentar—Regras gerais para contagem de Estafilococos coagulase positiva (Staphylococcus aureus e outras espécies). Parte 1:Técnica com confirmação de colónias (método corrente). In Norma Portuguesa (NP) 4400-1; Instituto Português da Qualidade (IPQ): Lisboa, Portugal, 2002.
38. AOAC-Official Methods of Analysis, 16th ed.; Association of Official Analytical Chemists: Arlington, VA, USA, 1995.
39. Instituto Adolfo Lutz. Métodos Físico-Químicos Para Análise de Alimentos, 4th ed.; Ministry of Health: Brasilia, Brazil, 2005.
40. Official Method of Analysis of the AOAC, 15th ed.; AOAC International; Association of Official Analytical Chemists Inc.: Rockville, MD, USA, 1990; pp. 31–46.
41. Van Soest, P.J.; Robertson, J.B.; Lewis, B.A. Methods for dietary fiber, neutral detergent fiber, and nonstarch polysaccharides in relation to animal nutrition. J. Dairy Sci. 1991, 74, 3583–3597. 42. Komarek, A.R. A filter bag procedure for improved efficiency of fiber analysis. J. Dairy Sci. 1993,
76 (Suppl. 1), 250.
43. Senger, C.C.D.; Kozloski, G.V.; Snachez, L.M.B.; Mesquita, F.R.; Aaves, T.P.; Castagnino, D. S. Evalution of autoclave procedures for fibre analysis in forage and concetrate feedstuffs. Anim. Feed Sci. Technol. 2008, 146, 169–174.
44. Moreira, L.; Dias, L.G.; Pereira, J.A.; Estevinho, L. Antioxidant properties, total phenols and pollen analysis of própolis sample from Portugal. Food Chem. Toxicol. 2008, 46, 3482–3485.
45. Silva, R.N.; Monteiro, V.N.; Alcanfor, J.A.X.; Assis, E.M.; Asquieri, E.R. Comparision methods for the determination of reducers sugars and total in honey. Food Sci. Technol. (Camp.) 2003, 23, 337–341.
46. Dalgaarde, P. Introductory Statistics with R (Statistics and Computing); Springer-Verlag New York: New York, NY, USA, 2008.
47. Rencher, A.C. Methods of Multivariate Analysis; Wiley: New York, NY, USA, 1995.
48. R Project for Statistical Computing. Available online: http://www.r-project.org/ (accessed on 23 May 2015).
Sample Availability: Not available.